Fluids, Electrolytes, and Acid–Base Physiology
Donald S. Prough
J. Sean Funston
Christer H. Svensén
Scott W. Wolf
Key Points
Related Matter
Renal Regulation of Water
Hyponatremia Rapid Correction
Hyperkalemia
As a consequence of underlying diseases and of therapeutic manipulations, surgical patients develop potentially harmful disorders of acid–base equilibrium, intravascular and extravascular volume, and serum electrolytes. Precise perioperative management of acid–base status, fluids, and electrolytes may limit perioperative morbidity and mortality.
Acid–Base Interpretation and Treatment
Management of perioperative acid–base disturbances requires an understanding of the four simple acid–base disorders—metabolic alkalosis, metabolic acidosis, respiratory alkalosis, and respiratory acidosis—as well as more complex combinations of disturbances. This section will review the pathogenesis, major complications, physiologic compensatory mechanisms, and treatment of common perioperative acid–base abnormalities.
Overview of Acid–Base Equilibrium
where 6.1 = the pKa of carbonic acid and 0.03 is the solubility coefficient in blood of carbon dioxide (CO2). Within this context, pH is the dependent variable while the bicarbonate concentration [HCO3−] and PaCO2 are independent variables; therefore, metabolic alkalosis and acidosis are defined as disturbances in which [HCO3−] is primarily increased or decreased and respiratory alkalosis and acidosis are defined as disturbances in which PaCO2 is primarily decreased or increased. pH, the negative logarithm of the hydrogen ion concentration ([H+]), defines the acidity or alkalinity of solutions or blood. The simpler Henderson equation, after conversion of pH to [H+], also describes the relationship between the three major variables measured or calculated in blood gas samples:
Table 14-1. Generation of Metabolic Alkalosis | ||||||
|---|---|---|---|---|---|---|
| ||||||
To approximate the logarithmic relationship of pH to [H+], assume that [H+] is 40 mmol/L at a pH of 7.4; that an increase in pH of 0.10 pH units reduces [H+] to 0.8 × the starting [H+] concentration; that a decrease in pH of 0.10 pH units increases the [H+] by a factor of 1.25; and that small changes (i.e., <0.05 pH units) produce reciprocal increases or decreases of approximately 1 mmol/L in [H+] for each 0.01 decrease or increase in pH units.
The alternative “Stewart” approach to acid–base interpretation distinguishes between the independent variables and dependent variables that determine pH.1,2 The independent variables are PaCO2, the strong (i.e., highly dissociated) ion difference, and the concentration of proteins, which usually are not strong ions. The strong ions include sodium (Na+), potassium (K+), chloride (Cl−), and lactate. The strong ion difference, calculated as (Na+ + K+ – Cl−), under normal circumstances is approximately 42 mEq/L. In general, the Stewart approach provides more insight into the mechanisms underlying acid–base disturbances, in contrast to the more descriptive Henderson–Hasselbalch approach. However, the clinical interpretation or treatment of common acid–base disturbances is rarely handicapped by the simpler constructs of the conventional Henderson–Hasselbalch or Henderson equations.
Metabolic Alkalosis
Table 14-2. Factors That Maintain Metabolic Alkalosis | ||||||||||||||||
|---|---|---|---|---|---|---|---|---|---|---|---|---|---|---|---|---|
| ||||||||||||||||
In patients in whom arterial blood gasses have not yet been obtained, serum electrolytes and a history of major risk factors, such as vomiting, nasogastric suction, or chronic diuretic use, can suggest metabolic alkalosis. Total CO2 (usually abbreviated on electrolyte reports as CO2) should be about 1 mEq/L greater than [HCO3−] on simultaneously obtained arterial blood gasses. If either calculated [HCO3−] on the arterial blood gasses or “CO2” on the serum electrolytes exceeds normal (24 and 25 mEq/L, respectively) by >4 mEq/L, either the patient has a primary metabolic alkalosis or has conserved bicarbonate in response to chronic hypercarbia. Recognition of hyperbicarbonatemia on the preoperative serum electrolytes justifies arterial blood gas analysis and should alert the anesthesiologist to the likelihood of factors that generate or maintain metabolic alkalosis (see Tables 14-1 and 14-2).
Treatment of metabolic alkalosis consists of etiologic and nonetiologic therapies. Etiologic therapy consists of measures such as expansion of intravascular volume or the administration of potassium. Infusion of 0.9% saline will dose-dependently increase serum [Cl−] and decrease serum [HCO3−].4 Nonetiologic therapy includes administration of acetazolamide (a carbonic anhydrase inhibitor that causes renal bicarbonate wasting), infusion of [H+] in the form of ammonium chloride, arginine hydrochloride, or 0.1 N hydrochloric acid (100 mmol/L), or dialysis against a high-chloride/low bicarbonate dialysate.3 Of the previously mentioned factors, 0.1 N hydrochloric acid most rapidly corrects life-threatening metabolic alkalosis but must be infused into a central vein; peripheral infusion will cause severe tissue damage.
Table 14-3. Respiratory Compensation in Response to Metabolic Alkalosis and Metabolic Acidosis | ||||
|---|---|---|---|---|
|
Metabolic Acidosis
Calculation of the anion gap [(Na+ – ([Cl−] + [HCO3−])] distinguishes between two types of metabolic acidosis (Table 14-4).8 The anion gap is normal (<13 mEq/L) in situations such as diarrhea, biliary drainage, and renal tubular acidosis in which bicarbonate is lost externally. The anion gap is also normal or reduced in hyperchloremic acidosis associated with perioperative infusion of substantial quantities of 0.9% saline.4,9 Metabolic acidosis associated with a high anion gap (>13 mEq/L) occurs because of excess production or decreased excretion of organic acids or ingestion of one of several toxic compounds (Table 14-4). In metabolic acidosis associated with a high anion gap, bicarbonate ions are consumed in buffering hydrogen ions, while the associated anion replaces bicarbonate in serum. Because three quarters of the normal anion gap consists of albumin, the calculated anion gap should be corrected for hypoalbuminemia by adding to the calculated anion gap, the difference between measured serum albumin and normal albumin concentration of 4 g/dL multiplied by 2 to 2.5.10 In general, an increase in the albumin-corrected anion gap (ΔAG) should be approximately matched by a decrease in the serum [HCO3−] (ΔHCO3−).11 A ratio of ΔAG:ΔHCO3− that
is <0.8 or >1.2 should prompt consideration of a mixed acid–base disturbance.
is <0.8 or >1.2 should prompt consideration of a mixed acid–base disturbance.
Table 14-4. Differential Diagnosis of Metabolic Acidosis | ||||||
|---|---|---|---|---|---|---|
| ||||||
The anesthetic implications of metabolic acidosis are proportional to the severity of the underlying process. Although a patient with hyperchloremic metabolic acidosis may be relatively healthy, those with lactic acidosis, ketoacidosis, uremia, or toxic ingestions will be chronically or acutely ill. Preoperative assessment should emphasize volume status and renal function. If shock has caused metabolic acidosis, direct arterial pressure monitoring and preload may require assessment via echocardiography or pulmonary arterial catheterization. Intraoperatively, one should be concerned about the possibility of exaggerated hypotensive responses to drugs and positive pressure ventilation. In planning intravenous fluid therapy, consider that balanced salt solutions tend to increase [HCO3−] (e.g., by metabolism of lactate to bicarbonate) and pH and 0.9% saline tends to decrease [HCO3−] and pH.
Table 14-5. Failure to Maintain Appropriate Ventilatory Compensation for Metabolic Acidosisa | |||||||||||||||||||||||||
|---|---|---|---|---|---|---|---|---|---|---|---|---|---|---|---|---|---|---|---|---|---|---|---|---|---|
| |||||||||||||||||||||||||
The treatment of metabolic acidosis consists of the treatment of the primary pathophysiologic process, that is, hypoperfusion, hypoxia, and if pH is severely decreased, administration of NaHCO3−. Hyperventilation, although an important compensatory response to metabolic acidosis, is not a definitive therapy for metabolic acidosis. The initial dose of NaHCO3 can be calculated as:
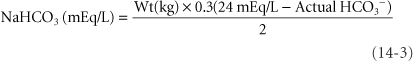
where 0.3 = the assumed distribution space for bicarbonate and 24 mEq/L is the normal value for [HCO3−] on arterial blood gas determination. The calculation markedly underestimates dosage in severe metabolic acidosis. In infants and children, a customary initial dose is 1 to 2 mEq/kg of body weight.
Respiratory Alkalosis
Respiratory alkalosis, always characterized by hypocarbia (PaCO2 ≤ 35 mm Hg) and usually characterized by an alkalemic pH (>7.45), results from an increase in minute ventilation that is greater than that required to excrete metabolic CO2 production. Because respiratory alkalosis may be a sign of pain, anxiety, hypoxemia, central nervous system disease, or systemic sepsis, the development of spontaneous respiratory alkalosis in a previously normocarbic patient requires prompt evaluation. The hyperventilation syndrome, a diagnosis of exclusion, is most often encountered in the emergency department.16
Respiratory alkalosis, such as metabolic alkalosis, may produce hypokalemia, hypocalcemia, cardiac dysrhythmias, bronchoconstriction, and hypotension, and may potentiate the toxicity of digoxin. In addition, both brain pH and cerebral blood flow are tightly regulated and respond rapidly to changes in systemic pH.17
Doubling minute ventilation reduces PaCO2 to 20 mm Hg and halves cerebral blood flow; conversely, halving minute ventilation doubles PaCO2 and doubles cerebral blood flow. Therefore, acute hyperventilation may be useful in neurosurgical procedures to reduce brain bulk and to control intracranial pressure (ICP) during emergent surgery for noncranial injuries associated with acute closed head trauma. In those situations, intraoperative monitoring of arterial blood gasses, correlated with capnography, will document adequate reduction of PaCO2. Acute profound hypocapnia (<20 mm Hg) may produce electroencephalographic evidence of cerebral ischemia. If PaCO2 is maintained at abnormally high or low levels for 8 to 24 hours, cerebral blood flow will return toward previous levels, associated with a return of cerebrospinal fluid [HCO3−] toward normal.
Doubling minute ventilation reduces PaCO2 to 20 mm Hg and halves cerebral blood flow; conversely, halving minute ventilation doubles PaCO2 and doubles cerebral blood flow. Therefore, acute hyperventilation may be useful in neurosurgical procedures to reduce brain bulk and to control intracranial pressure (ICP) during emergent surgery for noncranial injuries associated with acute closed head trauma. In those situations, intraoperative monitoring of arterial blood gasses, correlated with capnography, will document adequate reduction of PaCO2. Acute profound hypocapnia (<20 mm Hg) may produce electroencephalographic evidence of cerebral ischemia. If PaCO2 is maintained at abnormally high or low levels for 8 to 24 hours, cerebral blood flow will return toward previous levels, associated with a return of cerebrospinal fluid [HCO3−] toward normal.
Treatment of respiratory alkalosis per se is often not required. The most important steps are recognition and treatment of the underlying cause.16 For instance, correction of hypoxemia or hypoperfusion-induced lactic acidosis should result in resolution of the associated increases in respiratory drive. Preoperative recognition of chronic hyperventilation necessitates intraoperative maintenance of a similar PaCO2.
Respiratory Acidosis
Respiratory acidosis, always characterized by hypercarbia (PaCO2 ≤ 45 mm Hg) and usually characterized by a low pH (<7.35), occurs because of a decrease in minute alveolar ventilation (VA), an increase in production of carbon dioxide (VCO2) or both, from the equation:
where K = constant (rebreathing of exhaled, carbon dioxide–containing gas may also increase PaCO2). Respiratory acidosis may be either acute, without compensation by renal [HCO3−] retention, or chronic, with [HCO3−] retention offsetting the decrease in pH (Table 14-6). A reduction in VA may be due to an overall decrease in minute ventilation (VE) or to an increase in the amount of wasted ventilation (VD), according to the equation:
Table 14-6. Changes of [HCO3−] and pH in Response to acute and Chronic Changes in PaCO2 | ||
|---|---|---|
|
Decreases in VE may occur because of central ventilatory depression by drugs or central nervous system injury because of increased work of breathing, or because of airway obstruction or neuromuscular dysfunction. Increases in VD occur with chronic obstructive pulmonary disease, pulmonary embolism, and most acute forms of respiratory failure. VCO2 may be increased by sepsis, high-glucose parenteral feeding, or fever.
Patients with chronic hypercarbia due to intrinsic pulmonary disease require careful preoperative evaluation. The ventilatory restriction imposed by upper abdominal or thoracic surgery may aggravate ventilatory insufficiency after surgery. Administration of narcotics and sedatives, even in small doses, may cause hazardous ventilatory depression. Preoperative evaluation should consider direct arterial pressure monitoring and frequent intraoperative blood gas determinations, as well as strategies to manage postoperative pain with minimal doses of systemic opioids. Intraoperatively, a patient with chronically compensated hypercapnia should be ventilated to maintain a normal pH. Inadvertent restoration of normal VA may result in profound alkalemia. Postoperatively, prophylactic ventilatory support may be required for selected patients with chronic hypercarbia.
The treatment of respiratory acidosis depends on whether the process is acute or chronic. Acute respiratory acidosis may require mechanical ventilation unless a simple etiologic factor (i.e., narcotic overdosage or residual muscular blockade) can be treated quickly. Bicarbonate administration is rarely indicated unless severe metabolic acidosis is also present or unless mechanical ventilation is ineffective in reducing acute hypercarbia. In contrast, chronic respiratory acidosis is rarely managed with ventilation but rather with efforts to improve pulmonary function. In patients requiring mechanical ventilation for acute respiratory failure, ventilation with a lung-protective strategy may result in hypercapnia, which occasionally may require administration of buffers to avoid excessive acidemia.18
Practical Approach to Acid–Base Interpretation
Rapid interpretation of a patient’s acid–base status involves the integration of three sets of data: Arterial blood gasses, electrolytes, and history. A systematic, sequential approach facilitates interpretation (Table 14-7). Acid–base assessment usually can be completed before initiating therapy; however, inspection of arterial blood gas data may disclose disturbances (e.g., respiratory acidosis or metabolic acidosis with pH < 7.1) that require immediate attention.
The second step is to determine whether a patient is acidemic (pH < 7.35) or alkalemic (pH > 7.45). The pH status will usually indicate the predominant primary process, that is, acidosis produces acidemia and alkalosis produces alkalemia. Note that the suffix “-osis” indicates a primary process that, if unopposed, will produce the corresponding pH change. The suffix “-emia” refers to the pH. A compensatory process is not considered an “-osis.” Of course, a patient may have mixed “-oses,” that is, more than one primary process.
The third step is to determine whether the entire arterial blood gas picture is consistent with a simple acute respiratory alkalosis or acidosis (see Table 14-6). For example, a patient with
acute hypocapnia (PaCO2 30 mm Hg) would have a pH increase of 0.10 units to a pH of 7.50 and a decrease of calculated [HCO3−] to 22 mEq/L.
acute hypocapnia (PaCO2 30 mm Hg) would have a pH increase of 0.10 units to a pH of 7.50 and a decrease of calculated [HCO3−] to 22 mEq/L.
Table 14-7. Sequential Approach to Acid–Base Interpretation | |
|---|---|
|
As the fourth step, if changes in PaCO2, pH, and [HCO3−] are not consistent with a simple acute respiratory disturbance, chronic respiratory acidosis (≥24 hours) or metabolic acidosis or alkalosis should be considered. In chronic respiratory acidosis, pH returns to nearly normal as bicarbonate is retained by the kidneys (Table 14-6), usually at a ratio of 4 to 5 mEq/L per 10 mm Hg chronic increase in PaCO2.19 For example, chronic hypoventilation at a PaCO2 of 60 mm Hg would be associated with an increase in [HCO3−] of 8 to 10 mEq/L so that [HCO3−] would be expected to range from 32 to 34 mEq/L and pH would be expected to be within the low normal range (7.35 to 7.38). If neither an acute nor chronic respiratory change appears to explain the arterial blood gas data, then a metabolic disturbance must also be present.
The fifth question addresses respiratory compensation for metabolic disturbances. Respiratory compensation for metabolic disturbances occurs more rapidly than renal compensation for respiratory disturbances (Table 14-3). Several general rules describe compensation. First, overcompensation is rare. Second, inadequate or excessive compensation suggests an additional primary disturbance. Third, hypobicarbonatemia associated with an increased anion gap is never compensatory.
The sixth question, whether an anion gap is present, should be assessed even if the arterial blood gasses appear straightforward. The simultaneous occurrence of metabolic alkalosis and metabolic acidosis may result in an unremarkable pH and [HCO3−]; therefore, the combined abnormality may only be appreciated by examining the anion gap (if the cause of the metabolic acidosis is associated with a high anion gap). As noted previously, correct assessment of the anion gap requires correction for hypoalbuminemia.10 Metabolic acidoses associated with increased anion gaps require specific treatments, thus necessitating a correct diagnosis and differentiation from hyperchloremic metabolic acidosis. For instance, if metabolic acidosis results from administration of large volumes of 0.9% saline, no specific treatment of metabolic acidosis would usually be necessary.
The seventh and final question is whether the clinical data are consistent with the proposed acid–base interpretation. Failure to integrate clinical findings with arterial blood gas and plasma electrolyte data may lead to serious errors in interpretation and management.
Table 14-8. Hyperchloremic Metabolic Acidosis During Prolonged Surgery | ||||||||||||||||||||||||
|---|---|---|---|---|---|---|---|---|---|---|---|---|---|---|---|---|---|---|---|---|---|---|---|---|
|
Examples
The following two hypothetical cases illustrate the use of the algorithm and rules of thumb previously discussed.
Example Number 1
A 65-year-old woman has undergone 12 hours of an expected 16-hour radical neck dissection and flap construction. Estimated blood loss is 1,000 mL. She has received three units of packed red blood cells and 6 L of 0.9% saline. Her blood pressure and heart rate have remained stable while anesthetized with 0.5% to 1% isoflurane in 70:30 nitrous oxide and oxygen. Urinary output is adequate. Arterial blood gas levels are shown in Table 14-8.
The step-by-step interpretation is as follows:
The pH requires no immediate treatment.
The pH is normal.
The arterial blood gasses cannot be adequately explained by acute hypocarbia. The predicted pH would be 7.48 and the predicted [HCO3−] would be 22 mEq/L (see Table 14-6).
A metabolic acidosis appears to be present.
Patients under general anesthesia with controlled mechanical ventilation cannot compensate for metabolic acidosis. However, spontaneous hypocapnia of this magnitude would represent slight overcompensation for metabolic acidosis (see Table 14-3) and would suggest the presence of a primary respiratory alkalosis.
Metabolic acidosis occurring during prolonged anesthesia and surgery could suggest lactic acidosis and prompt additional fluid therapy or other attempts to improve perfusion. However, serum electrolytes reveal an anion gap that is slightly less than normal (Table 14-8), indicating that the metabolic acidosis is probably the result of dilution of the ECV with a high-chloride fluid. Correction of the anion gap for the serum albumin of 3 g/dL only increases the anion gap to 10 to 11 mEq/L, again consistent with hyperchloremic metabolic acidosis. After differentiation from high anion gap metabolic acidoses, hyperchloremic acidosis secondary to infusion of high-chloride fluid usually requires no treatment. The arterial blood gasses and serum electrolytes are compatible with the clinical picture.
Example Number 2
A 35-year-old man, 3 days after appendectomy, develops nausea with recurrent emesis persisting for 48 hours. An arterial
blood gas reveals the results shown in the middle column of Table 14-9.
blood gas reveals the results shown in the middle column of Table 14-9.
Table 14-9. Metabolic Alkalosis Secondary to Nausea and Vomiting with Subsequent Lactic Acidosis Secondary to Hypovolemia | ||||||||||||||||||||||||||||||||||||||||
|---|---|---|---|---|---|---|---|---|---|---|---|---|---|---|---|---|---|---|---|---|---|---|---|---|---|---|---|---|---|---|---|---|---|---|---|---|---|---|---|---|
|
The pH of 7.50 requires no immediate intervention.
The pH is alkalemic, suggesting a primary alkalosis.
An acute PaCO2 of 46 mm Hg would yield a pH of approximately 7.37; therefore, this is not simply an acute ventilatory disturbance.
The patient has a primary metabolic alkalosis as suggested by the [HCO3−] of 35 mEq/L.
The limits of respiratory compensation for metabolic alkalosis are wide and difficult to predict for individual patients. The rules of thumb, summarized in Table 14-3, suggest that [HCO3−] + 15 should equal the last two digits of the pH and that the PaCO2 should increase 5 to 6 mm Hg for every 10 mEq/L change in serum [HCO3−]; that is, a pH of 7.50 and a PaCO2 of 46 mm Hg are within the expected range.
The anion gap is 10 mEq/L.
The diagnosis of a primary metabolic alkalosis with compensatory hypoventilation is consistent with the history of recurrent vomiting. Consider how the arterial blood gasses could change if vomiting were sufficiently severe to produce hypovolemic shock and lactic acidosis (third column, Table 14-9).
This sequence illustrates the important concept that the final pH, PaCO2, and [HCO3−] represent the result of all of the vectors operating on acid–base status. Complex or “triple disturbances” can only be interpreted using a thorough, stepwise approach.
Fluid Management
Physiology
Body Fluid Compartments
Accurate replacement of fluid deficits necessitates an understanding of the expected distribution spaces of water, sodium, and colloid. The sum of intracellular volume (ICV), which constitutes 40% of total body weight, and extracellular volume, which constitutes 20% of body weight, comprises total body water (TBW), which therefore approximates 60% of total body weight. PV, equals about one-fifth of ECV, the remainder of which is interstitial fluid volume (IFV). Red cell volume, approximately 2 L, is part of ICV.
The distribution volume of sodium-free water is TBW. The distribution volume of infused sodium is ECV, which contains equal sodium concentrations ([Na+]) in the PV and IF. Plasma [Na+] is approximately 140 mEq/L. The predominant intracellular cation, potassium, has an intracellular concentration ([K+]) approximating 150 mEq/L. Albumin, the most important oncotically active constituent of ECV, is unequally distributed in PV (∼4 g/dL) and IFV (∼1 g/dL). The IFV concentration of albumin varies greatly among tissues; however, ECV is the distribution volume for colloid solutions.
Distribution of Infused Fluids
Conventionally, clinical prediction of PV expansion after fluid infusion assumes that body fluid spaces are static. Kinetic analysis of PV expansion replaces the static assumption with a dynamic description. As an example of the static approach, assume that a 70 kg patient has suffered an acute blood loss of 2,000 mL, approximately 40% of the predicted 5 L blood volume. The formula describing the effects of replacement with 5% dextrose in water (D5W), lactated Ringer solution, or 5% or 25% human serum albumin is as follows:
Rearranging the equation yields the following:
To restore blood volume using D5W, assuming a distribution volume for sodium-free water of TBW, requires 28 L:
where 2 L is the desired PV increment, 42 L = TBW in a 70 kg person, and 3 L is the normal estimated PV.
To restore blood volume using lactated Ringer solution requires 9.1 L:
where 14 L = ECV in a 70 kg person.
If 5% albumin, which exerts colloid osmotic pressure similar to plasma, were infused, the infused volume initially would remain in the PV, perhaps attracting additional interstitial fluid intravascularly. Twenty-five percent human serum albumin, a concentrated colloid, expands PV by approximately 400 mL for each 100 mL infused.
However, these static analyses are simplistic. Infused fluid does not simply equilibrate throughout an assumed distribution
volume but is added to a highly regulated system that attempts to maintain intravascular, interstitial, and intracellular volume. A more comprehensive kinetic model was proposed by Svensén and Hahn.20 Kinetic models of intravenous fluid therapy allow clinicians to predict more accurately the time course of volume changes produced by infusions of fluids of various compositions. Kinetic analysis permits estimation of peak volume expansion and rates of clearance of infused fluid and complements analysis of “pharmacodynamic” effects, such as changes in cardiac output or cardiac filling pressures.21
volume but is added to a highly regulated system that attempts to maintain intravascular, interstitial, and intracellular volume. A more comprehensive kinetic model was proposed by Svensén and Hahn.20 Kinetic models of intravenous fluid therapy allow clinicians to predict more accurately the time course of volume changes produced by infusions of fluids of various compositions. Kinetic analysis permits estimation of peak volume expansion and rates of clearance of infused fluid and complements analysis of “pharmacodynamic” effects, such as changes in cardiac output or cardiac filling pressures.21
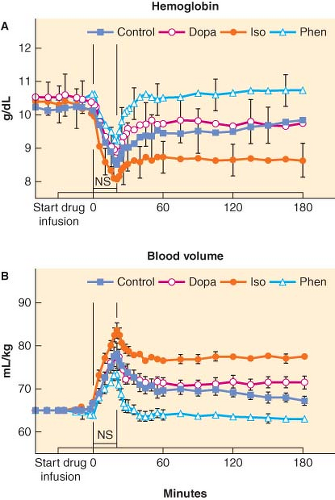 Figure 14.1. A: Blood hemoglobin (mean ± SEM) sampled at three baseline periods during a 30-minute catecholamine infusion and for 3 hours after starting a 20-minute 0.9% NaCl bolus of 24 mL/kg. Catecholamine protocols are dopamine (Dopa, open diamonds), isoproterenol (Iso, closed circles), phenylephrine (Phen, open triangles), and no-drug control (Control, closed squares). The 0.9% NaCl bolus decreased hemoglobin in all protocols at the end of the 20-minute 0.9% NaCl infusion and in all protocols except the Phen protocol thereafter. Post infusion protocol differences were Phen > Dopa = Control > Iso. B: Calculated blood volume (mean ± SEM) at three baseline periods during a catecholamine infusion and for 3 hours after starting a 20-minute 0.9% NaCl bolus of 24 mL/kg. The 0.9% NaCl bolus increased blood volume in all protocols at T20 and in all protocols except the Phen protocol thereafter. Post infusion protocol differences were Iso > Dopa = Control > Phen. NS, normal saline bolus. (From: Vane LA, Prough DS, Kinsky MA, et al. Effects of different catecholamines on the dynamics of volume expansion of crystalloid infusion. Anesthesiology. 2004;101:1136–1144, with permission.) |
Using a kinetic approach to fluid therapy permits analysis of the effects of common physiologic and pharmacologic influences on fluid distribution in experimental animals or humans. For example, in chronically instrumented sheep, isoflurane anesthesia and the conscious state were associated with similar kinetics of PV expansion after fluid infusion, but reduced urinary output in anesthetized sheep demonstrated that expansion of extravascular volume was relatively greater during anesthesia; this effect was attributable to isoflurane and not to mechanical ventilation during anesthesia.22 Also in chronically instrumented sheep, administration of catecholamine infusions before and during fluid infusions profoundly altered intravascular fluid retention, with phenylephrine diminishing and isoproterenol enhancing intravascular fluid retention (Fig. 14-1).23
Regulation of Extracellular Fluid Volume
TBW content is regulated by the intake and output of water. Water intake includes ingested liquids plus an average of 750 mL ingested in solid food and 350 mL that is generated metabolically. Insensible losses are normally 1 L/day and gastrointestinal losses are 100 to 150 mL/day. Thirst, the primary mechanism of controlling water intake, is triggered by an increase in body fluid tonicity or by a decrease in ECV.
Plasma hypotonicity suppresses ADH release, resulting in excretion of dilute urine. Hypertonicity stimulates ADH secretion, which increases the permeability of the collecting duct to water and enhances water reabsorption. In response to changing plasma [Na+], changing secretion of ADH can vary urinary osmolality from 50 to 1,200 mOsm/kg and urinary volume from 0.4 to 20 L/day (Fig. 14-3).25 Other factors that stimulate ADH secretion, although none as powerfully as plasma tonicity, include hypotension, hypovolemia, and nonosmotic stimuli such as nausea, pain, and medications, including opiates.
Two powerful hormonal systems regulate total body sodium. The natriuretic peptides, ANP, brain natriuretic peptide, and C-type natriuretic peptide, defend against sodium overload26,27,28 and the renin–angiotensin–aldosterone axis defends against sodium depletion and hypovolemia. ANP, released from the cardiac atria in response to increased atrial stretch, exerts vasodilatory effects and increases the renal excretion of sodium and water. ANP secretion is decreased during hypovolemia. Even in patients with chronic (nonoliguric) renal insufficiency, infusion of ANP in low, nonhypotensive doses increased sodium excretion and augmented urinary losses of retained solutes.29
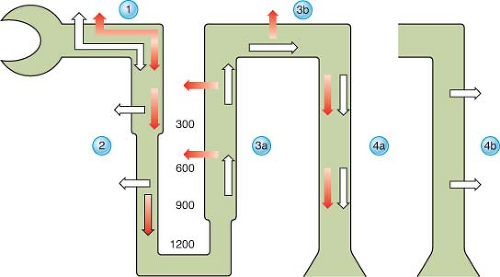 Figure 14.2. Renal filtration, reabsorption, and excretion of water. Open arrows represent water and solid arrows represent electrolytes. Water and electrolytes are filtered by the glomerulus. In the proximal tubule (1), water and electrolytes are absorbed isotonically. In the descending loop of Henle (2), water is absorbed to achieve osmotic equilibrium with the interstitium while electrolytes are retained. The numbers (300, 600, 900, and 1200) between the descending and ascending limbs represent the osmolality of the interstitium in milliosmoles per kilogram. The delivery of solute and fluid to the distal nephron is a function of proximal tubular reabsorption; as proximal tubular reabsorption increases, delivery of solute to the medullary (3a) and cortical (3b) diluting sites decreases. In the diluting sites, electrolyte-free water is generated through selective reabsorption of electrolytes while water is retained in the tubular lumen, generating a dilute tubular fluid. In the absence of vasopressin, the collecting duct (4a) remains relatively impermeable to water and diluted urine is excreted. When vasopressin acts on the collecting ducts (4b), water is reabsorbed from these vasopressin-responsive nephron segments, allowing the excretion of concentrated urine. (From: Fried LF, Palevsky PM. Hyponatremia and hypernatremia. In: Saklayen MG, ed. The Medical Clinics of North America. Renal Disease. Philadelphia, PA: WB Saunders Company; 1997:585–609, with permission.) |
Aldosterone is the final common pathway in a complex response to decreased effective arterial volume, whether decreased effective arterial volume is true or relative, as in edematous states or hypoalbuminemia. In this pathway, decreased stretch in the baroreceptors of the aortic arch and carotid body and stretch receptors in the great veins, pulmonary vasculature, and atria result in increased sympathetic tone. Increased sympathetic tone, in combination with decreased renal perfusion, leads to renin release and formation of angiotensin I from angiotensinogen. Angiotensin-converting enzyme (ACE) converts angiotensin I to angiotensin II, which stimulates the adrenal cortex to synthesize and release aldosterone.30 Acting primarily in the distal tubules, high concentrations of aldosterone cause sodium reabsorption and may reduce urinary excretion of sodium nearly to
zero. Intrarenal physical factors are also important in regulating sodium balance. Sodium loading decreases colloid osmotic pressure, thereby increasing the glomerular filtration rate (GFR), decreasing net sodium reabsorption and increasing distal sodium delivery, which, in turn, suppresses renin secretion.
zero. Intrarenal physical factors are also important in regulating sodium balance. Sodium loading decreases colloid osmotic pressure, thereby increasing the glomerular filtration rate (GFR), decreasing net sodium reabsorption and increasing distal sodium delivery, which, in turn, suppresses renin secretion.
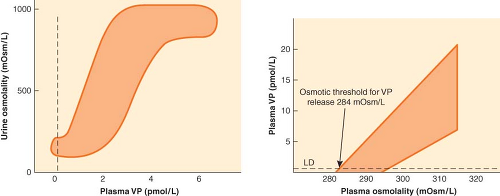 Figure 14.3. Left: The sigmoid relationship between plasma vasopressin (VP) and urinary osmolality. Data were obtained during water loading and fluid restriction in a group of healthy adults. Maximum urinary concentration is achieved by plasma VP values of 3 to 4 pmol/L. Right: The linear relationship between plasma osmolality and plasma VP. Increases in VP in response to hypertonicity induced by infusion of 855 mmol/L saline in a group of healthy adults. The shaded area represents the reference range response. LD represents the limit of detection of the VP assay, 0.3 pmol/L. (From: Ball SG. Vasopressin and disorders of water balance: the physiology and pathophysiology of vasopressin. Ann Clin Biochem. 2007;44:417–431, with permission.) |
Table 14-10. Hourly and Daily Maintenance Water Requirements | ||||||||||||
|---|---|---|---|---|---|---|---|---|---|---|---|---|
|
Fluid Replacement Therapy
Maintenance Requirements for Water, Sodium, and Potassium
Calculation of maintenance fluid requirements is of limited value in determining intraoperative fluid requirements. However, calculation of maintenance fluid requirements (Table 14-10) is useful for estimating water and electrolyte deficits that result from preoperative restriction of oral food and fluids and for estimating the ongoing requirements for patients with prolonged postoperative bowel dysfunction. In healthy adults, sufficient water is required to balance gastrointestinal losses of 100 to 200 mL/day, insensible losses of 500 to 1,000 mL/day (half of which is respiratory and half is cutaneous), and urinary losses of 1,000 mL/day. Urinary losses exceeding 1,000 mL/day may represent an appropriate physiologic response to ECV expansion or pathophysiologic inability to conserve salt or water.
Daily adult requirements for sodium and potassium are approximately 75 and 40 mEq/kg respectively, although wider ranges of sodium intake than potassium intake are physiologically tolerated because renal sodium conservation and excretion are more efficient than potassium conservation and excretion. Therefore, healthy, 70 kg adults require 2,500 mL/day of water containing [Na+] of 30 mEq/L and [K+] of 15 to 20 mEq/L. Intraoperatively, fluids containing sodium-free water (i.e., [Na+] < 130 mEq/L) are rarely used in adults because of the necessity for replacing isotonic losses and the risk of postoperative hyponatremia.
Dextrose
Surgical Fluid Requirements
Water and Electrolyte Composition of Fluid Losses
Surgical patients require replacement of PV and ECV losses secondary to wound or burn edema, ascites, and gastrointestinal secretions. Wound and burn edema and ascitic fluid are protein-rich and contain electrolytes in concentrations similar to plasma. Although gastrointestinal secretions vary greatly in composition, the composition of replacement fluid need not be closely matched if ECV is adequate and renal and cardiovascular functions are normal. Substantial loss of gastrointestinal fluids requires more accurate replacement of electrolytes (i.e., potassium, magnesium, phosphate). Chronic gastric losses may produce hypochloremic metabolic alkalosis that can be corrected with 0.9% saline; chronic diarrhea may produce hyperchloremic metabolic acidosis that may be prevented or corrected by infusion of fluid containing bicarbonate or bicarbonate substrate (e.g., lactate). If cardiovascular or renal function is impaired, more precise replacement may require frequent assessment of serum electrolytes.
Influence of Perioperative Fluid Infusion Rates on Clinical Outcomes
therapy in patients undergoing surgery of limited scope, but perhaps at the expense of hypercoagulability.
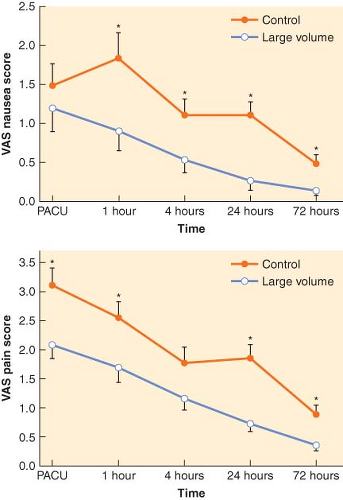 Figure 14.4. Top: Mean postoperative verbal analog scale (VAS) nausea scores in each group over the first 72 postoperative hours. Mean VAS nausea scores were significantly lower in the group that received the large-volume intravenous fluid infusion compared with the control group at 1, 4, 24, and 72 hours postoperatively. Bottom: Mean postoperative VAS pain scores in each group over the first 72 postoperative hours. Mean VAS pain scores were significantly lower in the group that received the large-volume intravenous fluid infusion compared with the control group at 0, 1, 24, and 72 hours postoperatively. *Significantly higher (p < 0.05, t-test postanalysis of variance) VAS score compared with the large volume group. PACU, postanesthesia care unit. (From: Maharaj CH, Kallam SR, Malik A, et al. Preoperative intravenous fluid therapy decreases postoperative nausea and pain in high risk patients. Anesth Analg. 2005;100:675–682, with permission.) |
In patients undergoing major intra-abdominal surgery, recent randomized controlled trials also suggest that restrictive fluid administration is associated with a combination of positive and negative effects. Brandstrup et al.42 randomized 172 elective colon surgery patients to either restrictive perioperative fluid management or standard perioperative fluid management, with the primary goal of maintaining preoperative body weight in the fluid-restricted group. By design, the fluid-restricted group received less perioperative fluid and acutely gained <1 kg in contrast to >3 kg in the standard therapy group. More importantly, cardiopulmonary complications, tissue-healing complications, and total postoperative complications were significantly fewer in the fluid-restricted group. In 152 patients undergoing intra-abdominal surgery, including colon surgery, Nisanevich et al.43 reported less prompt return of gastrointestinal function and longer hospital stays in patients receiving conventional fluid therapy (10 mL/kg/hr of lactated Ringer solution) than in patients receiving restricted fluid therapy (4 mL/kg/hr). In a small clinical trial comparing gastric emptying in patients randomized to receive the postoperative fluids at a restricted (≤2 L/day of water; ≤77 mEq/day) or liberal regimen (≥3 L/day of water; ≥154 mEq/day), gastric emptying time for both liquids and solids was significantly reduced in patients receiving restricted fluids (Fig. 14-5).44 Khoo et al.45 randomized 70 ASA I-III patients undergoing elective colorectal surgery to conventional perioperative management, including intraoperative
fluid management at the discretion of the anesthesiologist, or to multimodal perioperative management, including intraoperative fluid restriction, unrestricted postoperative oral intake, prokinetic agents, early ambulation, and postoperative epidural analgesia. Multimodal perioperative management was associated with a reduced median stay (5 vs. 7 days) and fewer cardiorespiratory and anastomotic complications, but more hospital readmissions. Holte et al.46 randomized 32 ASA I-III patients undergoing “fast-track” colon resection under combined epidural/general anesthesia to intraoperative fluid administration using either a restrictive (median: 1,640 mL; range: 935 to 2,250 mL) or liberal (median: 5,050 mL; range: 3,563 to 8,050 mL) regimen. Fluid-restricted patients had significantly improved postoperative forced vital capacity and fewer, less severe episodes of oxygen desaturation but at the expense of increased stress responses (aldosterone, ADH, and angiotensin II measurements) and a statistically insignificantly increased number of complications. In a recent meta-analysis, Corcoran et al. reviewed 23 randomized trials involving 3,861 patients assigned to liberal or goal-directed therapy during major surgery.47 Patients in both the liberal and goal-directed therapy groups received more fluid during surgery than their respective comparative groups (restrictive fluid administration). However, the patients in the liberal groups had a higher risk of pneumonia (risk ratio 2.2), pulmonary edema (risk ratio 3.8), and longer hospital stay (mean difference 2 days) than their comparative groups. The patients in the goal-directed therapy groups had a lower risk of pneumonia and renal complications (risk ratio 0.7), and shorter hospital stay (mean difference 2 days) compared to the patients in the non goal-directed therapy group. These authors conclude that goal-directed fluid therapy is associated with fewer adverse outcomes than liberal fluid administration that is not goal directed. In addition, they conclude that whether goal-directed therapy is superior to restrictive fluid therapy remains uncertain.
fluid management at the discretion of the anesthesiologist, or to multimodal perioperative management, including intraoperative fluid restriction, unrestricted postoperative oral intake, prokinetic agents, early ambulation, and postoperative epidural analgesia. Multimodal perioperative management was associated with a reduced median stay (5 vs. 7 days) and fewer cardiorespiratory and anastomotic complications, but more hospital readmissions. Holte et al.46 randomized 32 ASA I-III patients undergoing “fast-track” colon resection under combined epidural/general anesthesia to intraoperative fluid administration using either a restrictive (median: 1,640 mL; range: 935 to 2,250 mL) or liberal (median: 5,050 mL; range: 3,563 to 8,050 mL) regimen. Fluid-restricted patients had significantly improved postoperative forced vital capacity and fewer, less severe episodes of oxygen desaturation but at the expense of increased stress responses (aldosterone, ADH, and angiotensin II measurements) and a statistically insignificantly increased number of complications. In a recent meta-analysis, Corcoran et al. reviewed 23 randomized trials involving 3,861 patients assigned to liberal or goal-directed therapy during major surgery.47 Patients in both the liberal and goal-directed therapy groups received more fluid during surgery than their respective comparative groups (restrictive fluid administration). However, the patients in the liberal groups had a higher risk of pneumonia (risk ratio 2.2), pulmonary edema (risk ratio 3.8), and longer hospital stay (mean difference 2 days) than their comparative groups. The patients in the goal-directed therapy groups had a lower risk of pneumonia and renal complications (risk ratio 0.7), and shorter hospital stay (mean difference 2 days) compared to the patients in the non goal-directed therapy group. These authors conclude that goal-directed fluid therapy is associated with fewer adverse outcomes than liberal fluid administration that is not goal directed. In addition, they conclude that whether goal-directed therapy is superior to restrictive fluid therapy remains uncertain.
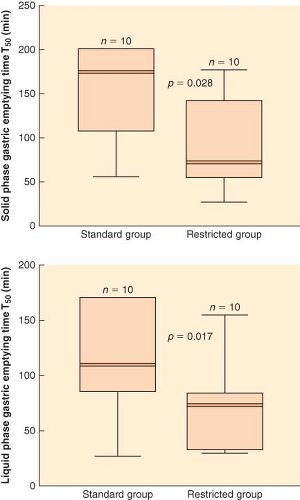 Figure 14.5. Solid and liquid phase gastric emptying times (T50) after 4 days of standard or restricted intravenous postoperative fluid therapy. Solid lines are medians, shaded areas interquartile ranges, and whiskers represent extreme values. Differences between medians for solid and liquid phase T50 were 56 minutes (95% confidence interval: 12 to 132 minutes) and 52 minutes (9 to 95 minutes), respectively. (Reprinted with permission from: Lobo DN, Bostock KA, Neal KR, et al. Effect of salt and water balance on recovery of gastrointestinal function after elective colonic resection: A randomised controlled trial. Lancet. 2002;359:1812.) |
Critically ill patients with acute lung injury represent an important group that may benefit from careful regulation of fluid intake. The ARDS Clinical Trials Network48 randomized 1,000 patients with acute lung injury to a 7-day trial comparing a conservative fluid strategy with a liberal fluid strategy. Over the course of the trial the conservative strategy group had a cumulative net fluid balance that was slightly negative in comparison to a mean net cumulative fluid balance in the liberal group of nearly 7 L. Although overall mortality was no different in the two groups, the conservative fluid group had improved oxygenation and required fewer days of mechanical ventilation and intensive care. Despite achieving a negative fluid balance, the conservative strategy group had no greater incidence of acute renal failure.
Colloids, Crystalloids, and Hypertonic Solutions
Physiology and Pharmacology
Osmotically active particles attract water across semipermeable membranes until equilibrium is attained. The osmolarity of a solution refers to the number of osmotically active particles per liter of solvent; osmolality, a measurement of the number of osmotically active particles per kilogram, can be estimated as follows:
where osmolality is expressed in mmol/kg, [Na+] is expressed in mEq/L, serum glucose is expressed in mg/dL, and BUN is blood urea nitrogen expressed in mg/dL. Sugars, alcohols, and radiographic dyes increase measured osmolality, generating an increased “osmolal gap” between the measured and calculated values.
A hyperosmolar state occurs whenever the concentration of osmotically active particles is high. Both uremia (increased BUN) and hypernatremia (increased serum sodium) increase serum osmolality. However, because urea distributes throughout TBW, an increase in BUN does not cause hypertonicity. Sodium, largely restricted to the ECV, causes hypertonicity, that is, osmotically mediated redistribution of water from ICV to ECV. The term tonicity is also used colloquially to compare the osmotic pressure of a parenteral solution to that of plasma.
Although only a small proportion of the osmotically active particles in blood consist of plasma proteins, those particles are essential in determining the equilibrium of fluid between the interstitial and plasma compartments of ECV. The reflection coefficient (σ) describes the permeability of capillary membranes to individual solutes, with 0 representing free permeability and 1 representing complete impermeability. The reflection coefficient for albumin ranges from 0.6 to 0.9 in various capillary beds. Because capillary protein concentrations exceed interstitial concentrations, the osmotic pressure exerted by plasma proteins (termed colloid osmotic pressure or oncotic pressure) is higher than interstitial oncotic pressure and tends to preserve PV. The filtration rate of fluid from the capillaries into the interstitial space is the net result of a combination of forces, including the gradient from intravascular to interstitial colloid osmotic pressures and the hydrostatic gradient between intravascular and interstitial pressures. The net fluid filtration at any point within a systemic or pulmonary capillary is represented by Starling’s law of capillary filtration, as expressed in the equation:
where Q is the fluid filtration, k is the capillary filtration coefficient (conductivity of water), A is the area of the capillary membrane, Pc is the capillary hydrostatic pressure, Pi is the interstitial hydrostatic pressure, σ is the reflection coefficient for albumin, πi is the interstitial colloid osmotic pressure, and πc is the capillary colloid osmotic pressure.
The IFV is determined by the relative rates of capillary filtration and lymphatic drainage. Pc, the most powerful factor promoting fluid filtration, is determined by capillary flow, arterial resistance, venous resistance, and venous pressure. If capillary filtration increases, the rates of water and sodium filtration usually exceed protein filtration, resulting in preservation of πc, dilution of πi, and preservation of the oncotic pressure gradient, the most powerful factor opposing fluid filtration. When coupled with increased lymphatic drainage, preservation of the oncotic pressure gradient limits the accumulation of IF. If Pc increases at a time when lymphatic drainage is maximal, then IFV accumulates, forming edema.
Clinical Implications of Choices Between Alternative Fluids
If membrane permeability is intact, colloids such as albumin or hydroxyethyl starch preferentially expand PV rather than IFV. Concentrated colloid-containing solutions (e.g., 25% albumin) exert sufficient oncotic pressure to translocate substantial volumes of IFV into the PV, thereby increasing PV by a volume that exceeds the original infused volume. PV expansion unaccompanied by IFV expansion offers apparent advantages: Lower fluid requirements, less peripheral and pulmonary edema accumulation, and reduced concern about the cardiopulmonary consequences of later fluid mobilization (Table 14-11).
However, exhaustive research has failed to establish the superiority of either colloid-containing or crystalloid-containing fluids for either intraoperative or postoperative use. Moretti et al.49 reported that patients who were randomized to receive
6% hetastarch had less postoperative nausea and vomiting than those who received lactated Ringer solution without colloid. In addition, colloid administration appears to have been an essential component of perioperative management strategies that demonstrated improved morbidity after colon surgery42 and after major surgery in conjunction with goal-directed fluid challenges.50,51
6% hetastarch had less postoperative nausea and vomiting than those who received lactated Ringer solution without colloid. In addition, colloid administration appears to have been an essential component of perioperative management strategies that demonstrated improved morbidity after colon surgery42 and after major surgery in conjunction with goal-directed fluid challenges.50,51
Table 14-11. Claimed Advantages and Disadvantages of Colloid Versus Crystalloid Intravenous Fluids | ||||||||||||||||||||||||||||||||||||
|---|---|---|---|---|---|---|---|---|---|---|---|---|---|---|---|---|---|---|---|---|---|---|---|---|---|---|---|---|---|---|---|---|---|---|---|---|
| ||||||||||||||||||||||||||||||||||||
In critically ill patients and patients undergoing more extensive surgery, systematic reviews of available comparisons of colloid versus crystalloid and albumin versus crystalloid suggested that the choice of fluid did not influence mortality.52 A recent randomized controlled trial comparing 4% albumin with 0.9% saline for fluid maintenance in 6,997 critically ill patients supports the conclusion that choice of colloid or crystalloid does not influence mortality.53 Baseline serum albumin concentration did not alter the lack of effect of albumin management on outcome.54 However, subgroup analyses suggested that crystalloid treatment could be superior in patients after trauma and that colloid could be superior in patients with severe sepsis.53 Subsequent 2-year follow-up of a subset of 460 patients with traumatic brain injury (Glasgow Coma Scale score ≤13) demonstrated a nearly twofold increased risk of death in patients receiving colloid fluid management.55
Related posts:


Stay updated, free articles. Join our Telegram channel

Full access? Get Clinical Tree


