Basic Principles of Clinical Pharmacology
Dhanesh K. Gupta
Thomas K. Henthorn
Key Points
Related Matter
Dose Response Relationships
Drug Concentration and Effect
In 1943, Halford labeled thiopental as “an ideal method of euthanasia” for war surgical patients and pronounced that “open-drop ether still retains primacy!”1 Based on this recount of the experience with thiopental at Pearl Harbor, it is impressive that cooler heads prevailed—Adams and Gray detailed a case of a civilian gunshot wound where they carefully titrated incremental doses of thiopental without any adverse respiratory or cardiovascular events.2 To highlight the importance of the quiet case report versus the animated condemnation of intravenous anesthesia for patients with hemorrhagic shock, an anonymous editorial appeared in the same issue of Anesthesiology that attempted to give some scientific justification for the discrepancy in opinions.3 As the editorial detailed, thiopental had a small therapeutic index and that the tolerance to normal doses was decreased in extreme physical conditions (e.g., blood loss, sepsis). Therefore, just like with open-drop ether, small doses of thiopental should be titrated to achieve the desired effects and avoid side effects associated with overdose. Fortunately, the anesthesia community did not simply abandon the use of thiopental, and in 1960, Price utilized mathematical models in order to describe the effects of hypovolemia on thiopental distribution.4
Anesthetic drugs are administered with the goal of rapidly establishing and maintaining a therapeutic effect while minimizing undesired side effects. Although open-drop ether and chloroform were administered using knowledge of a dose-effect relationship, the more potent volatile agents, along with the intravenous hypnotics, neuromuscular junction blocking agents, and intravenous opioids, all require a sound knowledge of pharmacokinetics and pharmacodynamics in order to accurately achieve the desired pharmacologic effect for the desired period of time without any drug toxicity.
This chapter attempts to guide the reader through the fundamental knowledge of what the body does to a drug (i.e., pharmacokinetics) and what a drug does to the body (i.e., pharmacodynamics). The initial section of this chapter discusses the biologic and pharmacologic factors that influence the absorption, distribution, and elimination of a drug from the body. Where necessary, quantitative analyses of these processes are discussed to give readers insight into the intricacies of pharmacokinetics that cannot be easily described by text alone. The second section concentrates on the factors that determine the relationship between drug concentration and pharmacologic effect. Once again, mathematical models are presented as needed in order to clarify pharmacodynamic concepts. The third section applies the knowledge from the first two sections in order to describe the clinically important drug–drug interactions that are encountered in the perioperative period. The final section builds on the reader’s knowledge gained from the first two sections to apply the principles of pharmacokinetics and pharmacodynamics to determine the target concentration of intravenous anesthetics required and the dosing strategies necessary to produce an adequate anesthetic state. Understanding these concepts should allow the reader to integrate the anesthetic drugs of the future into a rational anesthetic regimen. Although specific drugs are utilized to illustrate pharmacokinetic and pharmacodynamic principles throughout this chapter, detailed pharmacologic information of anesthetic pharmacopeia are presented in subsequent chapters of this book.
Pharmacokinetic Principles
Drug Absorption and Routes of Administration
Transfer of Drugs across Membranes
Hydrophilic drugs can only enter the CNS after binding to drug specific transmembrane proteins that actively transport the hydrophilic drug across the capillary endothelium into the CNS interstitium. When these transmembrane carrier proteins require energy to transport the drug across the membrane, they are able
to shuttle proteins against their concentration gradients, a process called active transport. In contrast, when these carrier proteins do not require energy to shuttle drugs, they cannot overcome concentration gradients, a process called facilitated diffusion. Therefore, active transport is not limited to the CNS, but is also found in the organs related to drug elimination (e.g., hepatocytes, renal tubular cells, pulmonary capillary endothelium), where the ability to transport drugs against the concentration gradient has specific biologic advantages. Both active transport and facilitated diffusion of drugs are saturable processes that are only limited by the number of carrier proteins available to shuttle a specific drug.5
to shuttle proteins against their concentration gradients, a process called active transport. In contrast, when these carrier proteins do not require energy to shuttle drugs, they cannot overcome concentration gradients, a process called facilitated diffusion. Therefore, active transport is not limited to the CNS, but is also found in the organs related to drug elimination (e.g., hepatocytes, renal tubular cells, pulmonary capillary endothelium), where the ability to transport drugs against the concentration gradient has specific biologic advantages. Both active transport and facilitated diffusion of drugs are saturable processes that are only limited by the number of carrier proteins available to shuttle a specific drug.5
For lipophilic compounds transporters are not needed for the drug to diffuse across the capillary wall into tissues, but the presence of transporters does affect the concentration gradients that exist. For instance, some lipophilic drugs are transported out of tissues by ATP-dependent transporters such as p-glycoprotein (P-gp). The lipophilic potent μ-opioid agonist, loperamide, used for the treatment of diarrhea, has limited bioavailability because of P-gp transporters at the intestine-portal capillary interface and then what does reach the circulation has its CNS penetrance limited by P-gp at the blood–brain barrier.6 Conversely, lipophilic compounds can be transported into tissues, increasing the tissue concentration of the drug beyond what would be accomplished by passive diffusion. The class of transporters called organic anion polypeptide transporters (OATPs), like P-gp, is located in the microvascular endothelium of the brain and transport endogenous opioids into the brain.7,8 These OATPs also transport drugs. The degree to which transporter proteins may account for intra- and interindividual responses to anesthetic drugs has not been well studied to date.9
Intravenous Administration
For a drug to be delivered to its site of action, the drug must be absorbed into the systemic circulation. Therefore, intravenous administration results in rapid increases in drug concentration. Although this can lead to a very rapid onset of drug effect, for drugs that have a low therapeutic index (the ratio of the intravenous dose that produces a toxic effect in 50% of the population to the intravenous dose that produces a therapeutic effect in 50% of the population), rapid overshoot of the desired plasma concentration can potentially result in immediate and severe side effects. Except for intravenous (IV) administration, the absorption of a drug into the systemic circulation is an important determinant of the time course of drug action and the maximum drug effect produced. As the absorption of drug is slowed, the maximum plasma concentration and drug effect achieved is limited. However, as long as the plasma concentration is maintained at a level above the minimum effective plasma concentration, the drug will produce an effect.10 Therefore, non-intravenous methods of administration can produce a sustained and significant effect that may be more advantageous than administering drugs by the intravenous route.11
Bioavailability is the relative amount of a drug dose that reaches the systemic circulation unchanged and the rate at which this occurs. For most intravenously administered drugs, the absolute bioavailability of the drug available is close to unity and the rate is nearly instantaneous. However, the pulmonary endothelium can slow the rate at which intravenously administered drugs reach the systemic circulation if distribution into the alveolar endothelium is extensive such as that occurs with the pulmonary uptake of fentanyl. The pulmonary endothelium also contains enzymes that may metabolize intravenously administered drugs (e.g., propofol) on first pass and reduce their absolute bioavailability.12
Oral Administration
For almost all therapeutic agents used across all fields of medicine, oral administration is perhaps the safest and most convenient method of administration. However, this route is not utilized significantly in anesthetic practice because of the limited and variable rate of bioavailability. The absorption rate in the gastrointestinal tract is highly variable because the main determinant of the timing of absorption is gastric emptying into the small intestines, where the surface area for absorption is several orders of magnitude greater than that of the stomach or large intestines. Additionally, the active metabolism of drug by the small intestine mucosal epithelium, and the obligatory path through the portal circulation before entering the systemic circulation, contribute to decreased bioavailability of orally administered drugs.13 In fact, the metabolic capacity of the liver for drugs is so high that only a small fraction of most lipophilic drugs actually reach the systemic circulation. Because of this extensive first-pass metabolism, the oral dose of most drugs must be significantly higher to generate a therapeutic plasma concentration. Coupled with the prolonged and variable time until peak concentrations are usually achieved from oral administration (between tens of minutes to hours), it is nearly impractical to utilize this mode to administer perioperative anesthetic agents.
Highly lipophilic drugs that can maintain a high contact time with nasal or oral (sublingual) mucosa can be absorbed without needing to traverse the gastrointestinal tract. Sublingual administration of drug has the additional advantage over gastrointestinal absorption in that absorbed drug directly enters the systemic venous circulation and therefore is able to bypass the metabolically active intestinal mucosa and the hepatic first pass metabolism. Therefore, small amounts of drug can rapidly produce a significant plasma concentration and therapeutic effect.14 However, because of formulation limitations and the small amount of surface area available for absorption, sublingual administration is limited to drugs that fortuitously meet these requirements and require a rapid onset of drug action (e.g., nitroglycerine, fentanyl).
Transcutaneous Administration
A few lipophilic drugs have been manufactured in formulations that are sufficient to allow penetration of intact skin. Although scopolamine, nitroglycerin, opioids, and clonidine all produce therapeutic systemic plasma concentrations when administered as “drug patches,” the extended amount of time that it takes to achieve an effective therapeutic concentration limits practical application except for maintenance therapy. Attempts to speed the passive diffusion of these drugs utilizing an electric current has been described for fentanyl,15 but it is still limited in its practicality.
Intramuscular and Subcutaneous Administration
Absorption of drugs from the depots in the subcutaneous tissue or in muscle tissue is directly dependent on the drug formulation and the blood flow to the depot. Because of the high blood flow to muscles in most physiologic states, intramuscular absorption of drugs in solution is relatively rapid and complete. Therefore, some aqueous drugs can be administered as intramuscular injection with rapid and predictable effects (e.g., neuromuscular junction blocking agents). The subcutaneous route of drug absorption is more variable in its onset because of the variability of subcutaneous blood flow during varying physiologic states—this is the primary reason that subcutaneous heparin and regular insulin administered perioperatively have a variable time of onset and maximum effect.
Intrathecal, Epidural, and Perineural Injection
Because the spinal cord is the primary site of action of many anesthetic agents, direct injection of local anesthetics and opioids directly into the intrathecal space bypasses the limitations of drug absorption and distribution compared to any other route of administration. However, this is not the case for epidural and perineural administration of local anesthetics, because not delivering the drug directly into the cerebrospinal fluid necessitates that the drug be absorbed through the dura or nerve sheath in order to reach the site of drug action. The major downside to all of these techniques is the relative expertise required to perform regional anesthetics relative to oral, intravenous, and inhalational administration of drug.
Inhalational Administration
The large surface area of the pulmonary alveoli available for exchange with the large volumetric flow of blood found in the pulmonary capillaries makes inhalational administration an extremely attractive method by which to administer drugs.16 New technologies have been developed that can rapidly and predictably aerosolize a wide range of drugs and thus approximate intravenous administration.17 These devices are currently in Phase II FDA trials.
Drug Distribution
Once drug has entered the systemic circulation, it is transported through bulk flow of blood to all of the organs throughout the body. The relative distribution of cardiac output among organ vascular beds determines the speed at which organs are exposed to the drug. The highly perfused core circulatory components—the brain, lungs, heart, and kidneys receive the highest relative distribution of cardiac output, and therefore, are the initial organs to reach equilibrium with plasma drug concentrations.4 Drug concentrations then equilibrate with the less well-perfused muscles and liver and then, finally, with the relatively poorly perfused splanchnic vasculature, adipose tissue, and bone.
Whether by passive diffusion or transporter-mediation, drug transport at the capillaries is not usually saturable; hence the amount of drug uptake by tissues and organs is limited by the blood flow they receive (i.e., flow-limited drug uptake).
Although the rate of initial drug delivery may be dependent on the relative blood flow of the organ, the rate of drug equilibration by the tissue is dependent on the ratio of blood flow to tissue content. Therefore, drug uptake rapidly approaches equilibrium in the highly perfused, but low volume brain, kidneys, and lungs in a matter of minutes, whereas drug transfer to the less well perfused, intermediate volume muscle tissue, may take hours to approach equilibrium, and drug transfer to the poorly perfused, large cellular volumes of adipose tissue, does not equilibrate for days.11
Redistribution
Drug Elimination
Besides being excreted unchanged from the body, a drug can be biotransformed (metabolized) into one or more new compounds that are then eliminated from the body. Either mechanism of elimination will decrease the drug concentration in the body such that the concentration will eventually be negligible and therefore unable to produce drug effect. Elimination is the pharmacokinetic term that describes all the processes that remove a drug from the body. Although the liver and the kidneys are considered the major organs of drug elimination, drug metabolism can occur at many other locations that contain active drug metabolizing enzymes (e.g., pulmonary vasculature, red blood cells) and the drug can be excreted unchanged from other organs (e.g., lungs).
Elimination clearance (drug clearance) is the theoretical volume of blood from which drug is completely and irreversibly removed in a unit of time.21 Elimination clearance has the units of flow—[volume per time]. Total drug clearance can be calculated with pharmacokinetic models of blood concentration versus time data.
Biotransformation Reactions
Most drugs that are excreted unchanged from the body are hydrophilic and therefore readily passed into urine or stool. Drugs that are not sufficiently hydrophilic to be able to be excreted unchanged, require modification into more hydrophilic, excretable compounds. Enzymatic reactions that metabolize drugs can be classified into Phase I and Phase II biotransformation reactions. Phase I reactions tend to transform a drug into one or more polar, and hence potentially excretable, compounds. Phase II reactions transform the original drug by conjugating a variety of endogenous compounds to a polar functional group of the drug, making the metabolite even more hydrophilic. Often drugs will undergo a Phase I reaction to produce a new compound with a polar functional group that will then undergo a Phase II reaction. However, it is possible for a drug to undergo either a Phase I or a Phase II reaction alone.
Phase I Reactions
Phase I reactions may hydrolyze, oxidize, or reduce the parent compound. Hydrolysis is the insertion of a molecule of water into another molecule, which forms an unstable intermediate compound that subsequently splits apart. Thus, hydrolysis cleaves the original substance into two separate molecules. Hydrolytic
reactions are the primary way amides, such as lidocaine and other amide local anesthetics, and esters, such as succinylcholine, are metabolized.
reactions are the primary way amides, such as lidocaine and other amide local anesthetics, and esters, such as succinylcholine, are metabolized.
Many drugs are biotransformed by oxidative reactions. Oxidations are defined as reactions that remove electrons from a molecule. The common element of most, if not all, oxidations is an enzymatically mediated reaction that inserts a hydroxyl group (OH) into the drug molecule. In some instances, this action produces a chemically stable, more polar hydroxylated metabolite. However, hydroxylation usually creates unstable compounds that spontaneously split into separate molecules. Many different biotransformations are effected by this basic mechanism. Dealkylation (removal of a carbon-containing group), deamination (removal of nitrogen-containing groups), oxidation of nitrogen-containing groups, desulfuration, dehalogenation, and dehydrogenation all follow an initial hydroxylation. Hydrolysis and hydroxylation are comparable processes. Both have an initial, enzymatically mediated step that produces an unstable compound that rapidly dissociates into separate molecules.
Some drugs are metabolized by reductive reactions, that is, reactions that add electrons to a molecule. In contrast to oxidations, where electrons are transferred from NADPH to an oxygen atom, the electrons are transferred to the drug molecule. Oxidation of xenobiotics requires oxygen, but reductive biotransformation is inhibited by oxygen, so it is facilitated when the intracellular oxygen tension is low.
Cytochrome P450 Enzymes
Table 7-1. Substrates for Cytochrome P450 (CYP) Isoenzymes Encountered in Anesthesiology | |||||||||||||||||||||||||||||||||||||||||||||||||||||||||||||||||||||||||||||||||||||||||||||||||||||||||
|---|---|---|---|---|---|---|---|---|---|---|---|---|---|---|---|---|---|---|---|---|---|---|---|---|---|---|---|---|---|---|---|---|---|---|---|---|---|---|---|---|---|---|---|---|---|---|---|---|---|---|---|---|---|---|---|---|---|---|---|---|---|---|---|---|---|---|---|---|---|---|---|---|---|---|---|---|---|---|---|---|---|---|---|---|---|---|---|---|---|---|---|---|---|---|---|---|---|---|---|---|---|---|---|---|---|
|
Several constitutive CYPs are involved in the production of various endogenous compounds, such as cholesterol, steroid hormones, prostaglandins, and eicosanoids. In addition to the constitutive forms, production of various CYPs can be induced by a wide variety of xenobiotics. CYP drug-metabolizing activity increases after exposure to various exogenous chemicals, including many drugs. The number and type of CYPs present at any time depends on exposure to different xenobiotics. The CYP system is able to protect the organism from the deleterious effects of accumulation of exogenous compounds because of its two fundamental characteristics—broad substrate specificity and the capability to adapt to exposure to different substances by induction of different CYP isoenzymes. Table 7-1 groups drugs encountered in anesthetic practice according to the CYP isoenzymes responsible for their biotransformation.
Biotransformations can be inhibited if different substrates compete for the drug-binding site on the same CYP member. The effect of two competing substrates on each other’s metabolism depends on their relative affinities for the enzyme. Biotransformation of the compound with the lower affinity is inhibited to a greater degree. This is the mechanism by which the H2 receptor antagonist cimetidine inhibits the metabolism of many drugs, including meperidine, propranolol, and diazepam. The newer H2 antagonist ranitidine has a different structure and causes fewer clinically significant drug interactions. Other drugs, notably calcium channel blockers and antidepressants, also inhibit oxidative drug metabolism in humans. This information allows clinicians to predict which combinations of drugs are more likely to lead to clinically significant interactions because of altered drug metabolism by the cytochrome P450 system.
Phase II Reactions
Phase II reactions are also known as conjugation or synthetic reactions. Many drugs do not have a polar chemical group suitable for conjugation, so it occurs only after a Phase I reaction. Other drugs, such as morphine, already have a polar group that serves as a “handle” for conjugation, and they undergo these reactions directly. Various endogenous compounds can be attached to parent drugs or their Phase I metabolites to form different conjugation products. These endogenous substrates include glucuronic acid, acetate, and amino acids. Mercapturic acid conjugates result from the binding of exogenous compounds to glutathione. Other conjugation reactions produce sulfated or methylated derivatives of drugs or their metabolites. Like the cytochrome P450 system, the enzymes that catalyze Phase II reactions are inducible. Phase II reactions produce conjugates that are polar, water-soluble compounds. This facilitates the ultimate excretion of the drug via the kidneys or hepatobiliary secretion. Like CYP, there are different families and superfamilies of the enzymes that catalyze Phase II biotransformations.
Genetic Variations in Drug Metabolism
For most enzymes involved in Phase I and Phase II reactions, there are several biologically available isoforms. Drug metabolism varies substantially among individuals because of variability in the genes controlling the numerous enzymes responsible for biotransformation. For most drugs, individual subjects’ rates of metabolism have a unimodal distribution. However, distinct subpopulations with different rates of elimination of some drugs have been identified. The resulting multimodal distribution of individual rates of metabolism is known as polymorphism. For example, different genotypes result in either normal, low, or (rarely) absent plasma pseudocholinesterase activity, accounting for the well-known differences in individuals’ responses to succinylcholine, which is hydrolyzed by this enzyme. Many drug-metabolizing enzymes exhibit genetic polymorphism, including CYP and various transferases that catalyze phase II reactions. However, none of these have a sex-related difference.
Chronologic Variations in Drug Metabolism
The activity and capacity of the CYP enzymes increase from subnormal levels in the fetal and neonatal period, to reach normal levels at about 1 year of age. Although age is a covariate in mathematical models of drug elimination, it is not clear if these changes are related to chronologic changes in organ function (age-related organ dysfunction) or a decrease in CYP levels with increasing age. In contrast, it is clear that the neonate has a limited ability to perform phase II conjugation reactions, but after normalizing phase II activity over the initial year of life, advanced age does not affect the capacity to perform phase II reactions.
Renal Drug Clearance
Table 7-2. Drugs with Significant Renal Excretion Encountered in Anesthesiology | ||||||||||||||
|---|---|---|---|---|---|---|---|---|---|---|---|---|---|---|
|
In reality, renal drug clearance of actively secreted drugs can be inhibited by both passive tubular reabsorption of lipophilic drugs and active, carrier-mediated tubular reabsorption of hydrophilic drugs. Therefore, the small amount of filtered and secreted lipophilic drug is easily reabsorbed in the distal tubules, making the net renal clearance negligible. In contrast, the large amount of filtered and secreted hydrophilic drug can be passively reabsorbed if renal tubular flow decreases substantially (e.g., oliguria) and/or the urine pH favors the unionized form of the hydrophilic drug. Because overall renal function is readily estimated by clearance of endogenous creatinine, renal drug clearance, even for drugs eliminated primarily by tubular secretion, is dependent on renal function. Therefore, in patients with acute and chronic causes of decreased renal function, including advanced age, low cardiac output states, and hepatorenal syndrome, drug dosing must be altered in order to avoid accumulation of parent compounds and potentially toxic metabolites (e.g., lidocaine, meperidine) (Table 7-2).
Hepatic Drug Clearance
where Ca is the mixed hepatic arterial–portal venous drug concentration and Cv is the mixed hepatic venous drug concentration. The total hepatic drug clearance, ClH, is:
where Q is the hepatic blood flow. Therefore, hepatic clearance is a function of hepatic blood flow and the ability of the liver to extract drug from the blood.
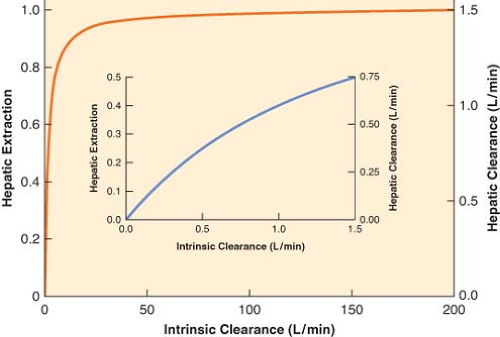 Figure 7.1. The relationship between hepatic extraction ratio (E, left y-axis), intrinsic clearance (Cll, x-axis), and hepatic clearance (ClH, right y-axis) at the normal hepatic blood flow (Q) of 1.5 L/min. For drugs with a high intrinsic clearance (Cll >> Q), increasing intrinsic clearance has little effect on hepatic extraction and total hepatic clearance and total hepatic clearance approaches hepatic blood flow. In contrast, if the intrinsic clearance is small (Cll ≤ Q), the extraction ratio is similar to the intrinsic clearance (inset). (Adapted from: Wilkinson GR, Shand DG: A physiologic approach to hepatic drug clearance. Clin Pharmacol Ther. 1975;18:377.) |
The ability to extract drug depends on the activity of drug-metabolizing enzymes and the capacity for hepatobiliary excretion—the intrinsic clearance of the liver (Cll).
Intrinsic clearance represents the ability of the liver to remove drug from the blood in the absence of any limitations imposed by blood flow or drug binding. The relationship of total hepatic drug clearance to the extraction ratio and intrinsic clearance, Cll, is:
The right-hand side of Equation 7-3 indicates that if intrinsic clearance is very high (many times larger than hepatic blood flow, Cll >> Q), total hepatic clearance approaches hepatic blood flow. On the other hand, if intrinsic clearance is very small (Q + Cll ≈ Q), hepatic clearance will be similar to intrinsic clearance. These relationships are shown in Figure 7-1.
Thus, hepatic drug clearance and extraction are determined by two independent variables, intrinsic clearance and hepatic blood flow. Changes in either will change hepatic clearance. However, the extent of the change depends on the initial relationship between intrinsic clearance and hepatic blood flow, according to the nonlinear relationship:
If the initial intrinsic clearance is small relative to hepatic blood flow, then the extraction ratio is also small, and Equation 7-4 reduces to the following relationship:
Equation 7-4a indicates that doubling intrinsic clearance will produce an almost proportional increment as in the extraction ratio, and, consequently, hepatic elimination clearance (Fig. 7-1, inset). However, if intrinsic clearance is much greater than hepatic blood flow, Equation 7-4 reduces to the following relationship:
Equation 7-4b demonstrates that the extraction ratio is independent of intrinsic clearance and therefore a change in intrinsic clearance has a negligible effect on the extraction ratio and hepatic drug clearance (Fig. 7-1). In nonmathematical terms, high intrinsic clearance indicates efficient hepatic elimination. It is hard to enhance an already efficient process, whereas it is relatively easy to improve on inefficient drug clearance because of low intrinsic clearance.
For drugs with a high extraction ratio and a high intrinsic clearance, hepatic elimination clearance is directly proportional to hepatic blood flow. Therefore, any manipulation of hepatic blood flow will be directly reflected by a proportional change in hepatic elimination clearance (Fig. 7-2). In contrast, when the intrinsic
clearance is low, changes in hepatic blood flow produce inversely proportional changes in extraction ratio (Fig. 7-3), and therefore the hepatic elimination clearance is essentially independent of hepatic blood flow and exquisitely related to intrinsic clearance (Fig. 7-3). Therefore, classifying drugs as having either low, intermediate, or high extraction ratios (Table 7-3), allows predictions to be made on how intrinsic hepatic clearance and blood flow affect hepatic elimination clearance. This allows gross adjustments to be made in hepatically metabolized drug dosing to avoid excess accumulation of drugs (decreased hepatic elimination without dose adjustment) or subtherapeutic dosing strategies (increased hepatic elimination without dose adjustment).
clearance is low, changes in hepatic blood flow produce inversely proportional changes in extraction ratio (Fig. 7-3), and therefore the hepatic elimination clearance is essentially independent of hepatic blood flow and exquisitely related to intrinsic clearance (Fig. 7-3). Therefore, classifying drugs as having either low, intermediate, or high extraction ratios (Table 7-3), allows predictions to be made on how intrinsic hepatic clearance and blood flow affect hepatic elimination clearance. This allows gross adjustments to be made in hepatically metabolized drug dosing to avoid excess accumulation of drugs (decreased hepatic elimination without dose adjustment) or subtherapeutic dosing strategies (increased hepatic elimination without dose adjustment).
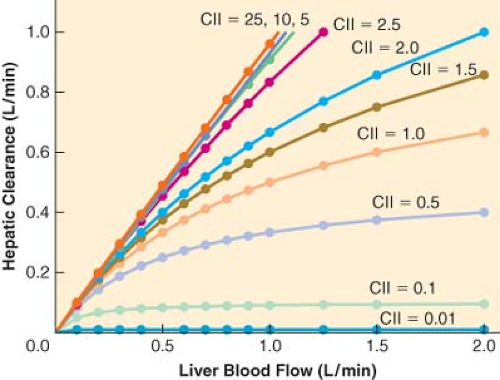 Figure 7.2. The relationship between liver blood flow (Q, x-axis) and hepatic clearance (ClH, y-axis) for different values of intrinsic clearance (Cll). When the intrinsic clearance is low, hepatic elimination clearance is independent of liver blood flow—the drug elimination is limited by the capacity of the liver to metabolize the drug (i.e., the intrinsic clearance). In contrast, as intrinsic clearance increases, the hepatic elimination becomes more dependent on hepatic blood flow—the liver is able to metabolize all of the drug that it is exposed to and therefore only limited by the amount of drug that is delivered to the liver (i.e., flow limited metabolism). |
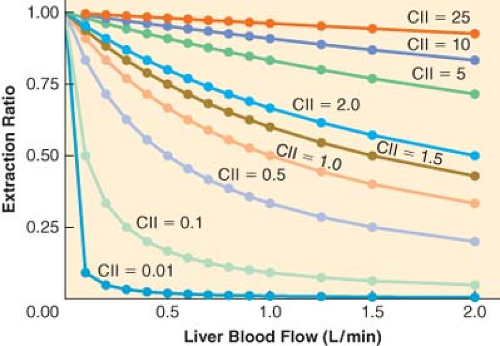 Figure 7.3. The relationship between liver blood flow (Q, x-axis) and hepatic extraction ratio (E, y-axis) for different values of intrinsic clearance (Cll). When the intrinsic clearance is low, increases in hepatic blood flows cause a decrease in the extraction ratio because the liver has limited metabolic capabilities. In contrast, when the intrinsic clearance is high, the extraction ratio is essentially independent of hepatic blood flow because the liver’s ability to eliminate drug is well above the amount of drug provided by normal hepatic blood flow. |
Table 7-3. Classification of Drugs Encountered in Anesthesiology According to Hepatic Extraction Ratios | |||||||||||||||||||||||||||||||||||||||||||||
|---|---|---|---|---|---|---|---|---|---|---|---|---|---|---|---|---|---|---|---|---|---|---|---|---|---|---|---|---|---|---|---|---|---|---|---|---|---|---|---|---|---|---|---|---|---|
|
Pharmacologic and pathologic manipulations of cardiac output with its consequences on hepatic/splanchnic blood flow and renal blood flow are important covariates when designing drug dosing strategies.24 As detailed above, in states where cardiac output is decreased (e.g., heart failure, shock, spinal anesthesia), high extraction ratio drugs will have a decrease in hepatic elimination, whereas low extraction rate drugs will have minimal change in clearance.25,26 In contrast, autoregulation of renal blood flow maintains a relatively constant renal elimination clearance until low urine output states eventually allow increased reabsorption of drugs from the distal tubules.27
Pharmacokinetic Models
The concentration of drug at its site or sites of action is the fundamental determinant of a drug’s pharmacologic effects. Although the blood is rarely the site of action, the tissue drug concentration of an individual organ is a function of the blood flow to the organ, the concentration of drug in the arterial inflow of the organ, the capacity of the organ to take up drug, and the ability of the drug to diffuse between the blood and the organ.
Physiologic versus Compartment Models
Initial pharmacokinetic models of intravenous and inhalational anesthetics used physiologic or perfusion models.4 In these models, body tissues were lumped into groups that had similar distribution of cardiac output and capacity for drug uptake. Highly perfused tissues with a large amount of blood flow per volume of tissue were classified as the vessel rich group, whereas tissues with a balanced amount of blood flow per volume of tissue were classified as the lean tissue group or fast tissue group. The vessel-poor group (slow tissue group) was comprised of tissues that had a large capacity for drug uptake but a limited tissue perfusion. Although identification of the exact organs that made up each tissue group was not possible from the mathematical model, it was apparent that the highly perfused tissues were comprised of the brain, lungs, kidneys, and a subset of muscle, the fast equilibrating tissue would be consistent with the majority of muscle and some of the splanchnic bed (e.g., liver), and the slowly equilibrating tissues contained the majority of the adipose tissue and the remainder of the splanchnic organs.
Based on the computationally and experimentally intense physiologic models, Price was able to demonstrate that awakening after a single dose of thiopental was primarily a result of redistribution of thiopental from the brain to the muscle with little contribution by distribution to less well-perfused tissues or drug metabolism.4,18 This fundamental concept of redistribution applies to all lipophilic drugs and was not delineated until an accurate pharmacokinetic model had been constructed.
Perfusion-based physiologic pharmacokinetic models have provided significant insights into how physiologic, pharmacologic, and pathologic distribution of cardiac output can effect drug distribution and elimination.28,29 However, verification of the predictions of these models requires measurement of drug concentrations in many different tissues, which is experimentally inefficient and destructive to the system. Therefore, simpler mathematical models have been developed. In these models, the body is comprised of one or more compartments. Drug concentrations in the blood are used to define the relationship between dose and the time course of changes in the drug concentration. The compartments of the compartmental pharmacokinetic models cannot be equated with the tissue groups that make up physiologic pharmacokinetic models because the compartments
are theoretical entities that are used to mathematically characterize the blood concentration profile of a drug. These models allow the derivation of pharmacokinetic parameters that can be used to quantify drug distribution and elimination—volume of distribution, clearance, and half-lives.
are theoretical entities that are used to mathematically characterize the blood concentration profile of a drug. These models allow the derivation of pharmacokinetic parameters that can be used to quantify drug distribution and elimination—volume of distribution, clearance, and half-lives.
Although the simplicity of compartmental models, compared to physiologic pharmacokinetic models, has its advantages, it also has some disadvantages. For example, cardiac output is not a parameter of compartmental models, and therefore cannot be used to predict directly the effect of cardiac failure on drug disposition.30 However, compartmental pharmacokinetic models can still quantify the effects of reduced cardiac output on the disposition of a drug if a group of patients with cardiac failure is compared to a group of otherwise healthy subjects.
The discipline of pharmacokinetics is, to the despair of many, mathematically based. In the succeeding sections, formulas are used to illustrate the concepts needed to understand and interpret pharmacokinetic studies. Readers are encouraged to concentrate on the concepts, not the formulas.
Pharmacokinetic Concepts
Rate Constants and Half-lives
The disposition of most drugs follows first-order kinetics. A first-order kinetic process is one in which a constant fraction of the drug is removed during a finite period of time regardless of the drug amount or concentration. This fraction is equivalent to the rate constant of the process. Rate constants are usually denoted by the letter k and have units of “inverse time,” such as min−1 or h−1. If 10% of the drug is eliminated per minute, then the rate constant is 0.1 min−1. Since a constant fraction is removed per unit of time in first-order kinetics, the absolute amount of drug removed is proportional to the concentration of the drug. It follows that, in first-order kinetics, the rate of change of the amount of drug at any given time is proportional to the concentration present at that time. When the concentration is high, more drug will be removed than when it is low. First-order kinetics apply not only to elimination, but also to absorption and distribution.
Rather than using rate constants, the rapidity of pharmacokinetic processes is often described with half-lives—the time required for the concentration to change by a factor of 2. Half-lives are calculated directly from the corresponding rate constants with this simple equation:
Thus, a rate constant of 0.1 min−1 translates into a half-life of 6.93 minutes. The half-life of any first-order kinetic process, including drug absorption, distribution, and elimination, can be calculated. First-order processes asymptotically approach completion, because a constant fraction of the drug, not an absolute amount, is removed per unit of time. However, after five half-lives, the process will be almost 97% complete (Table 7-4). For practical purposes, this is essentially 100% and therefore there is a negligible amount of drug remaining in the body.
Volume of Distribution
Table 7-4. Half-lives and Corresponding Percentage of Drug Removed | |||||||||||||||||||||
|---|---|---|---|---|---|---|---|---|---|---|---|---|---|---|---|---|---|---|---|---|---|
|
The volume of distribution is an “apparent” volume because it represents the size of these hypothetical boxes, that are necessary to explain the concentration of drug in a reference compartment, usually called the central or plasma compartment. The volume of distribution, Vd, relates the total amount of drug present to the concentration observed in the central compartment:
If a drug is extensively distributed, then the concentration will be lower relative to the amount of drug present, which equates to a larger volume of distribution. For example, if a total of 10 mg of drug is present and the concentration is 2 mg/L, then the apparent volume of distribution is 5 L. On the other hand, if the concentration was 4 mg/L, then the volume of distribution would be 2.5 L.
Simply stated, the apparent volume of distribution is a numeric index of the extent of drug distribution that does not have any relationship to the actual volume of any tissue or group of tissues. It may be as small as plasma volume, or, if overall tissue uptake is extensive, the apparent volume of distribution may greatly exceed the actual total volume of the body. In general, lipophilic drugs have larger volumes of distribution than hydrophilic drugs. Since the volume of distribution is a mathematical construct to model the distribution of a drug in the body, it cannot provide any information regarding the actual tissue concentration in any specific real organ in the body. However, this simple mathematical construct provides a useful summary description of the behavior of the drug in the body. In fact, the loading dose of drug required to achieve a target plasma concentration can be easily calculated by rearranging Equation 7-7 as follows:
On the basis of this equation, it is clear that an increase in the volume of distribution means that a larger loading dose will be required to “fill up the box” and achieve the same concentration. Therefore, any change in state because of changes in physiologic and pathologic conditions can alter the volume of distribution, necessitating therapeutic adjustments.
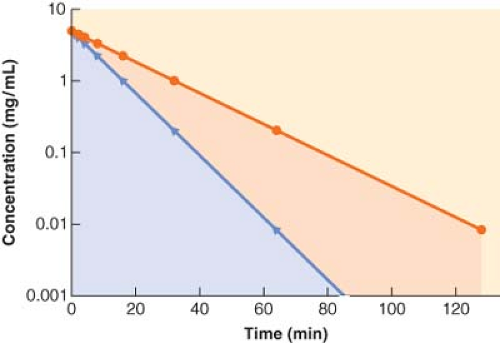 Figure 7.4. The plasma concentration (y-axis) versus time (x-axis) curve for two drugs that only differ in their elimination clearance. Notice that the areas under the curves are different, signifying that the drug that has the smaller area under the curve is more rapidly eliminated from the body than the drug that has the slower elimination clearance. |
Total Drug (Elimination) Clearance
Elimination clearance, Cl, can be calculated from the declining blood levels observed after an IV injection, as follows:
If a drug is rapidly removed from the plasma, its concentration will fall more quickly than the concentration of a drug that is less readily eliminated. This results in a smaller area under the concentration versus time curve, which equates to greater clearance (Fig. 7-4).
Without additional organ-specific data (e.g., urine drug concentration measurements, drug arterial inflow concentration), calculating elimination clearance from compartmental pharmacokinetic models usually does not specify the relative contribution of different organs to drug elimination. Nonetheless, estimation of drug clearance with these models has made important contributions to clinical pharmacology. In particular, these models have provided a great deal of clinically useful information regarding altered drug elimination in various pathologic conditions.
Elimination Half-life
Although the elimination clearance is the pharmacokinetic parameter that best describes the physiologic process of drug elimination (i.e., drug delivery to organs of elimination coupled with the capacity of the organ to eliminate the drug), the variable most often reported in textbooks and literature is the elimination half-life of a drug (t1/2β). The elimination half-life is the time during which the amount of drug in the body decreases by 50%. Although this parameter appears to be a simple summary of the physiology of drug elimination, it is actually a complex parameter, influenced by the distribution and the elimination of the drug as follows:
Therefore, when a physiologic or pathologic perturbation changes the elimination half-life of a drug, it is not a simple reflection of the change in the body’s ability to metabolize or eliminate the drug. For example, the elimination half-life of thiopental is prolonged in the elderly, however, the elimination clearance is unchanged and the volume of distribution is increased.31 Therefore, elderly patients need dosing strategies that accommodate for the change in the distribution rather than a decreased metabolism of the drug. In contrast, in patients with renal insufficiency, the increase in the elimination half-life of pancuronium is due to a simple decrease in renal elimination of the drug while the volume of distribution is unchanged.32
Besides its inability to give insight into the mechanism by which a drug is retained in the body, the elimination half-life is unable to give insight into the time that it takes for a single or a series of repeated drug doses to terminate its effect. Although elimination of drug from the body begins the moment the drug is delivered to the organs of elimination, the rapid termination of effect of a bolus of an intravenous agent is due to redistribution of drug from the brain to the blood and subsequently other tissue (e.g., muscle). Therefore, the effects of most anesthetics have waned long before even one elimination half-life has been completed, making this measure of drug kinetics incapable of providing useful information regarding the duration of action following the administration of intravenous agents. Thus the elimination half-life has limited utility in anesthetic practice.10
Effect of Hepatic or Renal Disease on Pharmacokinetic Parameters
Diverse pathophysiologic changes preclude precise prediction of the pharmacokinetics of a given drug in individual patients with hepatic or renal disease. In addition, liver function tests (e.g., transaminases) are unreliable predictors of the degree of liver function and the remaining metabolic capacity for drug elimination. However, some generalizations can be made. In patients with hepatic disease, the elimination half-life of drugs metabolized or excreted by the liver is often increased because of decreased clearance, and possibly, increased volume of distribution caused by ascites and altered protein binding.10,33 Drug concentration at steady state is inversely proportional to elimination clearance. Therefore, when hepatic drug clearance is reduced, repeated bolus dosing or continuous infusion of drugs such as benzodiazepines, opioids, and barbiturates may result in excessive accumulation of drug as well as excessive and prolonged pharmacologic effects. Since recovery from small doses of drugs such as thiopental and fentanyl is largely the result of redistribution, recovery from conservative doses will be minimally affected by reductions in elimination clearance. In patients with renal failure, similar concerns apply to the administration of drugs excreted by the kidneys. It is almost always better to underestimate a patient’s dose requirement, observe the response, and give additional drug if necessary.
Nonlinear Pharmacokinetics
The physiologic and compartmental models thus far discussed are based on the assumption that drug distribution and elimination
are first-order processes. Therefore, their parameters, such as clearance and elimination half-life, are independent of the dose or concentration of the drug. However, the rate of elimination of a few drugs is dose-dependent, or nonlinear.
are first-order processes. Therefore, their parameters, such as clearance and elimination half-life, are independent of the dose or concentration of the drug. However, the rate of elimination of a few drugs is dose-dependent, or nonlinear.
Elimination of drugs involves interactions with either enzymes catalyzing biotransformation reactions or carrier proteins for transmembrane transport. If sufficient drug is present, the capacity of the drug-eliminating systems can be exceeded. When this occurs, it is no longer possible to excrete a constant fraction of the drug present to the eliminating system, and a constant amount of drug is excreted per unit time. Phenytoin is a well-known example of a drug that exhibits nonlinear elimination at therapeutic concentrations,34 whereas in anesthetic practice, the extremely high doses of thiopental utilized for cerebral protection can demonstrate zero-order elimination.35 In theory, all drugs are cleared in a nonlinear fashion. In practice, the capacity to eliminate most drugs is so great that this is usually not evident, even with toxic concentrations.
Compartmental Pharmacokinetic Models
One-compartment Model
Although for most drugs the one-compartment model is an oversimplification, it does serve to illustrate the basic relationship among clearance, volume of distribution, and the elimination half-life. In this model, the body is envisaged as a single homogeneous compartment. Drug distribution after injection is assumed to be instantaneous, so there are no concentration gradients within the compartment. The concentration can decrease only by elimination of drug from the system. The plasma concentration versus time curve for a hypothetical drug with one-compartment kinetics is shown in Figure 7-5. The decrease in plasma concentration (C) with time from the initial concentration (C0) can be characterized by the simple monoexponential function:
With the concentration plotted on a logarithmic scale, the concentration versus time curve becomes a straight line. The slope of the logarithm of concentration versus time is equal to the first-order elimination rate constant (ke).
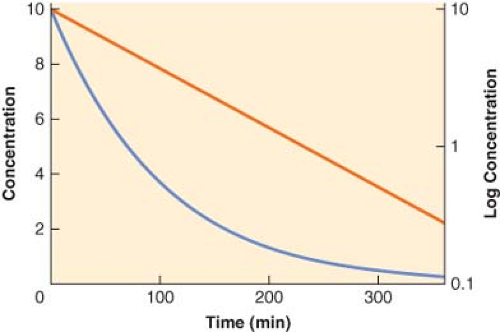 Figure 7.5. The plasma concentration versus time profile plotted on both linear (blue line, left y-axis) and logarithmic (red line, right y-axis) scales for a hypothetical drug exhibiting one-compartment, first-order pharmacokinetics. Note that the slope of the logarithmic concentration profile is equal to the elimination rate constant (ke) and related to the elimination half-life (t1/2β) as described in Equation 7-9. |
In the one-compartment model, drug clearance, Cl, is equal to the product of the elimination rate constant, ke, and the volume of distribution:
Two-compartment Model
For many drugs, a graph of the logarithm of the plasma concentration versus time after an IV injection is similar to the schematic graph shown in Figure 7-6. There are two discrete phases in the decline of the plasma concentration. The first phase after injection is characterized by a very rapid decrease in concentration. The rapid decrease in concentration during this “distribution phase” is largely caused by passage of drug from the plasma into tissues. The distribution phase is followed by a slower decline of the concentration owing to drug elimination. Elimination also begins immediately after injection, but its contribution to the drop in plasma concentration is initially much smaller than the fall in concentration because of drug distribution.
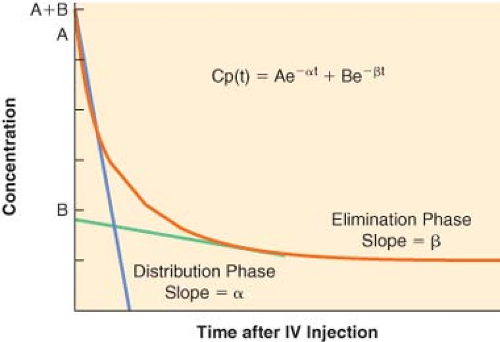 Figure 7.6. The logarithmic plasma concentration versus time profile for a hypothetical drug exhibiting two-compartment, first-order pharmacokinetics. Note that the distribution phase has a slope that is significantly larger than that of the elimination phase, indicating that the process of distribution is not only more rapid than elimination of the drug from the body, but also responsible for the majority of the decline in plasma concentration in the several minutes after drug administration. |
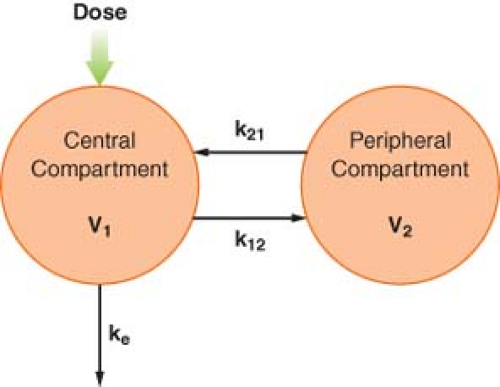 Figure 7.7. A schematic of a two-compartment pharmacokinetic model. See text for explanation. |
To account for this biphasic behavior, one must consider the body to be made up of two compartments, a central compartment, which includes the plasma, and a peripheral compartment (Fig. 7-7). This two-compartment model assumes that it is the central compartment into which the drug is injected and from which the blood samples for measurement of concentration are obtained, and that drug is eliminated only from the central compartment. Drug distribution within the central compartment is considered to be instantaneous. In reality, this last assumption cannot be true. However, drug uptake into some of the highly perfused tissues is so rapid that it cannot be detected as a discrete phase on the plasma concentration versus time curve.
The distribution and elimination phases can be characterized by graphic analysis of the plasma concentration versus time curve, as shown in Figure 7-6. The elimination phase line is extrapolated back to time zero (the time of injection). In Figure 7-6, the zero time intercepts of the distribution and elimination lines are points A and B, respectively. The hybrid rate constants, α and β, are equal to the slopes of the two lines, and are used to calculate the distribution and elimination half-lives; α and β are called hybrid rate constants because they depend on both distribution and elimination processes.
At any time after an IV injection, the plasma concentration of drugs with two-compartment kinetics is equal to the sum of two exponential terms:
where t = time, Cp(t) = plasma concentration at time t, A = y-axis intercept of the distribution phase line, α = hybrid rate constant of the distribution phase, B = y-axis intercept of the elimination phase line, and β = hybrid rate constant of the elimination phase. The first term characterizes the distribution phase and the second term characterizes the elimination phase. Immediately after injection, the first term represents a much larger fraction of the total plasma concentration than the second term. After several distribution half-lives, the value of the first term approaches zero, and the plasma concentration is essentially equal to the value of the second term (see Fig. 7-6).
In multicompartmental models, the drug is initially distributed only within the central compartment. Therefore, the initial apparent volume of distribution is the volume of the central compartment. Immediately after injection, the amount of drug present is the dose, and the concentration is the extrapolated concentration at time t = 0, which is equal to the sum of the intercepts of the distribution and elimination lines. The volume of the central compartment, V1, is calculated by modifying Equation 7-7:
The volume of the central compartment is important in clinical anesthesiology because it is the pharmacokinetic parameter that determines the peak plasma concentration after an IV bolus injection. Hypovolemia, for example, reduces the volume of the central compartment. If doses are not correspondingly reduced, the higher plasma concentrations will increase the incidence of adverse pharmacologic effects.
Immediately after IV injection, the entire drug is in the central compartment. Simultaneously, three processes begin. Drug moves from the central to the peripheral compartment, which also has a volume, V2. This intercompartmental transfer is a first-order process, and its magnitude is quantified by the rate constant k12. As soon as the drug appears in the peripheral compartment, some passes back to the central compartment, a process characterized by the rate constant k21. The transfer of drug between the central and peripheral compartments is quantified by the distributional or intercompartmental clearance:
The third process that begins immediately after administration of the drug is the irreversible removal of drug from the system via the central compartment. As in the one-compartment model, the elimination rate constant is ke, and elimination clearance is:
The rapidity of the decrease in the central compartment concentration after IV injection depends on the magnitude of the compartmental volumes, the intercompartmental clearance, and the elimination clearance.
At equilibrium, the drug is distributed between the central and the peripheral compartments, and by definition, the drug concentrations in the compartments are equal. Therefore, the ultimate volume of distribution, termed the volume of distribution at steady state (Vss), is the sum of V1 and V2. Extensive tissue uptake of a drug is reflected by a large volume of the peripheral compartment, which, in turn, results in a large Vss. Consequently, Vss can greatly exceed the actual volume of the body.
As in the single-compartment model, the elimination clearance in multicompartment models is equal to the dose divided by the area under the concentration versus time curve. This area, as well as the compartmental volumes and intercompartmental clearances, can be calculated from the intercepts and hybrid rate constants, without having to reach steady-state conditions.
Three-compartment Model
After IV injection of some drugs, the initial, rapid distribution phase is followed by a second, slower distribution phase before the elimination phase becomes evident. Therefore, the plasma concentration is the sum of three exponential terms:
where t = time, Cp(t) = plasma concentration at time t, A = intercept of the rapid distribution phase line, α = hybrid rate constant of the rapid distribution phase, B = intercept of the slower
distribution phase line, β = hybrid rate constant of the slower distribution phase, G = intercept of the elimination phase line, and γ = hybrid rate constant of the elimination phase. This triphasic behavior is explained by a three-compartment pharmacokinetic model (Fig. 7-8). As in the two-compartment model, the drug is injected into and eliminated from the central compartment. Drug is reversibly transferred between the central compartment and two peripheral compartments, which accounts for two distribution phases. Drug transfer between the central compartment and the more rapidly equilibrating, or “shallow,” peripheral compartment is characterized by the first-order rate constants k12 and k21. Transfer in and out of the more slowly equilibrating, “deep” compartment is characterized by the rate constants k13 and k31. In this model, there are three compartmental volumes: V1, V2, and V3, whose sum equals Vss; and there are three clearances: The rapid intercompartmental clearance, the slow intercompartmental clearance, and elimination clearance.
distribution phase line, β = hybrid rate constant of the slower distribution phase, G = intercept of the elimination phase line, and γ = hybrid rate constant of the elimination phase. This triphasic behavior is explained by a three-compartment pharmacokinetic model (Fig. 7-8). As in the two-compartment model, the drug is injected into and eliminated from the central compartment. Drug is reversibly transferred between the central compartment and two peripheral compartments, which accounts for two distribution phases. Drug transfer between the central compartment and the more rapidly equilibrating, or “shallow,” peripheral compartment is characterized by the first-order rate constants k12 and k21. Transfer in and out of the more slowly equilibrating, “deep” compartment is characterized by the rate constants k13 and k31. In this model, there are three compartmental volumes: V1, V2, and V3, whose sum equals Vss; and there are three clearances: The rapid intercompartmental clearance, the slow intercompartmental clearance, and elimination clearance.
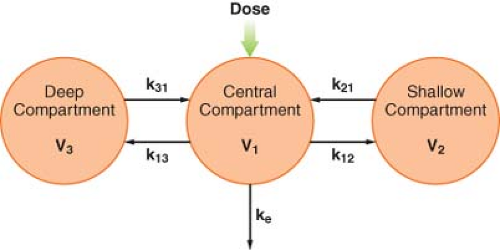 Figure 7.8. A schematic of a three-compartment pharmacokinetic model. See text for details. |
The pharmacokinetic parameters of interest to clinicians, such as clearance, volumes of distribution, and distribution and elimination half-lives, are determined by calculations analogous to those used in the two-compartment model. Accurate estimates of these parameters depend on accurate characterization of the measured plasma concentration versus time data. A frequently encountered problem is that the duration of sampling is not long enough to define accurately the elimination phase. Similar problems arise if the assay cannot detect low concentrations of the drug. Conversely, samples are sometimes obtained too infrequently following drug administration to be able to characterize the distribution phases accurately.36,37 Whether a drug exhibits two- or three-compartment kinetics is of no clinical consequence.10 In fact, some drugs have two-compartment kinetics in some patients and three-compartment kinetics in others. In selecting a pharmacokinetic model, the most important factor is that it accurately characterizes the measured concentrations.
In general, the model with the smallest number of compartments or exponents that accurately reflects the data is used. However, it is good to consider that the data collected in a particular study may not be reflective of the clinical pharmacologic issues of concern in another situation, making published pharmacokinetic model parameters potentially irrelevant. For instance, new data indicates that hypotension following intravenous administration of drug X is related to peak arterial plasma drug X concentrations 1 minute after injection, but previous pharmacokinetic models are based on venous plasma drug X concentrations beginning 5 minutes after the dose. In this case, the pharmacokinetic models will not be of use in designing dosing regimens for drug X that avoid toxic drug concentrations at 1 minute.10,38,39
Related posts:


Stay updated, free articles. Join our Telegram channel

Full access? Get Clinical Tree


