INTRODUCTION
PART 1: ST-T ABNORMALITIES
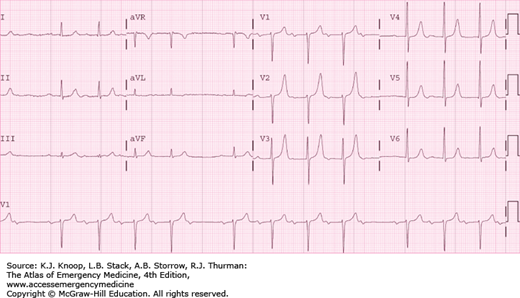
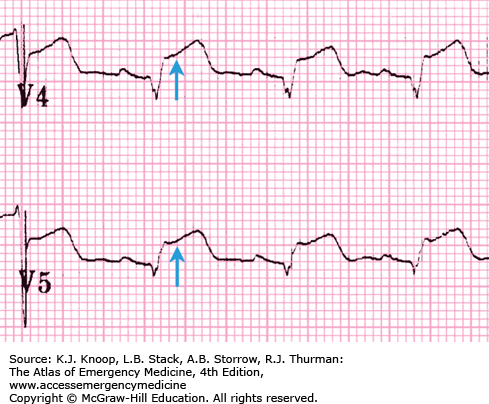
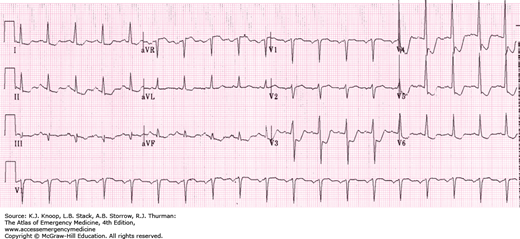
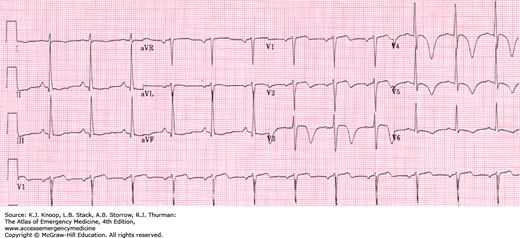
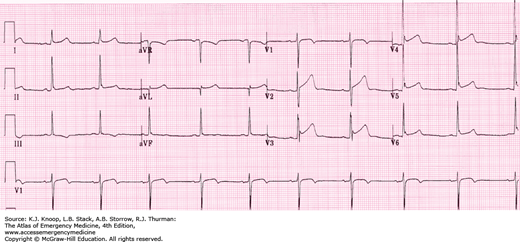
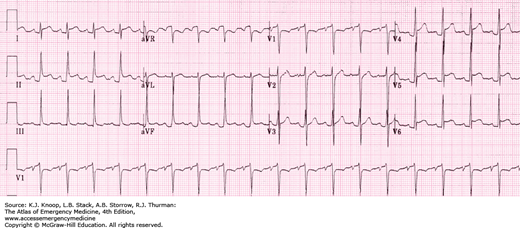
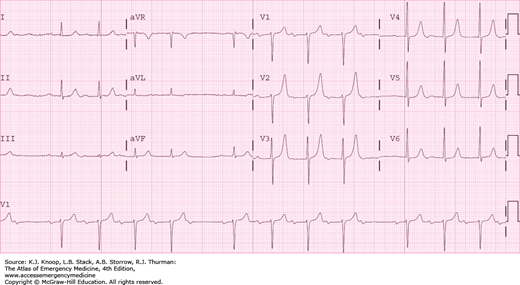
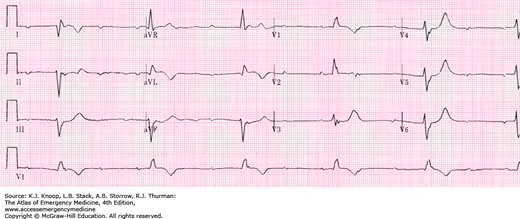
ST segment elevation in the anterior precordial leads.
V1-V4: Anteroseptal injury.
V3-V4: Anterior injury.
V3-V6: Anterolateral injury. Leads I and aVL may also be involved, especially if the circumflex artery is affected (high lateral injury).
Reciprocal ST segment depressions are often present in the inferior leads (II, III, aVF).
The left anterior descending artery supplies blood to the anterior and lateral left ventricle and ventricular septum.
Normal R-wave progression (increasing upward amplitude with R wave > S wave at V3 or V4) may be interrupted.
The development of pathologic Q waves in any of the V leads other than V1 strongly suggests that the injury has progressed to an infarction, as seen in this example.
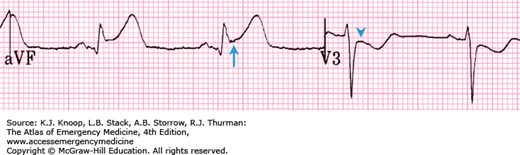
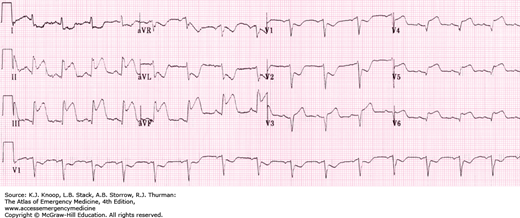
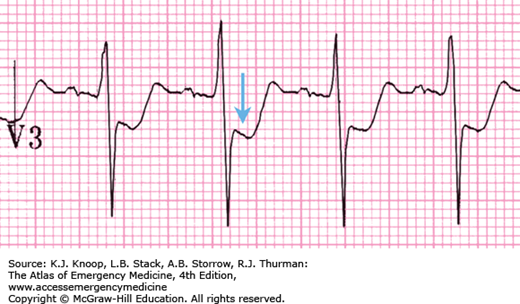
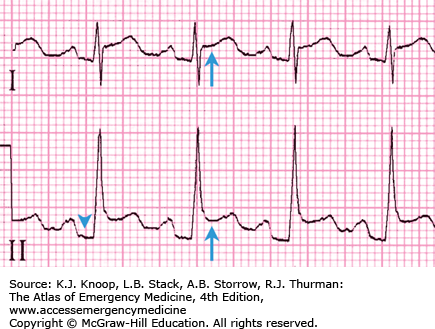
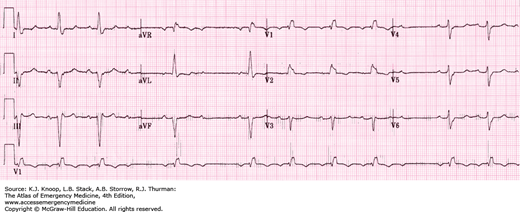
ST segment elevation in inferior leads (II, III, aVF)
ST segment depressions in the anterior leads (V1-V3) and possibly high lateral leads (I, aVL)
The right coronary artery supplies blood to the right ventricle, the sinoatrial (SA) node, the inferior portions of the left ventricle, and usually to the posterior portion of the left ventricle and the atrioventricular (AV) node.
Infarctions involving the SA node may produce sinus dysrhythmias including tachycardias, bradycardias, and sinus arrest.
Infarctions involving the AV node may produce AV blocks.
In the presence of acute inferior injury, a right-sided ECG should be obtained to look for right ventricular involvement. The administration of nitroglycerin in the presence of acute right ventricular infarction can precipitate profound hypotension, as these patients are preload-dependent.
Since the right coronary artery so often supplies the posterior left ventricle, look for evidence of a posterior infarction (as present in the example) and consider obtaining an ECG with posterior leads.
ST elevation in right-sided V leads (V4R, V5R).
ST elevation greater in lead III than lead II suggests RV MI.
ST elevation in the normally obtained V1 also strongly suggests RV MI.
Often associated with inferior MI and/or posterior MI.
The smaller muscle mass of the right ventricle produces a less intense injury pattern that is overwhelmed by the left ventricle in the normally obtained ECG. Placement of right-sided V leads, with V1-V6 in mirror-image locations on the right side of the chest, is important in detecting right ventricular injury.
The heart with an injured right ventricle is very preload-dependent. Beware of lowering preload with nitrates in any patient with suspected RV MI as severe hypotension may occur. Treat hypotension with volume.
Obtain a right-sided ECG in any patient with inferior or posterior MI, and in any patient with a significant hypotensive response to nitrates.
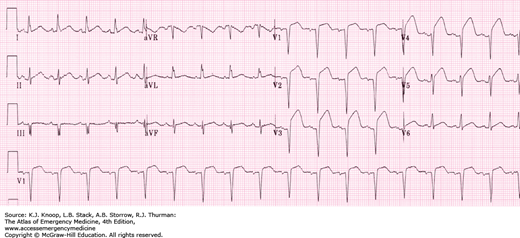
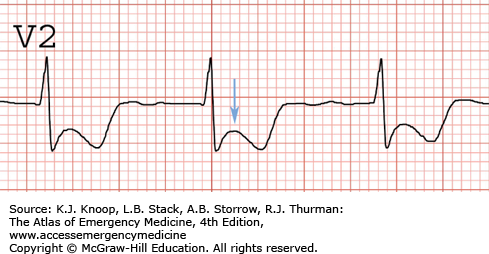
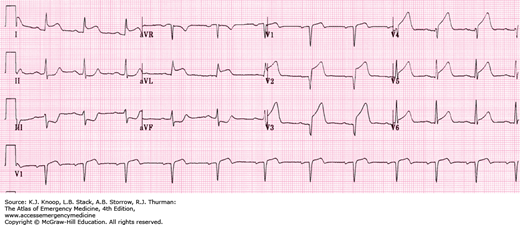
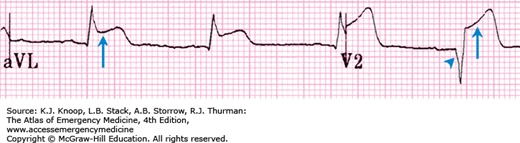
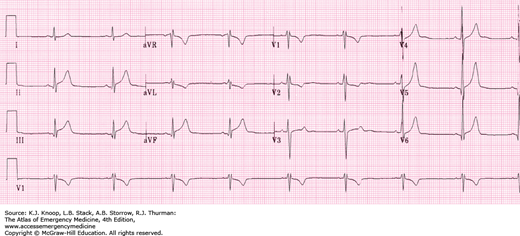
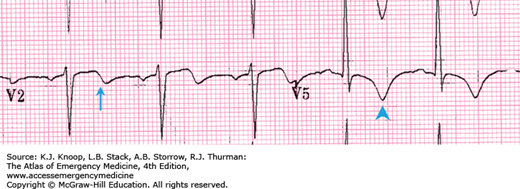
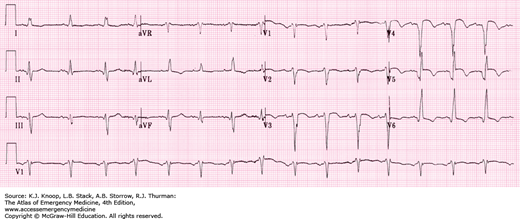
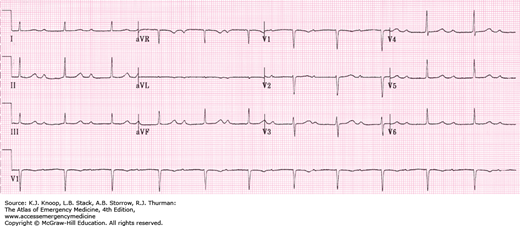
With acute injury pattern—ST segment depression in lead V1 and/or V2 with acute injury pattern
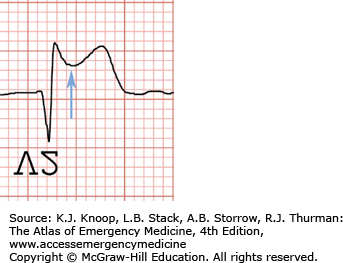
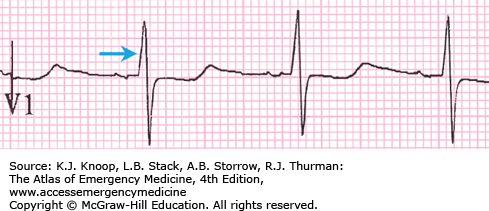
With infarction pattern—Small S wave and large R wave greater than 4 ms duration in lead V1 or V2 with infarction
With infarction pattern—R-wave/S-wave ratio greater than 1 in lead V1 or V2 with infarction
The posterior portion of the left ventricle has no EKG electrodes directly overlying it and is the last portion of ventricle to depolarize. It receives its blood supply from either the right coronary artery (in 85% of individuals) or the circumflex artery (in 15% of individuals).
V1 and V2 are primarily affected as the most anterior leads and indirectly assess the posterior left ventricle, though in an “inverted” orientation. Instead of observing downgoing Q waves and ST elevation, one expects to see large upgoing R waves and ST depression. By holding the EKG up to a backlight upside down and horizontally flipped, the more classic injury pattern can be observed by looking through the EKG paper (see Fig. 23.4C).
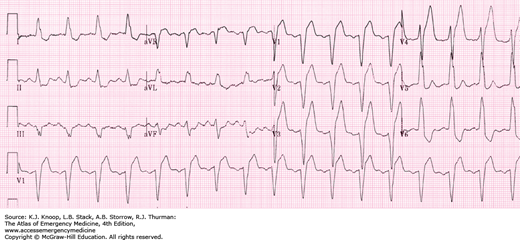
Posterior involvement may be confirmed with posterior leads. V8 is located at inferior tip of left scapula; V9 is positioned between V8 and the spine at the same level.
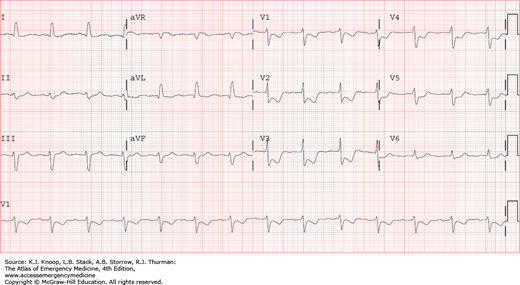
Frequently, an inferior MI is also present with a posterior MI, since the right coronary artery serves both areas. In the above example, there is subtle ST elevation in the lateral leads, indicating posterior-lateral injury.
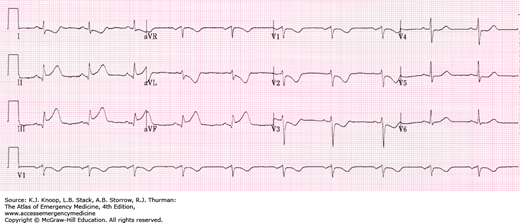
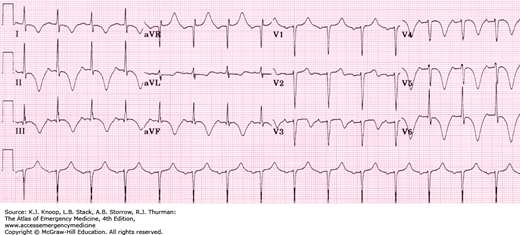
ST segment elevation in the precordial leads (V2-V6) and high lateral leads (I, aVL).
Reciprocal ST segment depressions in the inferior leads (II, III, aVF).
ST segment elevation in AVR coupled with reciprocal ST depressions may indicate AMI from left main disease.
The left main coronary artery branches into the left anterior descending artery and the circumflex artery. It supplies blood to the ventricular septum and the anterior and lateral aspects of the left ventricle, usually sparing the posterior and inferior portion, which is most often served by the right coronary artery.
Normal R-wave progression (increasing R-wave amplitude across the precordial leads) may be interrupted.
Risk of cardiogenic shock is high since so much of the left ventricle is served by the left main coronary artery.
A left main coronary thrombosis is also known as the “widowmaker lesion.”
Isolated ST segment elevation in lead aVR may also indicate acute myocardial ischemia from left main coronary artery disease.
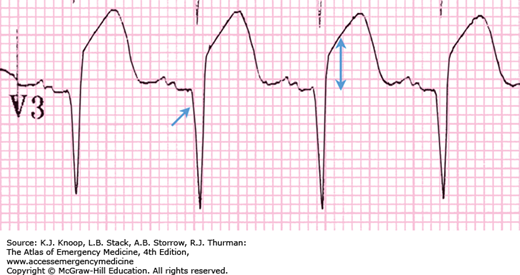
ST elevation greater than or equal to 1 mm concordant with QRS deflection (score = 5)
ST depression greater than or equal to 1 mm in leads V1, V2, V3 concordant with QRS deflection (score = 3)
ST elevation greater than or equal to 5 mm discordant with QRS deflection (score = 2)
These scored criteria may be used to diagnose acute myocardial infarction in the setting of a left bundle branch block (LBBB). However, most myocardial ischemia in the setting of LBBB does not produce these changes. An absence of these findings should not be used as evidence against acute coronary syndrome.
Score of greater than or equal to 3 gives a specificity for myocardial infarction of 90%.
The first and third criteria listed above may also be used in ECGs with wide QRS complexes resulting from a pacemaker or idioventricular rhythm.
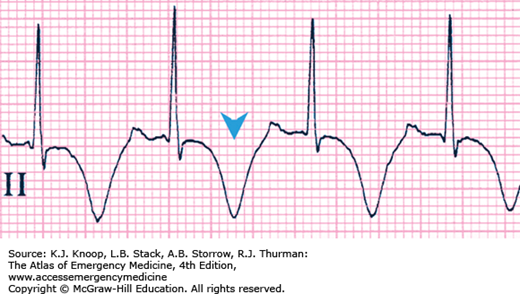
ST segment depression greater than or equal to 1 mm in anatomically adjoining leads.
ST segments may be horizontal or downsloping with acute ischemia.
Some ST depression in the lateral precordial leads (V4-V6) is common at higher heart rates, and is commonly seen during exercise treadmill tests, but such depression should not be downsloping unless ischemia is also present.
ST elevation in other leads suggests that the depression may represent reciprocal changes from acute injury rather than subendocardial ischemia.
Downsloping ST depression may also be seen in left ventricular hypertrophy (LVH), but this depression should not be dynamic, and should be stable with serial ECGs. ST depression from ischemia will be dynamic, changing with time on serial ECGs.
Isolated ST depression in leads V1 and V2 may represent posterior ischemia.
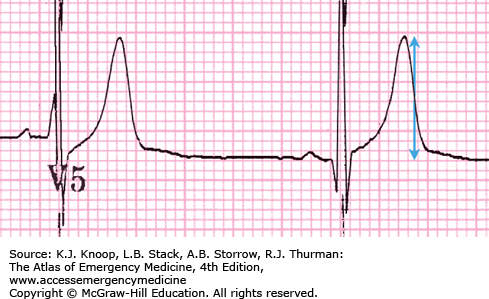
T-wave amplitude/QRS amplitude greater than 75%.
T waves greater than 5 mV in the limb leads.
T waves greater than 10 mV in the precordial leads.
T waves have asymmetric appearance.
Hyperacute T waves occur very early (within minutes) during myocardial injury and are transient.
The term “hyperacute T waves” is reserved for the early stages of myocardial infarction. “Prominent T waves” can also be seen with LVH, early repolarization, or with hyperkalemia.
Serial ECGs are useful in distinguishing transient hyperacute T waves from other causes of tall, peaked T waves.
Biphasic T waves in anterior and/or lateral leads
Deeply inverted, symmetrical T waves in the same leads
These characteristic patterns of T-wave changes are closely associated with critical left anterior descending artery stenosis.
The changes are classically apparent on ECG after resolution of chest pain.
These changes are transient, and often are not associated with cardiac enzyme elevations.
Wellens waves are not associated with changes in R-wave progression.
Serial electrocardiograms may assist in differentiating Wellens waves from stable, nonspecific findings.
Inverted, wide T waves are most notable in precordial leads (can be seen in any lead).
QT interval prolongation.
These are associated with acute cerebral disease, most notably an ischemic cerebrovascular event or subarachnoid hemorrhage.
They may be accompanied by ST segment changes, U waves, and/or any rhythm abnormality.
Differential diagnosis includes extensive myocardial ischemia.
Strongly suspect an intracranial etiology in a patient with altered mental status and these electrocardiographic findings.
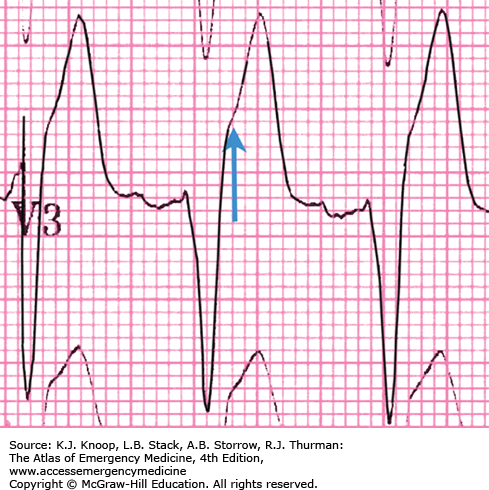
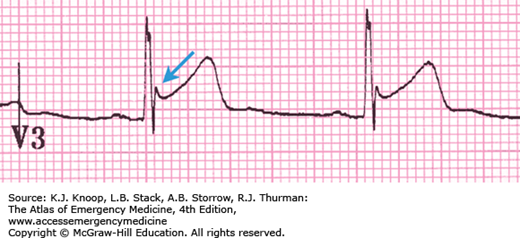
ST elevation, usually in the anterior leads.
J-point elevation, but usually less than one-third the total height of the T wave.
ST segment is “concave upward,” or “holds water,” or “is smiling at you.”
J-point notch strongly suggests early repolarization, but is not always present.
This is a normal variant and is especially common in young healthy males, but also may be present in other groups. However, any clinical suspicion for ongoing myocardial ischemia should prompt further investigation
Q waves and reciprocal ST-segment depression in other leads should not accompany early repolarization. If present, they strongly suggest ischemia as the cause for the ST elevation.
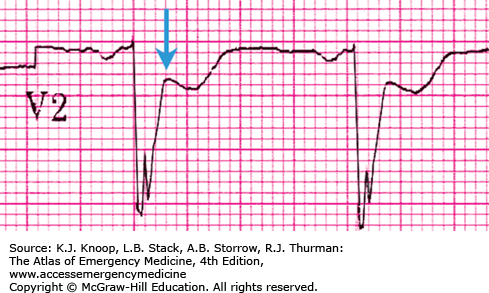
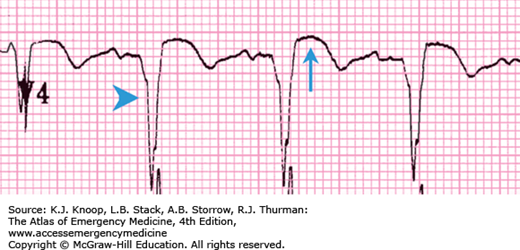
ST elevation in anterior contiguous leads
Deep pathologic Q waves in anterior leads
ST segment elevation which occurs in the setting of a myocardial infarction should resolve within days under normal circumstances.
Persistent ST-segment elevation occurring for weeks or longer after a myocardial infarction is suspicious for ventricular aneurysm.
Ventricular aneurysms may follow a large myocardial infarction in the anterior portion of the heart.
The aneurysm consists of scarred myocardium, which does not contract but bulges outward during systole; complications include congestive heart failure, myocardial rupture, arrhythmias, and thrombus formation.
Suspect an LV aneurysm when these findings appear in the ECG of a patient who does not demonstrate symptoms suggesting ACS. However, one should also be vigilant for the presence of “silent” ACS.
Diffuse ST elevation in noncontiguous leads
PR depression
T-wave flattening or inversion
PR elevation in lead aVR
Pericarditis may produce inflammation of the epicardium. This is most often demonstrated on the ECG as a widespread injury pattern.
Pericarditis does not produce abnormal Q waves. The presence of abnormal Q waves must prompt consideration of acute or old coronary syndrome, including Dressler syndrome or postinfarct pericarditis.
Pericarditis may be focal, resulting in regional rather than diffuse EKG changes.
Benign early repolarization and myocarditis may also appear as ST elevation in many noncontiguous leads.
PART 2: CONDUCTION DISTURBANCES
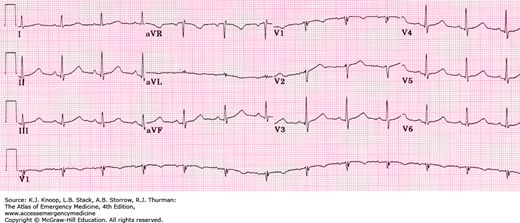
A PR interval greater than 200 ms (normal 120-200 ms) with no significant variation in PR intervals between beats.
Each P wave is followed by a QRS complex.
This type of heart block usually does not affect heart function and can be considered nonpathologic (especially in athletes or patients with higher vagal tone).
First-degree block may also be due to heart disease (myocarditis, rheumatic fever) or drugs (digoxin, amiodarone, β-blockers, calcium channel blockers).
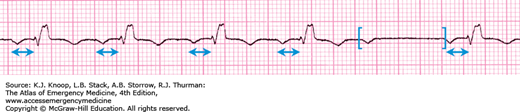
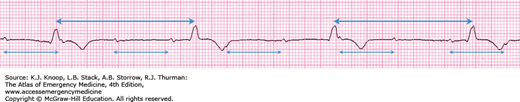
Progressive PR-interval prolongation throughout the cardiac cycle until a P wave occurs without a QRS complex (“dropped” beat).
After the dropped QRS complex, the cycle continues again with the PR interval of the first beat in the cycle always shorter than the PR interval of the last beat in the previous cycle.
P wave may be hidden by the preceding T wave.
The number of P-QRS complexes prior to the “dropped” beat may vary.
A clue to the diagnosis of Mobitz type I heart block can be found in the appearance of grouped QRS complexes.
This type of block is normally asymptomatic, and may be seen in athletes.
These patients have low risk of progression to complete heart block, and usually do not require a pacemaker. However, Mobitz type I heart block may be caused by inferior myocardial infarction or drugs (digoxin, amiodarone, β-blockers, calcium channel blockers).
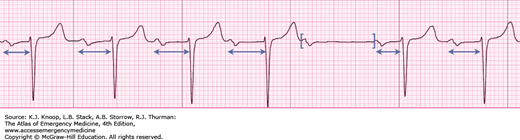
The PR interval remains constant and does not increase (as seen with Mobitz type I) with each cardiac cycle prior to the “dropped” QRS complex.
P-P interval is constant, and R-R interval is constant until the dropped beat.
R-R interval encompassing the “dropped” QRS should be roughly equal to two P-P intervals.
This type of heart block is associated with disease of the conduction system distal to the AV node. A pacemaker is usually indicated.
Mobitz type II block can accompany myocardial infarction and has a high chance of progression to a complete heart block.
Atrial and ventricular electrical activities are entirely disassociated.
The P-P and R-R intervals remain constant.
P waves may be hidden in the QRS complex or may distort the shape of the T wave.
The atrial rate is usually faster than the ventricular rate.
Third-degree block is also called complete heart block because no impulses are conducted from the atria to the ventricles.
AV rate and QRS morphology depend upon the location of the escape pacemaker.
A node escape rate is typically 40 to 60 bpm, with a narrow QRS complex.
Ventricular escape rate is usually 20 to 40 bpm, with a widened QRS complex.
Complete heart block may be caused by myocardial infarction, conduction system disease, or drugs such as digoxin.
Complete heart block may dramatically decrease cardiac output, cardiac pacing is often required.
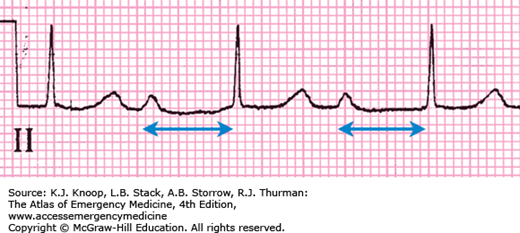
Normal QTc interval is less than 440 ms.
QTc interval greater than 440 ms is considered prolonged.
QTc interval greater than 550 ms is markedly prolonged.


