Chapter 7
Assessment and Monitoring of Hemodynamic Function
Mean arterial pressure (MAP; Box 7.1, Equation 1) is the most commonly used estimate of tissue perfusion pressure. However, this assumption is subject to several important limitations, measurement accuracy notwithstanding. First, the range of values considered adequate (i.e., MAP of 60 to 70 mm Hg) is based on normal physiologic conditions and may be inappropriate in patients who have a need for higher (i.e., baseline hypertension, concern for spinal cord ischemia) or lower (i.e., leaking aortic aneurysm) pressures. Second, MAP is a measurement taken at the arterial level (radial, brachial, femoral) that may or may not adequately represent the resistance at the tissue microvascular level. Overreliance on this value may result in impaired tissue perfusion despite mean arterial pressures that are seemingly “normal.” Third, the capability for critically ill patients to autoregulate and maintain tissue perfusion within a limited MAP range is often attenuated with severe illness.
BOX 7.1 Hemodynamic Equations
 V/
V/ P)
P)


∗See Mattar JA: A simple calculation to estimate body surface area in adults and its correlation with the Du Bois formula. Crit Care Med 17:846-847, 1989, for estimating BSA from height and weight and online calculators of BSA.
†One must convert from traditional units of oxygen content (mL/dL) to mL/L.
Basic Physiologic Components
Pressures, Volumes, Compliance, and Resistance
Hemodynamic variables are either directly measured or calculated. Volume can be estimated through sonographic modalities (e.g., inferior venal caval diameter, left atrial diameter), but it is usually inferred from other indices. Intravascular pressure and volume are related by compliance (Box 7.1, Equation 2). The compliance of any system is directly related to its intrinsic distensibility. Vessels or chambers that are highly distensible, such as the systemic venous bed, can accommodate large changes in volume with small changes in pressure. In contrast, the systemic arterial circuit is much less distensible (stiffer) and thus far less compliant than the systemic venous circuit. Specifically, systemic veins are approximately 25 times more compliant than systemic arteries. The systemic venous circuit of a typical adult contains about 2500 mL at an average central venous pressure of about 10 mm Hg, whereas the systemic arterial circuit contains only about 750 mL at a mean arterial pressure of about 100 mm Hg. Although compliance can be measured using imaging techniques, this is rarely done in the ICU setting. However, variations in compliance can have important implications for recruitable reserve volume.
Resistance, on the other hand, is a frequently discussed hemodynamic parameter in critically ill patients. Resistance reflects the propensity of vessels to resist blood flow, relating pressure to flow. It is calculated from pressures measured within the system in addition to flow through the system (cardiac output) (Box 7.1, Equations 3 and 4). Acute changes in vascular resistance are frequently multifactorial and can have profound effects on arterial blood pressure. Although capacitance and resistance are conceptually independent, and indeed the main resistance vessels (arterioles) are distinct from the capacitance vessels (venous plexus), in reality, the mechanisms that increase vascular resistance also usually decrease capacitance.
Measurements within the Circuit
The circulatory system can be divided into a pulmonary (right) and systemic (left) system comprising three elements arranged in series: a reservoir, pump, and resistor. For the right-sided circulation, the reservoir consists primarily of the veins (systemic veins, venules, and venous sinuses). The pump is the right ventricle, and the resistor is the pulmonary arterial system (predominantly pulmonary arterioles). Similarly, for the left-sided circulation, the reservoir consists of the pulmonary veins and left atrium, the pump is the left ventricle, and the resistor is the systemic arterial circulation (predominantly arterioles).
These variables can be measured or calculated through a variety of approaches. Using a pulmonary artery catheter and systemic arterial blood pressure monitor, one can measure pressures in both circuits as well as flow through the entire circulation. Cardiac output and other hemodynamic variables are commonly corrected for variations in body size by indexing the values to the body surface area (BSA) (Box 7.1, Equation 5). The pressure in the systemic venous reservoir is reflected by the central venous pressure (CVP) and right atrial pressure (RAP). The latter is the proximate source of right ventricular filling during diastole and, when measured at the appropriate time in the cardiac cycle, can estimate the right ventricular end-diastolic pressure (RVEDP)—that is, the right ventricular preload. The tip of the pulmonary artery catheter measures the pressure in the pulmonary artery or one of its branches. The resistance in the pulmonary arterial circuit can be calculated if the cardiac output, mean pulmonary arterial pressure, and left atrial pressure (estimated as the pulmonary artery occlusion or wedge pressure, PAOP or PAWP) are known (Box 7.1, Equation 3). This equation represents the general hydraulic relationship in which resistance to fluid flow through a system equals the pressure drop across the system divided by the mean flow.
The PAWP normally reflects the pressure in the pulmonary venous reservoir, which is the source of left ventricular filling during diastole—that is, left ventricular preload. Systemic arterial blood pressure, cardiac output, and CVP can similarly be used to calculate systemic vascular resistance (Box 7.1, Equation 4). The range of normal pressures is shown in Table 7.1, and the range of normal flows and resistances are given in Table 7.2.
TABLE 7.1
Normal Values of Hemodynamic Pressures (Under Unstressed Conditions)
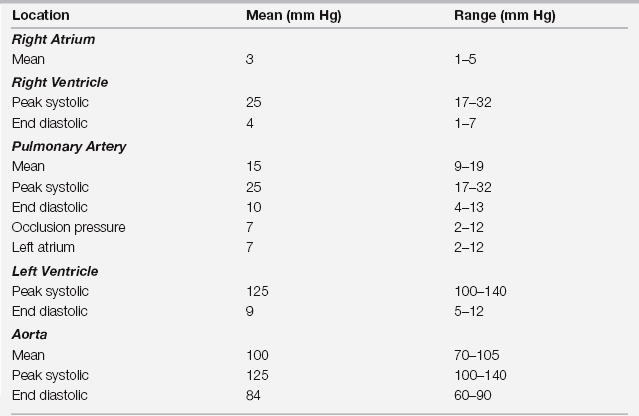
From Pepine CJ, Hill JA, Lambert CR (eds): Diagnostic and Therapeutic Cardiac Catheterization. Baltimore: Williams & Wilkins, 1998.


Stay updated, free articles. Join our Telegram channel

Full access? Get Clinical Tree


