Airway Secretions and Suctioning: Introduction
Retention of airway secretions in patients on invasive mechanical ventilation constitutes a common problem associated with several complications. Therefore, secretion management represents a great challenge for respiratory therapists, nurses, and physicians, particularly in the patient with underlying airways disorders. This chapter discusses management of airway secretions in mechanically ventilated patients, focusing on physiology of mucus production, clearance, and the most common treatments, both pharmacologic and nonpharmacologic, to enhance removal of retained secretions. Although adequate humidification of the inspired gas plays a primary role on mucus clearance, the reader is referred to Chapter 51 for a comprehensive discussion of this topic.
Physiology of Airway Secretion and Clearance
The lungs are exposed daily to 10,000 to 12,000 L of inhaled air, which potentially carries pathogens and noxious particles. Nevertheless, airways are efficiently protected by the airway lining fluid, which constitutes a physical barrier and a medium with antimicrobial and immunomodulatory properties. The airway lining fluid is a biphasic layer formed by a gel-phase (mucus), mainly consisting of water (97%), with proteins, lipids, electrolytes, and cellular debris making up the remaining 3% of its weight. By contrast, the inner layer is a low-viscosity sol-phase that mainly provides lubrication for continuous ciliary beating.
The main components of mucus are mucins. These are large (up to 3 × 10⁶ Daltons per monomer) heavily glycosylated proteins that provide a tangled network necessary to entrap any particles inhaled during ventilation. Two different types of mucins have been identified: (a) cell-tethered and (b) secreted mucins. Cell-tethered mucins present several functions in cellular adhesion, pathogen binding, and cellular transduction. We focus on secreted mucins, because detailed description of membrane-bound mucins goes beyond the scope of this chapter.
Four genes coding for airway-secreted mucins have been identified and map to chromosome 11p15.51 and 12q12.2 As depicted in Table 52-1, the genes can be found in different organs; MUC5AC and MUC5B are the ones most commonly expressed in human airways.3,4 Mucin genes comprise a single large central domain (approximately 10 kb) that encodes for serine-rich, threonine-rich, and proline-rich regions, which are the sites of O-linked glycosylation of mucins. Importantly, linked glycans present an extraordinary diversity5 among species and even within species; this feature provides the highly efficient binding capability between mucus and almost any particle and/or pathogen deposited on the airways. The 5′ and 3′ genomic regions encode for the von Willebrand factor-like proteic regions, rich in cysteine,6 which allow the disulfide bonds between mucin monomers to form the ultimate polymeric structure.
| Gene | Chromosomal Locus | Tissue Distribution | Airways Predominant Distribution |
|---|---|---|---|
| MUC2 | 11p15 | Lung, conjunctiva, middle ear, stomach, small intestine, colon, nasopharynx, prostate |
|
| MUC5AC | 11p15 | Lung, conjunctiva, middle ear, stomach, gallbladder, nasopharynx | Surface goblet cell |
| MUC5B | 11p15 | Lung, sublingual gland, laryngeal submucosal, esophageal glands, stomach, duodenum, gallbladder, nasopharynx |
|
| MUC19 | 12q12 | Lung, salivary gland, kidney, liver, colon, placenta, prostate | Submucosal glands |
The airways comprise ciliated and secretory cells, structured in a pseudostratified epithelium up to the main bronchi and as a simple cuboidal epithelium toward the peripheral airways. Mucus production in normal airways is low, approximately 10 to 100 mL/day; hence, airways are covered by a thin layer (approximately 5 μm) of mucus (Fig. 52-1B). In humans, MUC5AC is mainly produced by goblet cells7 in the proximal airways, whereas goblet cells throughout the airways and submucosal glands mostly produce MUC5B.8
Figure 52-1

Microanatomy of the airway epithelium. The porcine airway epithelium was fixed with perfluorocarbon/osmium and imaged with a scanning electron microscope (A and B) and transmission electron microscope (C and D). A. The pseudostratified tracheal epithelium and the characteristic high density of cilia on the luminal surface are shown. Rare strings of mucus are evident above the cilia (magnification ×3000). B. A thin layer of mucus (approximately 5 μm) is demonstrated above the cilia (magnification ×3000). C. Higher magnification of the airway epithelium comprising goblet cells (Gc) and ciliated cells (Cc). Cilia are evident in the luminal (L) surface. Of note, electron-dense mucus granules of varying size are within the goblet cell (magnification ×3000). D. Microanatomy of the airway lining fluid. The white arrows delimitate the periciliary fluid. The electron-dense mucus layer (Mu) can be identified over the periciliary layer (magnification ×12,000). (Electron micrographs courtesy Dr. Nuria Cortadells, University of Barcelona, and Laia Fernandez-Barat, Hospital Clinic, Barcelona, Spain.)
In healthy airways, epithelium goblet cells are outnumbered nearly fourfold by ciliated cells (Fig. 52-2A). Goblet cells contain cytoplasmic granules (see Fig. 52-1C), in which mucin polymers are firmly packed. When the polymers are secreted, the mucin polymers increase in size by 500 times their packed volume9,10 secondary to hydration.
Figure 52-2
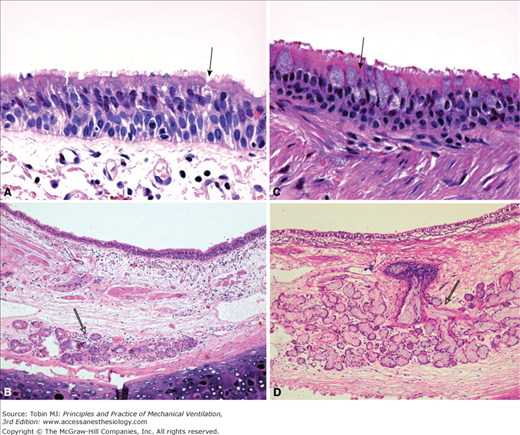
Representative sections of human epithelium from a healthy subject (A and B) and from a patient with chronic obstructive pulmonary disease (C and D). A. Magnification of the pseudostratified epithelium showing a goblet cell (black arrow) outnumbered by ciliated cells (magnification ×630). B. At lower magnification, a submucosal gland is identified with no signs of dilation (empty arrow) (magnification ×100). C. In patient with chronic obstructive pulmonary disease, goblet cell hyperplasia is evident. A representative goblet cell is indicated by the black arrow (magnification ×630). D. Hypertrophy of submucosal gland (empty arrow) is shown. Reid index approximately 0.7. Additionally, a disproportionate increase in retained mucus within the gland and collecting duct is evident with resulting dilation of the structure. Hematoxylin and eosin stain. (Pictures courtesy Prof. Jose Ramirez, Hospital Clinic, Barcelona, Spain.)
In airways with an internal lumen equal to or greater than 2 mm, mucus is largely produced by submucosal glands (see Fig. 52-2B and D). Mucus produced by the gland is drained through several tubules into the main duct, which finally narrows into a ciliated duct opening into the airways.11 The submucosal gland is formed by mucus cells and serous cells. Gland serous cells secrete a low viscosity compounds with antiinflammatory and antimicrobial properties. Several microbicidal products, that is, lysozyme, lactoferrin, collectins, defensins, and cathelicidins, have been identified in the airway lining fluid.12,13
A small amount of mucus is continuously produced by goblet cells and submucosal glands so as to provide a barrier overlying the airway epithelium. Mucus production can be highly increased in response to stimuli. Several aspects of MUC5AC regulation have been elucidated in detail; conversely, regulation of MUC5B expression is still not entirely understood.14 As depicted in Table 52-2, MUC5AC can be upregulated by several stimuli, among which interleukin-13 seems to play a primary role.15,16
| Inflammatory cytokines | TNF-α |
| IL-1β | |
| IL-4 | |
| IL-6 | |
| IL-9 | |
| IL-13 | |
| IL-17 | |
| Bacterial products | LPS |
| LTA | |
| Peptidoglycans | |
| Flagellin | |
| Growth factors | EGF |
| TGF-α | |
| Retinoic acids | |
| Thyroid hormones | |
| Pollutants | Cigarette smoke |
| Acrolein | |
| Virus | Respiratory syncytial virus |
| Rhinovirus |
Mucus secretion is regulated by three distinct neural pathways:17,18 (a) the cholinergic, (b) the adrenergic, and (c) a nonadrenergic, noncholinergic (NANC) system. The cholinergic system is the most important motor control of secretion,19 and cholinergic fibers can be identified in proximity to the submucosal glands. Parasympathetic nerve stimulation causes rapid mucus release through the muscarinic M3 receptors. Adrenergic stimulation of the airway epithelium causes only a small increase in mucus production. Finally, the NANC system is identified by the mucosecretory response following adrenoceptor and cholinoceptor blockade.18,20 The main neurotransmitters of the NANC system are small-weight peptides, such as the vasoactive intestinal peptide, substance P, neurokinin A, and the gas nitric oxide.
The sol-phase, more properly termed periciliary liquid layer, is a thin low-viscosity fluid that extends to the height of the outstretched cilia21 (see Fig. 52-1D). In humans, the periciliary liquid layer is approximately 7 μm thick and its volume is continuously regulated by the epithelial cells. Periciliary liquid layer water is driven by the luminal concentration of sodium chloride and resulting osmotic gradients. Hence, the epithelium controls the depth of the periciliary liquid layer through purinergic signaling22,23 and activation of adenosine triphosphate P2Y2 and adenosine A2b receptors. The purinergic signaling, in a paracrine–autocrine fashion, also regulates the cystic fibrosis transmembrane regulator chloride channel and the epithelial sodium channel.24
Each ciliated cell has approximately 200 cilia on its surface (see Fig. 52-1A), which move, within the periciliary liquid layer, at approximately 8 to 15 Hz.25 Studies report mucociliary clearance rates between 4 and 20 mm/min, depending on the method of assessment.26,27 Mucus clearance velocity decreases from central toward peripheral airways.28,29 Interestingly, early studies have hypothesized that periciliary liquid layer is largely stationary.30,31 More recent results32,33 suggest that the outermost parts of the cilia (see Fig. 52-1B) initially move the mucus layer; as a result, because of the friction between mucus and the underlying fluid, the periciliary liquid layer is dragged along and travels at a similar rate.
During breathing and cough, airflow interacts with the mucus lining the respiratory airways, which can be eventually propelled via a two-phase gas–liquid flow. Kim et al34–36 first studied the critical conditions necessary to move mucus through such a mechanism. They demonstrated that the main factors consisted of (a) shear stress exerted by the airflow on the liquid layer; (b) the ratio between thickness of the mucus layer and the airway diameter; and (c) the rheologic properties of secretions. Importantly, during mechanical ventilation, inspiratory and expiratory airflows exert opposite shear forces on the mucus layer. Kim et al36 assessed the in vitro effects of tidal airflow, tidal volume, and respiratory rate on movement of mucus simulants and found that mucus velocity can be predicted as follows:
where ρ is the gas density, ν is the absolute value of the highest airflow velocity throughout the respiratory cycle, which is inversely related to the total cross-sectional area of the airways, TI /TTOT is the duty cycle, and η is the mucus viscosity. Tidal volume and respiratory rate were not associated with mucus movement; conversely, as reported in equation (1), the absolute value of the highest airflow influenced mucus movement. Indeed, the authors found that during volume-control mechanical ventilation mucus moved in waves, and the mucus speed was not influenced by the inspiratory flow until its rate reached 90% of the expiratory flow. A recent laboratory study by Volpe et al37 confirmed previous results and also emphasized the role of lung impedance on mucus clearance. Intrinsic positive end-expiratory pressure (PEEP) caused by either elevated minute ventilation or expiratory resistance respectively improved and worsened mucus clearance.
Theoretically, during mechanical ventilation the difference between inspiratory and expiratory flow rate can be modulated by adjusting ventilator settings. As clearly described in Chapter 5, lung elastance, lung volume, and airway resistances are the major determinants of expiratory flow rate during passive expiration. In contrast, inspiratory flow can be easily modulated through the ventilator. For instance, Figures 52-3 and 52-4 imply that changes in (a) mode of ventilation, (b) tidal volume, (c) respiratory rate, (d) duty cycle (TI /TTOT), (e) inspiratory rise time, (f) inspiratory pause time, and (g) PEEP may all modify the inspiratory–expiratory flow rate difference. Despite consistent laboratory results, there is still great paucity of translational in vivo studies. To date, only one report in sheep has demonstrated the feasibility of mucus clearance via two-phase gas–liquid transport modulating the duty cycle.38
Figure 52-3

Pressure and flow waveforms during flow-controlled, volume-cycled ventilation in a healthy pig (36 kg) obtained with a SERVO-i mechanical ventilator (Maquet, Wayne, NJ). Inspiratory and expiratory flow rates generated with baseline ventilator settings (tidal volume [VT] 290 mL, respiratory rate [RR] 20 breaths/min, duty cycle [TI/TTOT] 0.26) are compared against different adjustments of ventilator parameters. Dotted red lines indicate the highest inspiratory (21.6 L/min) and expiratory (–47.2 L/min) flow rates during baseline ventilation. An increase in tidal volume to 360 mL, an inspiratory pause of 6%, and an inspiratory rise time of 5% all increased inspiratory flow. Conversely, reducing the RR to 15 breaths/min and increasing TI/TTOT to 0.75, decreased the inspiratory flow. As expected, changes in lung volume, secondary to increased tidal volume or positive end-expiratory pressure (PEEP, 5 cm H2O,) increased peak expiratory flow. Changes in elastic pulmonary conditions, induced by oleic-acid injury, caused an increase in peak expiratory flow. The effects of each individual ventilator setting on the net movement of mucus need to be thoroughly assessed by systematic in vivo studies.
Figure 52-4

Pressure and flow waveforms during pressure-controlled ventilation in healthy pig (36 kg) obtained with a SERVO-i mechanical ventilator (Maquet, Wayne, NJ). The effects of pressure-limited modes of ventilation on airflow rates are more difficult to predict because inspiratory flow rate is partly related to the mechanical properties of the respiratory system. Inspiratory and expiratory flow rates generated through baseline ventilator settings (pressure control [PC] 14 cm H2O, respiratory rate [RR] 20 breaths/min, duty cycle [TI/TTOT] 0.26) are compared to various adjustments of ventilator parameters. Dotted red lines indicate the highest inspiratory (47.2 L/min) and expiratory (−47.8 L/min) flow rates during baseline ventilation. Of note, only increases in pressure control from 14 to 17 cm H2O produced an increase in inspiratory flow. Conversely, reducing respiratory rate to 15 breaths/min and increasing TI/TTOT to 0.75 decreased the inspiratory flow. Similarly to volume-controlled ventilation, changes in lung volume secondary to increased pressure control or positive end-expiratory pressure (PEEP; 5 cm H2O) increased peak expiratory flow.
Mechanically ventilated patients are often positioned with the trachea oriented above the horizontal (i.e., the semirecumbent position). As a result, mucus transport via two-phase gas–liquid mechanism mainly depends on a balance between the airflow shear forces on the liquid layer and gravitational force. We have studied the effects of gravity in sheep,39 positioned in a model of the semirecumbent position, and found that mucus, accumulated in the proximal trachea, moved in an abnormal backward direction toward and into the lungs (Fig. 52-5).
Figure 52-5
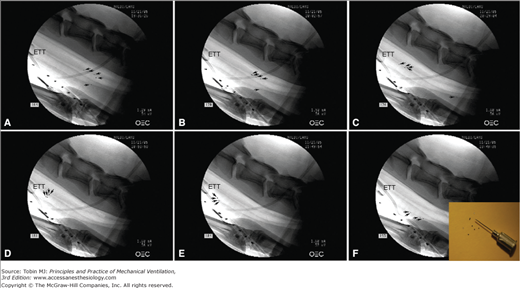
Tracheal mucus velocity studies in sheep after 12 hours of tracheal intubation and positioned with a tracheal orientation above horizontal. Black/white arrows indicate each tantalum disk, tracked to evaluate mucus transport. A. Following disk insufflation, five tantalum disks were deposited in the trachea; four disks were on the dorsal (nondependent) part of the trachea and one disk was on the ventral (dependent) part of the trachea (black dots). Fluoroscopic images taken (B) 24 minutes and (C) 59 minutes following insufflation show mucus transport toward the glottis on the nondependent part, while mucus on the dependent part of the trachea moves toward the lungs. D and E. After 80 minutes mucus almost reached the tip of the endotracheal tube, gravitated to the dependent part of the trachea, and (F) reversed flow back toward the lungs. The enclosed picture in F shows tantalum disks used for those experimental studies. Diameter, thickness, and weight of those disks are 0.60 mm, 0.10 mm, and 0.8 mg, respectively. (Adapted, with permission, from Li Bassi et al.39)
Quantitative Assessment of Secretion Production and Removal
A quantitative assessment of mucus production and clearance in ventilated patients is essential to ascertain the benefits of novel therapeutic strategies; unfortunately, the methods for easy and reliable assessment at the bedside are still inadequate.
The dynamics of mucin expression during mechanical ventilation are currently unknown and should be considered in future studies. Kirkham et al4 first developed a Western blot analysis that allows quantitative measurement of different mucins from retrieved mucus. In clinical settings, mucus can be easily obtained during endotracheal suctioning and stored into a mucus trap. The volume of mucus should be quantified as soon as obtained so as to avoid quantification errors secondary to dehydration. Additionally, in daily clinical practice, it is also important to report qualitative characteristics of mucus, such as color and consistency, to promptly identify any acute or developing respiratory disease.40
The rate of mucus removal in vivo is assessed by measuring either (a) the velocity of traceable particles deposited within the trachea and/or bronchi or (b) the clearance rate of an inhaled radioactive tracer through a gamma camera. A brief description of the most common techniques are reported below and in Table 52-3, but it is important to note that most of these methods are difficult to apply in ventilated patients.
| Method of Assessment | Tracer | Technical Aspects | Settings | Comments | |
|---|---|---|---|---|---|
| Traceable Particles | Cinebronchofiberscopy27 | Teflon disks |
| Clinical/laboratory | Deposition of particles and frequent assessment via bronchoscope may damage the airway epithelium altering mucus transport |
| Bronchofiberscopy41 | Methylene blue dye |
| Clinical | Deposition of particles and frequent assessment via bronchoscope may damage the airway epithelium altering mucus transport | |
| Bronchofiberscopy45 | Charcoal |
| Clinical | Deposition of particles and frequent assessment via bronchoscope may damage the airway epithelium altering mucus transport | |
| Fluoroscopy46 | Teflon disks mixed with bismuth trioxide |
| Clinical/laboratory |
| |
| Fluoroscopy47 | Tantalum Disk |
| Laboratory |
| |
| Radioactive Tracers | Gamma camera26 | Aerosolized human serum albumin microspheres with technetium-99 m |
| Clinical/laboratory |
|
| Gamma camera49 | 10 to 80 μL bolus of albumin microspheres labeled with technetium-99 m |
| Clinical/laboratory | Patient needs to be transferred to another department for gamma camera assessment |
To measure the rate of mucus clearance, movement of a tracer needs to be followed over time and velocity appropriately computed. Normally, the tracer is deposited via the working channel of a bronchoscope. The anatomic location of the deposited tracer greatly influences the results, because an increased rate is reported from the peripheral toward the central airways.28,29 In the cinebronchofiberscopic technique, as first described by Sackner et al,27 ten to fifteen Teflon disks are insufflated into the trachea and their movement continuously monitored as they approach the bronchoscope. In clinical settings, movement of several other tracers has been evaluated through bronchoscopy. In the original studies of Keller et al41 and in later reports,42,43 15 μL methylene blue dye was instilled into the airways of patients undergoing anesthesia, and movement of the front edge of the dye was then sequentially measured through the bronchoscope, and velocity calculated. Charcoal markers44,45 have also been used. The main drawback of bronchoscopic techniques is the frequent invasive insertion of the bronchoscope, which may distort the results. The original technique was modified by Friedman et al,46 who used fluoroscopic tracking of radiopaque disks of Teflon mixed with bismuth trioxide. In our laboratory, we use radiopaque disks made of tantalum.39,47 Six to eight tantalum disks are insufflated into the trachea and their velocities averaged (see Fig. 52-5). Timed, serial, lateral fluoroscopic images are taken by means of a C-arm fluoroscopy system approximately every 5 minutes to compute tracheal mucus velocity through movement of the disks.
Inhaled γ-emitting radioactive tracers have long been used to assess mucus clearance of the whole respiratory system; to quantify the rate of mucus transport, a radioactive bolus is typically deposited in the large airways (most commonly trachea) and its movement measured through external radioactivity counters. The technique was originally described by Yeates et al26 and consisted of tracheal deposition of boluses of technetium 99m (99mTc) human serum albumin microspheres (0.5 μm) suspended in isotonic droplets, achieved by breathing close to total lung capacity and at high low rates. Movement rate of those radioactive boluses was then measured through timed-serial measurement of the radioactive activity for up to 6 hours. In later reports, the radioactive bolus was deposited inside the trachea through a catheter48 or a bronchoscope.49 Few reports have applied these methods in tracheally intubated patients,50,51 mostly because the patient needs to be transferred for scintigraphic assessment, moreover, the analysis can be lengthy at times.
Mucus Dysfunctions and Source of Symptoms in Different Diseases
Patients with diseases associated with overproduction of mucus and impairment of its clearance, such as asthma, chronic obstructive pulmonary disease (COPD), and cystic fibrosis, often require mechanical ventilation. Although mechanical ventilation is lifesaving during acute worsening of those diseases, the delicate balance between mucus hypersecretion and clearance can rapidly deteriorate.
Mucus retention is highly prevalent in mechanically ventilated patients because of several factors. First, following tracheal intubation, mucociliary velocity is approximately 80% slower than normal.50 Sackner et al.52 demonstrated that inflation of endotracheal tube cuff lowers mucociliary velocity by 52% after only 4 hours. Second, when mucus reaches the proximal trachea outward clearance is not possible because of the inflated cuff; therefore, mucus accrues, unless it is aspirated through suctioning or enters the endotracheal tube. Third, continuous leakage53 of bacteria-laden oropharyngeal secretions sustains airways infection and hypersecretion of mucus. Finally, critically ill patients are often incapable of effectively clearing retained mucus secondary to immobilization, weak cough, and muscle weakness.
Asthma is a chronic inflammatory disease characterized by increased and inappropriate release of inflammatory mediators following antigen exposure and consequent airway smooth-muscle constriction.54 Patients with asthma present with varying degrees of cough, shortness of breath, chest tightness, and wheezing. The role of mucus in asthma is often underestimated by clinicians55 because mucus is typically stationary within small and medium airways and clearance is severely impaired, ultimately resulting in the inability to centralize secretions. Many mucus plugs within constricted airways may be identified in patients who die of status asthmaticus.56,57 Mucus in asthma is highly viscous because of an abnormal concentration of plasma proteins,58,59 DNA, cells, and proteoglycans. The abnormal presence of plasma proteins arises mainly from increased plasma exudation.60
COPD is highly prevalent worldwide61 and is the fourth leading cause of death according to the World Health Organization. The characteristic features of COPD are chronic bronchitis with obstruction or full closure of small airways impacted by mucus, enlargement of air spaces, and destruction of lung parenchyma resulting in loss of lung elasticity and emphysema.62,63 In patients with COPD, the increased mucus production is strongly associated with goblet cell metaplasia and mucus gland hypertrophy (see Fig. 52-1C and D). MUC5B is overexpressed, particularly the low-charge glycoform. Hence, the rheologic properties of mucus are altered resulting in deficient mucociliary clearance.64–66 Mucus hypersecretion is associated with progressive impairment of respiratory function67 and death.68
Cystic fibrosis is caused by a defective cystic fibrosis transmembrane regulator gene,69 which results in impaired intraluminal chloride release and increase sodium absorption.70 The electrolytes homeostasis of the periciliary fluid is compromised, hence, the volume of the periciliary liquid layer is depleted and cilia movement is severely perturbed. Indeed, the pathologic hallmarks of the disease are viscous secretions, which adhere tenaciously to the airways and often obstruct the lumen. Although MUC5B is increased relative to MUC5AC,71 the overall concentration of those mucins is reduced,72 but they rapidly increase during disease exacerbations.73
Role in Causing Atelectasis, Pneumonia, and Other Disorders
When mucus is retained, several complications occur as a consequence of (a) progressive reduction of the airways lumen, impacted by mucus, and/or (b) overgrowth of pathogens entrapped within the retained mucus. Excessive accumulation of secretions within the respiratory system and artificial airways makes it difficult to exhale, resulting in intrinsic PEEP and increased work of breathing. Shah et al74 found a significant reduction in the internal volume of the endotracheal tube, which was proportional to the duration of mechanical ventilation. Indeed clinicians, upon extubation, often acknowledge the vast presence of secretion within the endotracheal tube. The mucus-related increase in airflow resistance and work of breathing75 causes breathing discomfort and may retard ventilator weaning.76
Mucus retained in the peripheral airways can ultimately cause atelectasis and gas-exchange impairment. In intubated patients, mucus can be suctioned only in the larger airways; hence, mucus within the small airways may produce complete and irreversible closure, because the pressures necessary to reopen small airways are extremely high and difficult to achieve safely in a ventilated patient. Patients at particular risk of developing mucus-related atelectasis are those with asthma, COPD, cystic fibrosis, infants, children, and those undergoing surgery. In surgical patients, mucociliary clearance becomes impaired in the operative room,77 through the use of anesthetics and tracheal intubation; moreover, inefficient cough, associated with the underlying diseases or the anatomical site of the surgical procedure, increase the risk.
Retained mucus is also associated with lung infections. Patients with underlying respiratory diseases experience periodic exacerbations caused by pulmonary infections. The microbicidal products contained in mucus exert a time-limited effectiveness; Cole et al78 elegantly demonstrated that bacteria added to nasal mucus rapidly acquired resistance to the antimicrobial factors within 24 hours. Those findings suggest that the antimicrobial properties of mucus and clearance work synergistically, and retained mucus eventually become colonized.
Airway Suctioning
In intubated or tracheostomized patients, endotracheal suctioning consists of aspirating secretions retained within the artificial airway, trachea, and main bronchi via a suction catheter. Suctioning is one of the most common daily procedures. It should be performed only by qualified personnel, namely, physicians, respiratory therapists, or nurses, with appropriate skills and training to recognize the need for suctioning, perform it appropriately, and promptly respond to any potential complication.
The primary indication for endotracheal suctioning is to maintain patency of the airways, but it is also commonly performed to obtain secretions for diagnostic purposes. Current guidelines recommend that suctioning should not be performed routinely79 to minimize the risk of unnecessary complications.
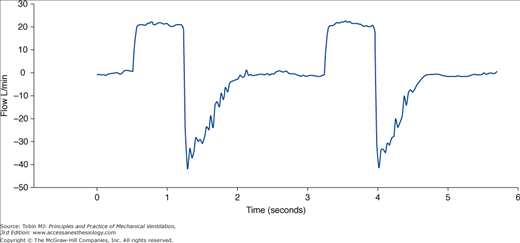
Several parameters have been suggested to detect the need for suctioning (Fig. 52-6). Researchers have focused especially on the typical sawtooth pattern of airflow in patients with secretions (Fig. 52-7). Jubran and Tobin80 first proposed that retained mucus could be detected via the flow-volume loop, and reported that a sawtooth pattern had a good sensitivity and specificity. Guglielmotti et al81 subsequently confirmed that the best predictors of the need of suctioning were (a) respiratory sounds heard via a stethoscope over the trachea, and (b) the sawtooth pattern on a real-time flow-volume loop (sensitivity 0.82, specificity 0.70).
Figure 52-6
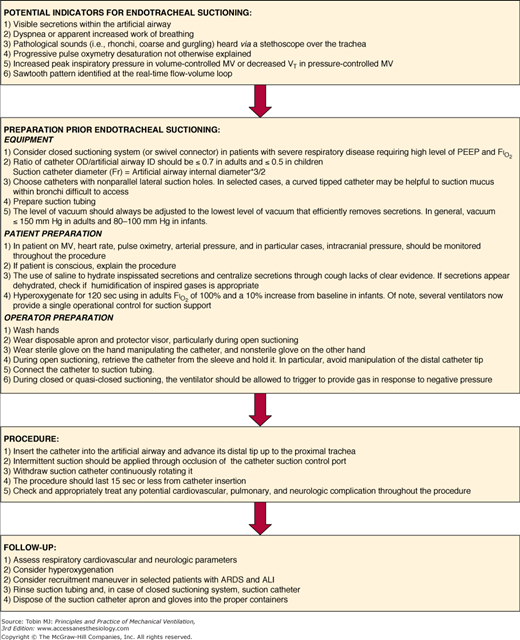
Suggested operative protocol for endotracheal suctioning. ARDS, acute respiratory distress syndrome; ALI, acute lung injury; FIO2, inspiratory fraction of oxygen; ID, internal diameter; MV, mechanical ventilation; OD, outer diameter; PEEP, positive end-expiratory pressure; VT, tidal volume.
Endotracheal suctioning begins with inserting a suction catheter into the artificial airway. Because there is no obvious advantage with deep suctioning versus shallow suctioning, the tip of the catheter should be placed in close proximity to the tip of the endotracheal tube before applying vacuum. As the catheter is pulled back, intermittent suction should be applied and the catheter continuously rotated. Shallow suctioning is particularly advisable in infants to minimize complications.82,83
Related posts:


Stay updated, free articles. Join our Telegram channel

Full access? Get Clinical Tree


