CHAPTER 31 Acute Respiratory Failure
 ] mismatch or pulmonary shunt), neurologic dysfunction (depression of the respiratory drive), cardiac dysfunction (low cardiac output or pulmonary edema), or a lack of hemoglobin to transport gases. Clinically this is seen as arterial hypoxemia leading to tissue hypoxia and/or arterial hypercapnia. Acute respiratory failure (ARF) may evolve over a period of minutes or hours to days depending on the clinical situation. ARF, therefore, is a generic term that encompasses a heterogeneous spectrum of diseases that eventually end with the same pathophysiologic outcomes, namely, arterial hypoxemia (usually with Pa
Physiology of Gas Exchange

Carbon dioxide is transported in the blood mostly in the form of carbonic acid. Only approximately 5% is transported by binding with hemoglobin. Ten percent is transported as dissolved gas.1 As the tissues extract more and more oxygen from the blood, the deoxygenated hemoglobin increases its ability to carry carbon dioxide (Haldane effect). Similarly, as more and more oxygen becomes available in the arterial and venous blood, less carbon dioxide may be carried by the oxidized hemoglobin. This effect has been implicated in the pathogenesis of worsening hypercapnia after oxygen supplementation in patients with baseline hypercapnia.
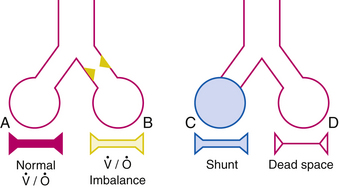
To achieve optimal gas exchange, local matching of ventilation and perfusion has to occur. The interrelationships between ventilation and blood flow are shown schematically in Figure 31-1 where imbalance (B) is typified by bronchospasm, shunt (C) is typified by dense pneumonia or severe acute respiratory distress syndrome (ARDS), and dead space (D) is typified by digestion of the capillaries in emphysema.
 ) and perfusion (
 ). A, Normal
  ratio in which the P
 = 40 mm Hg and P
 imbalance caused by airway obstruction would decrease the P
Normally, both ventilation and perfusion exhibit a gradient from the top to the bottom of the lung. However, the gradient is more pronounced in blood flow than in ventilation, such that in the upper portions of the lung there are predominantly high  areas and in the lower portions of the lung, low
  areas. The overall
  ratio of the normal lung is 0.8.2
This equation gives an estimation of PAO2, which changes with altitude (Pb), with inspired oxygen concentration, and with PaCO2. PaO2 not only changes with changes in PAO2 but also decreases with age in normal individuals. Therefore PAO2-PaO2 increases with age and can be estimated in most adults breathing room air to be approximately 4 mm Hg for each decade of life until the maximum of the seventh decade. This estimation is not valid for patients receiving oxygen supplementation. For these patients, assessment of efficiency of gas exchange can be obtained using the ratio of PaO2 to FIO2 (PaO2/FIO2 ratio normally is above 400 mm Hg). Although it is not as accurate as the PAO2-PaO2 difference, it is useful clinically because most patients with ARF receive supplemental oxygen at the time blood gas analysis is performed. This ratio also forms one of the newer basic criteria for the diagnosis of acute lung injury or ARDS. By consensus acute lung injury is defined as noncardiogenic pulmonary edema with a PaO2/FIO2 ratio of less than or equal to 300 mm Hg; ARDS is diagnosed in the presence of a ratio of less than or equal to 200 mm Hg.3 This ratio is most helpful when used serially or when the ratio changes significantly with a therapeutic maneuver.
Pathophysiology of Acute Respiratory Failure
 mismatch, and shunt. Diffusion abnormalities, which occur with mild pulmonary edema or early interstitial lung disease, may cause exercise-induced hypoxemia but rarely cause clinically significant hypoxemia. Reduction of inspired P
By far the most common cause of clinically important hypoxemia is  mismatching.
  mismatching is present as a continuum from pure shunt
  without
  to pure dead space ventilation
  without
  , with unlimited patterns of
  mismatching in between. In young normal individuals,
  ratios range from 0.6 to 3.0 and usually center around 1.0.4 Low
  lung units can result from compromised ventilation such as obstructed airways or from partial alveolar filling with pneumonia or pulmonary edema. High
  lung units most often occur with obstruction of blood flow due to pulmonary vascular disease or from a lack of capillaries due to lung parenchymal destruction such as that seen in emphysema.
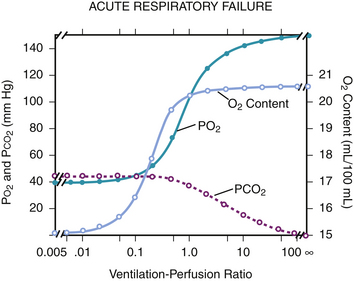
 mismatching causes hypoxemia and hypercapnia. However, in most cases, an increase in minute ventilation stimulated by hypercapnia results in normalization of PaCO2 with persistent hypoxemia. This is possible because the CO2 dissociation curve is linear, allowing well-ventilated areas to compensate. The O2 dissociation curve is sigmoid-shaped; therefore the increase in minute ventilation, despite producing higher end-capillary PO2, results in very modest changes in oxygen saturation, which in most cases is inadequate to reverse the hypoxemia (Figure 31-2). Hypoxemia due to
  mismatching is usually correctable with increasing the FIO2. Local hypoxia in low
  areas triggers reflex hypoxic pulmonary vasoconstriction in an attempt to correct the
  imbalance. This reflex vasoconstriction can be abolished by a number of vasodilators, including nitroprusside, nitroglycerin, calcium channel blockers, and inhalational anesthetics. When compensatory mechanisms fail in a patient with severe lung disease, the body may set a new steady state PaCO2 and pH as an adaptive response to conserve the work of breathing.
 mismatches. In a normal lung, the amount of shunt present is less than 5%. Shunt in the lung results from atelectasis, severe pulmonary edema, and air space consolidation such as pneumonia. In addition, right-to-left shunt can also occur as a consequence of arteriovenous malformation and intracardiac shunts from a patent foramen ovale, patent ductus arteriosus, or ventricular septal defect. Shunt causes significant hypoxemia due to the mixture of oxygenated blood with shunted, poorly oxygenated venous blood. Hypercapnia is usually not present until the shunt is greater than 50%. In contrast to other mechanisms of respiratory failure, hypoxemia due to shunting is not responsive to increases in F
 ) is easily done by administering 100% oxygen for 15 minutes and then analyzing arterial blood gases. Percent shunt can be estimated using a nomogram or by using the following formula:
 denote end-capillary, arterial, and venous blood, respectively. A simplified shunt equation assumes that the
  is normal and that the shunt is less than 25%. This simplified shunt equation states
 mismatching, including very low
  ratios that approach zero, which may act like shunts when alveoli are not ventilated with 100% oxygen.
Clinical Assessment
The presence of hypoxemia, hypercapnia, and respiratory acidosis can be used to define ARF, but it is difficult to set specific levels of PaO2 or PaCO2 because patients with underlying lung disease may have markedly abnormal baselines. Given these qualifications, generally patients with ARF have a PaO2 less than 55 mm Hg or a PaCO2 more than 50 mm Hg. The pH is very helpful in assessing the acuity of the hypoventilation. In cases of subacute or chronic hypoventilation, the patient usually has an elevated serum bicarbonate level and a mild depression of the pH. In acute respiratory acidosis without renal compensation, the pH drops by 0.08 for each 10-mm Hg rise in PaCO2. Compensatory bicarbonate retention or wasting by the kidneys to buffer the pH changes usually takes 2 to 3 days to occur. After renal compensation, a change of 10 mm Hg of PaCO2 will produce 0.03 change in pH in the opposite direction.
The chest radiograph is useful in sorting out the differential diagnosis of ARF during the initial presentation. The causes of hypoxemia can be classified based on radiographic appearance. Table 31-1 shows examples of diseases associated with “white” chest radiographs showing diffuse or patchy infiltrates and diseases associated with “black” chest radiographs showing normal or clear lung fields.
Table 31–1 Radiographic Approach to Acute Respiratory Failure
| Radiograph | Clinical Characteristics | Responses to Oxygen∗ |
|---|---|---|
| “White” Chest Radiograph | ||
| Pneumonia | Fever, leukocytosis, sputum production | + to + + + |
| Adult respiratory distress syndrome | Predisposing risk factors, wedge ≤ 18 mm Hg | + to + + |
| Cardiogenic edema | Paroxysmal nocturnal dyspnea, orthopnea, edema | + + + to + + + + |
| Interstitial lung disease | Prior chest radiographic abnormalities | + + + to + + + + |
| “Black” Chest Radiograph | ||
| Chronic obstructive pulmonarydisease/asthma | Reduced flow on bedside spirometry | + + to + + + + |
| Pulmonary emboli | Acute dyspnea, pleuritic pain | + + + to + + + + |
| Right-to-left shunt | History and physical examination consistent withpulmonary hypertension | + |


