75 Acute Myocardial Infarction
Angina pectoris was recognized in the 18th century; myocardial infarction (MI), however, was described approximately 200 years later. Simultaneous to the identification of MI was the initial introduction and subsequent application of the electrocardiogram (ECG)—the first objective method of assessing the coronary origin of the presentation. In fact, early clinician investigators described the evolving “electrographic” changes during angina in 1918.1 Over the next 50 years, angina pectoris and MI were further characterized and diagnosed; unfortunately, however, the management of ischemic heart disease did not progress as significantly. From this point in medical history until the 1960s, management consisted primarily of pain relief coupled with strict bed rest for prolonged periods and management of resultant congestive heart failure (CHF); acute complications such as cardiogenic shock and sudden cardiac death were invariably fatal events. Subsequently, the introduction and widespread use of cardiopulmonary resuscitation, external defibrillation, and antidysrhythmic agents gave the clinician powerful new tools in the management of sudden cardiac death and other malignant dysrhythmias. Overall management, however, was still aimed at the complications of ischemic heart disease rather than the syndrome itself.
 Epidemiology
Globally, cardiovascular disease now ranks as the leading cause of death. It now causes one third of all deaths worldwide. The World Health Organization (WHO) in conjunction with the Centers for Disease Control and Prevention (CDC) published the Atlas of Heart Disease and Stroke; in this report, the WHO/CDC note a combined death toll of 17 million persons per year, with a potential increase to 24 million people per year by 2030.2 In the United States, ischemic heart disease, particularly acute forms of the illness, is the leading cause of death for adults. Unfortunately, half of these deaths result from sudden cardiac death unrelated to ACS, usually within the first 2 hours of symptom onset, either out of hospital or soon after arrival in the ED. Fifteen percent of the fatalities occur prior to age 65 years, with the majority in women. The “burden” placed on medical centers and other acute care facilities is tremendous, with an approximate 8 million people having been admitted to hospital in the past 20 years; 20% of these admissions involve AMI. Furthermore, while death from coronary heart disease has decreased in North America and many western European countries, there is an increased mortality in developing countries.3,4
According to the American Heart Association,5 coronary heart disease caused approximately 1 of every 6 deaths in the United States in 2006. In 2010, an estimated 785,000 Americans will have a new coronary event, and approximately 470,000 will have a recurrent attack. It is estimated that an additional 195,000 “silent” first MIs occur each year. These events usually occur in patients over the age of 40 years, with an increasing occurrence as one ages. Approximately every 25 seconds, someone in the United States will have a coronary event, and approximately every minute someone will die of one such event.5
 Pathophysiology
Historically, the two primary intracoronary pathophysiologic events underlying the development of ACS include thrombus formation and vasospasm. In the setting of either a structurally normal artery or preexisting coronary artery disease, initial endothelial damage produces platelet aggregation and resultant thrombus formation. In most cases, disruption of an atherosclerotic plaque provides the endothelial injury. Occlusion of the coronary artery then results, ranging from minimal, transient, asymptomatic obstruction to complete occlusion usually associated with prominent symptomatology, namely AMI. Coronary artery obstruction can lead to myocardial ischemia, hypoxia, acidosis, and ultimately AMI. Vasospasm results when locally active substances are coupled with systemic mediators to produce a cascade of events resulting in worsened myocardial perfusion. Isolated vasospasm followed by thrombus is involved in approximately 10% of AMIs. Refer to Figure 75-1 for a depiction of the acute pathophysiology of AMI.
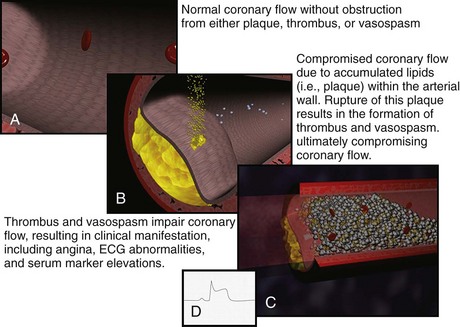
Figure 75-1 Pathophysiology of acute myocardial infarction.
(Figures courtesy Ashok Subramanian, MD.)
In the last decade, the definition of MI has evolved. The European Society of Cardiology and the American College of Cardiology published consensus criteria for “redefinition” of MI in 2000.6 These criteria reflected the improvements in biomarker testing. Then in 2007, working groups from these organizations along with the World Heart Federation and American Heart Association published the “Universal Definition of Myocardial Infarction.”6 This expanded definition classifies infarction based on clinical situations resulting in myocardial necrosis/cell death.6
The term myocardial infarction should be used when there is evidence of myocardial necrosis in a clinical setting consistent with myocardial ischemia. Under these conditions, any one of the following criteria meets the diagnosis for myocardial infarction; the various subcategories of acute myocardial infarction are referred to as types 1 to 56:
Criteria for prior MI includes the following6:
 Clinical Features
There has been disagreement over whether these coronary risk factors should be considered in the clinician’s medical decision making. An early report5 suggested that such factors, which were initially derived because of their ability to predict the development of coronary atherosclerosis and its complications over decades in association with other clinical variables such as ECG interpretation, have minimal predictive value acutely as to whether a patient is currently experiencing an AMI. More contemporary investigation in possible ACS patients suggests that the coronary risk factors do in fact have significant predictive value.7,8,9 This important issue is still debated by the epidemiologists; for the clinician, a consideration of the risk-factor burden is one feature of the overall diagnostic analysis.
Because angina is a visceral sensation that is often diffuse, some patients may have an anginal equivalent syndrome. Such anginal equivalent presentations describe patients who are experiencing ACS yet do not complain of typical chest pain; rather, these patients note atypical pain, dyspnea, weakness, diaphoresis, or emesis—these complaints, in fact, are the manifestation of the ACS event. Patients with altered cardiac pain perception (e.g., the elderly or patients with long-standing diabetes mellitus) are potentially at risk to present with anginal equivalent syndromes. A recent large survey of 434,877 confirmed AMI patients reported that a significant minority of these individuals—approximately 30%—lacked chest pain on presentation, noting only the anginal equivalent complaints.10 The most frequently encountered anginal equivalent chief complaint is dyspnea, which is found in 10% to 30% of patients with AMI, often due to pulmonary edema.10,11,12 Isolated emesis and diaphoresis are quite rare.11,12
The geriatric patient may also present atypically with acute weakness (3%–8%) and syncope (3%–5%).13 Unexplained sinus tachycardia, bronchospasm resulting from cardiogenic asthma, and new-onset lower extremity edema have all been reported as anginal equivalent presentations for AMI in this age group. Among the very elderly, anginal equivalent syndromes typically involve neurologic presentations with acute mental status abnormalities and stroke. From the perspective of acute delirium, less than 1% of such patients in an ED population with altered mentation will be found to have AMI. AMI associated with acute stroke is noted in approximately 5% to 9% of patients.13
Physical Examination
The physical examination in the patient with AMI rarely provides diagnostic confirmation of the illness; the examination can certainly suggest MI yet not confirm its presence. The ECG, serum markers, and other investigations interpreted in the context of the clinical event confirm the diagnosis. Specific examination findings resulting directly from ACS include anxiety, pale appearance, and diaphoresis. In fact, the presence of significant diaphoresis as a physical examination finding is strongly suggestive of AMI.14 Significant physical examination findings encountered in the AMI patient most often result indirectly from the coronary event and result directly from complications of the AMI. These findings include hypotension, altered mentation, various other signs of poor perfusion, rales and low oxygen saturations related to pulmonary congestion, and heart sounds related to myocardial and/or valvular dysfunction.15 Both brady- and tachydysrhythmias are seen as well. And, of course, the combination of poor peripheral perfusion—manifested by hypotension unresponsive to hemodynamic support—and pulmonary edema is considered cardiogenic shock.
Caution should be exercised when attributing a chest wall source for pain based on palpation or movement. To safely relate the chest discomfort to a chest wall origin, the pain must be described as sharp or stabbing (i.e., pleuritic in nature) and be completely reproducible by palpation.16 Up to 15% of patients with AMI may have some form of tenderness on chest wall palpation.17
 Diagnostic Strategies
Electrocardiogram
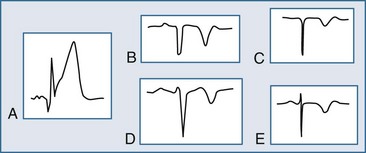
The ECG may manifest a range of ECG abnormalities (Figure 75-2) in the patient with potential AMI, including the prominent T wave, T-wave inversion, ST-segment depression, ST-segment elevation, and QA waves, among other findings. The earliest ECG finding resulting from STEMI is the hyperacute T wave, which may appear minutes after the interruption of blood flow; the R wave also increases in amplitude at this stage. The hyperacute T wave, a short-lived structure that evolves rapidly on to ST-segment elevation over a 5- to 30-minute period, is often asymmetric with a broad base; these T waves are also associated not infrequently with reciprocal ST-segment depression in other ECG leads. Such a finding on the ECG is transient in the AMI patient; either apparent or progressive ST-segment elevation is usually encountered at this stage. As the infarction progresses, the hyperacute T wave evolves into the giant R wave, particularly in the anterior wall AMI. The giant R wave is a transition structure from the hyperacute T wave to typical ST-segment elevation; it essentially is a large monophasic R wave with pronounced ST-segment elevation. Prominent T waves may be seen in patients with AMI as well as hyperkalemia, acute myopericarditis, benign early repolarization, left ventricular hypertrophy, and bundle branch block.
Within moments, the ST segment assumes a more easily recognized morphology. In approximately 85% of STEMI patients, the initial upsloping portion of the ST segment is either convex or flat; if the ST segment is flat, it may be either horizontally or obliquely so. An analysis of the ST-segment waveform can be particularly helpful in distinguishing among the various causes of ST-segment elevation and identifying the AMI case. This technique uses the morphology of the initial portion of the ST segment/T wave—defined as beginning at the J point and ending at the apex of the T wave. Patients with noninfarctional ST-segment elevation (i.e., early repolarization or left ventricular hypertrophy-related change) tend to have a concave morphology of the waveform. Conversely, patients with ST-segment elevation due to AMI have either obliquely flat or convex waveforms. The use of this ST-segment elevation waveform analysis in emergency room chest pain patients increases specificity for the AMI diagnosis.18 This morphologic observation should be used only as a guideline. As with most guidelines, it is not infallible.
Significant ST-segment elevation occurring in at least two anatomically oriented leads is the primary ECG indication for fibrinolysis or urgent PCI. In that ST-segment elevation represents a significant finding, a brief review of the various causes of ST-segment elevation in the chest pain patient is warranted. Unfortunately, ST-segment elevation in the chest pain patient less often results from AMI; in fact, only 20% to 30% of chest pain patients will have STEMI—the remainder of these patients will have noninfarctional causes of the ST-segment elevation.18,19 Patients with chest pain may present electrocardiographically with ST-segment elevation due to AMI, confounding patterns, or masquerading syndromes. In most instances, ST-segment elevation resulting from AMI is easily noted. Confounding patterns such as LBBB, ventricular paced rhythms, and left ventricular hypertrophy may obscure the typical ECG findings of AMI as well as produce noninfarctional ST-segment elevation, which may lead the uninformed clinician astray. Other ST-segment elevation patterns, including benign early repolarization and acute pericarditis, occur in the individual with chest discomfort and may suggest the incorrect diagnosis of AMI, exposing the patient to unnecessary and potentially dangerous therapies.
Reciprocal ST-segment depression, also known as reciprocal change, is defined as ST-segment depression in leads separate and distinct from leads reflecting ST-segment elevation. Importantly, this form of ST-segment depression is not associated with situations in which altered intraventricular conduction produces deviation—such as bundle branch block, left ventricular hypertrophy, and ventricular paced rhythms. Reciprocal change in the setting of a STEMI identifies a patient with an increased chance of poor outcome and, therefore, an individual who may benefit from a more aggressive approach. Furthermore, its presence on the ECG supports the diagnosis of AMI with very high sensitivity and positive predictive values greater than 90%. The use of reciprocal change in both prehospital and emergency room chest pain patients increases the diagnostic accuracy in the ECG recognition of AMI.20,21 Reciprocal change is seen in approximately 75% of cases of inferior wall AMI and much less often in cases of anterior wall MI (30%).20,21
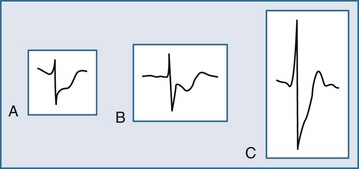
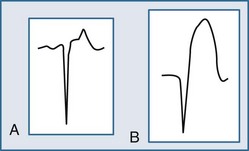
Several ECG patterns confound the diagnosis of AMI, including LBBB, ventricular paced rhythms, and left ventricular hypertrophy. In the patient with LBBB, the anticipated or expected ST-segment/T-wave configurations are discordant, directed on the opposite side of the isoelectric baseline from the terminal portion of the QRS complex. This relationship is called QRS complex–T wave axes discordance (Figure 75-3).22,23 Loss of this discordance in patients with LBBB may imply AMI. The clinician must realize, however, that the ECG is markedly compromised as a diagnostic tool in this setting. As with the LBBB pattern, the right ventricular paced rhythm and left ventricular hypertrophy patterns can both mimic and mask the manifestations of AMI. In ventricular paced rhythms, the principle of appropriate discordance should also be followed. An inspection of the ECG in patients with ventricular paced rhythms must be performed, looking for a loss of this QRS complex–T wave axes discordance. Loss of this normal discordance in patients with ventricular paced rhythms can suggest AMI.24 Left ventricular hypertrophy is not uncommonly encountered on the ECG of chest pain patients. Its presence on the ECG, particularly the repolarization changes that alter the morphology of the ST segment and/or the T wave, can confound the early evaluation. These repolarization changes are seen in approximately 70% of cases and represent the new norm for the patient with electrocardiographic left ventricular hypertrophy.25 Left ventricular hypertrophy is associated with poor R wave progression, producing a QS pattern in the right to mid-precordial leads. In most instances, the ST-segment elevation is seen here along with prominent T waves. ST-segment depression with inverted T wave is also seen in the lateral leads.
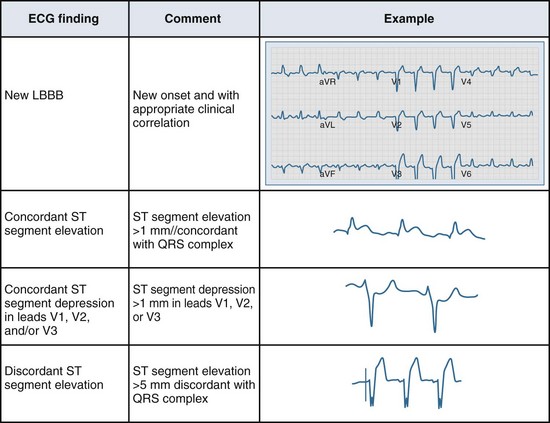
Figure 75-3 Electrocardiographic indications for reperfusion therapy in the left bundle branch block presentation.
Stay updated, free articles. Join our Telegram channel

Full access? Get Clinical Tree


