Viral hepatitis
Hepatitis A, B, D, and E (HAV, HBV, HDV, HEV respectively).
Herpes Simplex virus Hepatitis
Epstein Barr virus Hepatitis
Yellow fever
Q fever
Drug toxicity
Acetaminiphen
Halothane
Isoniazid
Sodium valproate
Antimicrobials: ampicillin with clavulinic acid, erythromycin, tetracycline, ciprofloxacin
Troglitazone
Cyclophoshamide
Loratadine
Antabuse
Propylthioviacil
Ketoconazole
Phenytoin
Tricyclics
Ecstasy
Other toxins
Amanita phalloides
Organic solvents
Herbal medicine (ginseng, penny royal oil, and teucrium polium)
Bacterial toxins (E. bacillus and cyanobacteria cereus)
Miscellaneous
Reye’s syndrome
Eclampsia
Autoimmune hepatitis
Acute fat liver of pregnancy
Heat stroke
Budd-Chiari syndrome
Cardiac failure
Leukemia
Lymphoma
Malaria
Ischemia
Lecithin-cholesterol acyl transferase deficiency
Wilson’s disease
Portal vein thrombosis
Cardiac tamponade
Pathophysiologic Changes and Monitoring in Acute Liver Failure
ALF patients have heterogeneous clinical presentation, but they do share common disease process of acute hepatocyte loss and its sequelae. Presenting symptoms are often nonspecific, including fatigue, malaise, anorexia, nausea, abdominal pain, fever, and jaundice [5]. Often these symptoms progress to severe coagulopathy and encephalopathy and/or coma. Clinical deterioration is often rapid and any worsening in the patient’s condition should warrant urgent referral to a transplant center. Acute liver failure affects multiple organ systems in the body including the central nervous system, the cardiovascular, pulmonary, renal, metabolic, and coagulation systems [13]. Monitoring the patient with ALF will involve appropriate assessment of all these organ systems.
Central Nervous System
In adult patients encephalopathy is the hall mark of acute liver failure. Several mechanisms have been implicated [14, 15]: (1) impaired ammonia metabolism in the Astrocytes, (2) ionic shift, (3) abnormal energy metabolism, (4) impaired neurotransmission. Inadequate metabolism of ammonia in the liver triggers a multilayered neurometabolic cascade of physiologic changes that affects the cerebral hemodynamics. Encephalopathy is divided into four grades [16] with grade 4 being most severe. Interestingly, the grades of encephalopathy may fluctuate from one level to the other especially in the early part of the illness and is not a good determinant of the cerebral hemodynamic state.
In acute liver failure the typical signs and symptoms of increased intracranial pressure like nausea, vomiting, and papilledema are absent. The changes in the central nervous system can only be assessed by determining cerebral hemodynamic and metabolic changes. The cerebral hemodynamic parameters and techniques to be considered for monitoring are: Cerebral blood flow (CBF), Cerebral metabolic rate of oxygen consumption (CMRO2), arterial-jugular venous oxygen content (AJDO2) difference, CO2 reactivity, intracranial pressure (ICP), cerebral vascular resistance (CVR), computerized tomography (CT scan), and determination of cerebral blood flow velocity using transcranial Doppler Ultrasonography (TCD).
The compliance of the brain progressively decreases as the cerebral blood volume increases from normal to high and eventually the intracranial pressure is so high that the brain either herniates or is in a state of impending herniation as schematically represented in Fig. 32.1 [17–19].
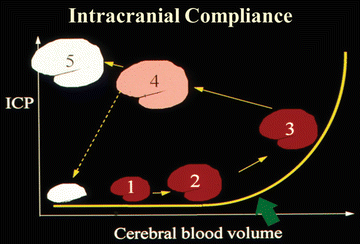
Fig. 32.1
Change in intracranial compliance in acute liver failure. Relationship between cerebral blood volume and intracranial pressure (ICP) as patient advances from Phase 1–5
Five Phases of Cerebral Hemodynamic and Metabolic Changes
The cerebral hemodynamic and metabolic changes observed in acute liver failure are divided into five different phases and are presented in Fig. 32.2 [20]. These phases are independent of the grades of encephalopathy. They are characterized as follows:
Fig. 32.2
Cerebral hemodynamics and metabolic changes and treatments in phases 1–5 in patients with acute liver failure. MAP mean arteryl pressure, ICP intracranial pressure, CBF cerebral blood flow, CMRO 2 cerebral metabolic rate of oxygen consumption, AJDO 2 arterial jugular venous oxygen content difference, CVR cerebral vascular resistance, TCD transcranial Doppler ultrasonography
Phase 1 (Coupled): Demand (CMRO2) and supply (CBF) are matched as demonstrated by normal AJDO2 difference. In this phase the ICP is normal, response of CBF to arterial CO2 changes (CO2 reactivity) is intact. Cerebral vascular resistance is normal and there is no brain swelling.
Phase 2 (Uncoupled): Demand (CMRO2) is low but the supply (CBF) in spite of being low, is more than the demand of the brain (relative hyperemia) as demonstrated by narrow AJDO2. In this phase ICP is still normal and CO2 reactivity is still intact. However, cerebral vascular resistance is decreased although there is still no brain swelling.
Phase 3 (Uncoupled): Demand (CMRO2) is low but the supply (CBF) is high (absolute hyperemia) as demonstrated by narrower AJDO2. CO2 reactivity, although reduced, is still intact. However, ICP is high, cerebral vascular resistance is further decreased and brain swelling may be present.
Phase 4: Demand (CMRO2) is low and the supply is low (CBF), as demonstrated by normal AJDO2. The AJDO2 is deceptively normal. Supply is low because of very high ICP and the blood flow to the brain is reduced because of extramural compression of the cerebral vessels by cerebral swelling. CO2 reactivity is markedly reduced. Cerebral vascular resistance is normal and the brain is swollen. These observations confirm that ICP monitoring is extremely important in management of these patients. It is ICP which distinguishes coupled Phase 1 from the seemingly coupled Phase 4, which is close to herniation.
Phase 5 (Impending herniation or herniation): Shows minimal CBF with very high ICP.
It is uncommon to see all five phases in one patient, because (1) the natural disease progression is highly variable. The phases may change from one to the other within hours, or in days, depending on the etiology and other compounding factors like other organ system involvement; (2) impact and timing of liver transplantation; and (3) the phase at which the patient was referred, as the patient may have already passed through some of the phases prior to being transferred to the hospital. The first four phases of cerebral hemodynamic changes are reversible. Therefore, it is crucial to monitor the cerebral hemodynamics in order to institute proper therapy before irreversible changes occur.
Cerebral Blood Flow (CBF)
CBF can be determined using the intravenous Xe-133 clearance technique [21] and/or stable xenon-CT scan method [22]. The intravenous Xe-133 clearance technique is the preferred method as (1) it can be determined at the bed side, and the risks associated with moving a hemodynamically unstable patient from intensive care unit setting to radiology suite can be eliminated; and (2) this technique can be performed more frequently. The limitation of this technique is that it solely measures CBF. Stable xenon-CT scan determinations of CBF also provide information regarding intracranial pathology which may help to determine the cause of the coma; i.e. cerebral swelling, space occupying lesion, and cerebral hemorrhage. However, to determine CBF by this technique the patient has to be transported to the CT scanner. It may be dangerous to transport a critically ill patient. Therefore, this technique should only be used in select circumstances.
Since acute liver failure is a metabolic disorder, the CBF changes are global. Interestingly, low CBF can even be seen in higher grades of coma (grade 3 and 4) [23–25]. Low CBF most often is not ischemia, as these patients have very low CMRO2. Usually, low blood flow is coupled and is a good prognostic sign unless the patient is in phase 4 of cerebral hemodynamic and metabolic changes of the brain, where blood flow is low because of massive swelling and intracranial hypertension [20]. High cerebral blood flows, which are usually seen in grade 4 coma, are associated with cerebral swelling and intracranial hypertension and have a poor outcome [23, 26].
Arterial-Jugular Oxygen Content Difference (AJDO2)
AJDO2 is determined by analyzing the difference in oxygen content of systemic arterial blood and the jugular venous blood. Jugular venous samples can be obtained by inserting a catheter in the internal jugular vein [27, 28]. The position of the catheter tip must be confirmed by lateral roentgenogram of the head and neck. If the tip of the catheter is not at the level of jugular bulb, the blood samples can be contaminated by extra cranial blood and will give false results. Blood samples can also be contaminated if the blood samples are drawn rapidly.
AJDO2 is a good bed side clinical tool to determine (1) changes in global cerebral blood flow and (2) the adequacy of CBF in relation to cerebral metabolic rate of oxygen consumption (CMRO2). This is only applicable if the CMRO2 remains unchanged. Since AJDO2 = CMRO2/CBF, monitoring and managing the AJDO2 can eliminate repeated determination of CBF [29].
At a PaCO2 of 40 mmHg, the normal AJDO2 range is 5.1–8.3 vol.%. The normal AJDO2 range for other levels of PaCO2 can be calculated by increasing the AJDO2 range by 3 % for a decrease of each mm Hg in PaCO2 and vice-versa. A normal AJDO2 indicates that the supply of CBF is closely coupled with the cerebral metabolic demand of the oxygen. AJDO2 below the normal range demonstrates uncoupling, showing cerebral hyperperfusion relative to CMRO2 (cerebral luxury perfusion), whereas values above the normal range, which also indicate uncoupling, are consistent with cerebral hypoperfusion relative to CMRO2.
In acute liver failure, very few patients have normal AJDO2 (coupling). A majority of patients have low AJDO2 (uncoupling) which is most likely caused by depressed cerebral metabolism. Moreover, if the AJDO2 and CBF both are very low, this may indicate minimal extraction of oxygen and irreversible brain injury as seen in phase 5 [20, 29].
Cerebral Metabolic Rate of Oxygen Consumption (CMRO2)
CMRO2 is calculated as product of CBF × AJDO2/100. In acute liver failure CMRO2 is depressed even in early phases of the disease. It is usually less than 50 % of normal [23, 24]. In some instances it can even be as low as 25 % of normal, and still the patients may recover without apparent neurological deficit. Low CMRO2 may very well be an indication of the depressed active and basal metabolism of the brain. Unlike in head injury [29], CMRO2 is not a predictor of outcome in acute liver failure [23, 24].
CO2 Reactivity
CO2 Reactivity is the response of CBF to changes in arterial CO2 tension. The normal response is 3 % CBF change per mm Hg change in PaCO2. It is a relatively noninvasive technique. The response of CBF changes to CO2 alterations provides a tool to predict the efficacy of hypo or hyperventilation from both the therapeutic and prognostic points of view [20]. In determining CO2 reactivity certain precautions must be observed: (1) Systemic mean arterial pressure must be maintained (2) An observable change in CBF requires a minimum of 5 mmHg alteration in CO2 (3) Prior to determining CO2 reactivity, a baseline CBF needs to be assessed in order to ensure that a patient with low CBF is not hyperventilated and that a patient with high CBF is not hypoventilated.
CO2 reactivity is well preserved in early phases (phase 1, 2) for hyper and hypoventilation [17, 20, 30]. However, in phase 3 and 4, although the vascular response to changes in PaCO2 is preserved for hyperventilation, it is reduced for hypoventilation. This change in response suggests that as patients move towards higher phases, the vessels become more dilated and lose their vasomotor tone for further dilatation. It should be noted that hyperventilation can still be an effective therapy for reducing CBF in late phases as shown in Fig. 32.3.
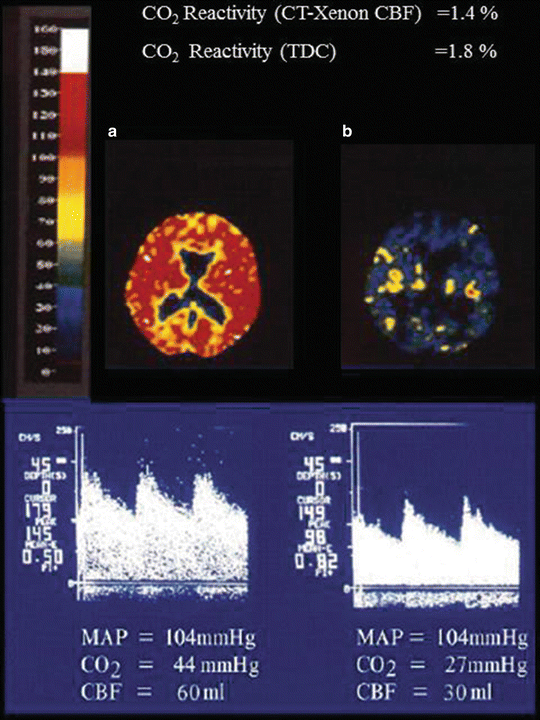
Fig. 32.3
CO2 reactivity in a patient with acute liver failure. (a) Cerebral blood flow (CBF) determined by CT-Xenon method and cerebral blood flow velocity (CBFV) determined by Transcranial Doppler ultrasonography (TCD) at PaCO2 of 44 mmHg, mean artery pressure (MAP) of 104 mmHg. (b) Cerebral blood flow (CBF) determined by CT-Xenon method and cerebral blood flow velocity (CBFV) determined by Transcranial Doppler ultrasonography (TCD) at PaCO2 of 27 mmHg, mean artery pressure (MAP) of 104 mmHg
Cerebral Vascular Resistance (CVR)
CVR is calculated as (MAP − ICP)/CBF (normal = 3.6 mmHg/ml/100 g) CVR is normal in phase 1. When the cerebral vessels dilate the vascular resistance reduces as in phase 2. In phase 3, cerebral vascular resistance reduces further, however, increase in cerebral blood volume causes a rise in ICP [19]. In phase 4, because of cerebral swelling, CVR is increased to a point that the CBF is reduced [20].
Intracranial Pressure (ICP)
ICP is one of the most important parameters to be monitored in acute liver failure. This is because 40 % of mortalities in this population are from brain herniation [31]. An ICP monitoring device should be inserted as soon as patient is intubated. It is challenging to insert an ICP monitoring device because of the coagulopathy associated with liver failure.
Prior to inserting an ICP monitor (1) computed tomography (CT scan) of the head should be performed in order to rule out any adverse intracranial pathology; (2) coagulation status must be optimized after evaluation by either following the conventional coagulation parameters (prothrombin time, partial thromboplastin time, platelet count, and fibrinogen degradation products) and/or thromboelastography (reaction time >6 min, alpha angle >50°, maximum amplitude >50 mm, and whole blood clot lysis time >300 min) [32, 33]; and (3) the airway must be secured.
There are three different sites for inserting intracranial pressure monitoring devices: epidural, subdural, and parenchymal. Out of these three sites, epidural placement is the most popular because of lowest incidence of hemorrhage (<4 %), and infection (<1 %) [34, 35]. Parenchymal placement has the highest incidence of both hemorrhage (13 %) and infection (4 %). While, the drawback of an epidural monitoring device is its unreliability in obtaining absolute ICP values, it does measure changes in ICP consistently.
The etiology of intracranial hypertension in ALF is unknown. However, it appears that toxins lead to cerebral vasodilation, which increases cerebral blood volume, followed by an increase in intracranial pressure, and increased capillary leak (vasogenic cerebral edema). Cerebral edema further compounds the intracranial pressure. Initially, the ICP increase precedes the development of cerebral swelling. Later, the increase in ICP is compounded by cerebral swelling. An increase in ICP is seen when the CBF is high and cerebral vascular resistance is low indicating increase in cerebral blood volume [36]. The precipitating factors for cerebral vasodilation and increase in cerebral blood volume are: (1) anemia and episodes of hypotension [37]; (2) hypoxia caused by pulmonary congestion; and (3) lactic acidosis [24].
It is interesting that, in acute liver failure, papilledema has not been reported to be observed in conjunction with intracranial hypertension. In acute liver failure patients, high ICP’s (>40 mm H2O) are tolerated much better in comparison to patients with head injury [38]. Once intracranial hypertension sets in, it is difficult to control unless and until the diseased liver is replaced by a normal functioning liver. With every new episode of intracranial hypertension, it becomes increasingly difficult to bring the ICP to its baseline value and the subsequent fluctuations are more pronounced. Unequal and dilated pupils are seen with extremely high ICP’s, but, fortunately, these can be reversed by aggressive medical management.
Computed Tomography of the Head
It is very difficult to transport these patients to a computed tomography (CT) scanner, as they may be (1) hemodynamically unstable, (2) on assisted ventilation, and (3) require multiple vasopressor infusions. However, it is essential to obtain a CT scan of the head in order to: (1) to establish baseline condition of the brain on admission to intensive care unit; (2) prior to insertion of ICP monitor; and (3) in any acute change in neurological status, particularly a sharp rise in ICP.
It is interesting that cerebral swelling appears mostly in phase 3 and 4 and is associated with very high blood volume [20, 23, 24, 37, 39, 40]. Presence of cerebral swelling in conjunction with high CBF indicates a poor prognosis [41]. Likewise loss of the gray–white matter interface signifies a poor prognosis. During these phases, if cardiovascular status becomes very unstable, liver transplantation may become contra-indicated.
Cerebral Blood Flow Velocity (CBFV)
CBFV can be measured by using transcranial Doppler ultrasonography (TCD) . TCD consists of a pulsed Doppler instrument operating at a low frequency (2 MHz), coupled with a computer that performs Fourier transformation of the complex waveform data for real-time spectral display. This technique is noninvasive, can be used at the bedside to determine CBFV in all the major intracranial vessels [42, 43].
TCD variables (Fig. 32.4) include systolic cerebral blood flow velocity (SFV), diastolic cerebral blood flow velocity (DFV), mean cerebral blood flow velocity (MFV), or [(SFV + DFV)/2]), and pulsatility index (PI), or [(SFV − DFV)/MFV]). Every variable of the waveform is important, however, diastolic cerebral blood flow velocity determines the period during which the brain receives its blood flow. Pulsatility index is believed to reflect cerebrovascular resistance and thus shows exponential correlation with ICP. In TCD monitoring, the observed trends over time are more revealing than any single set of measurements [44].
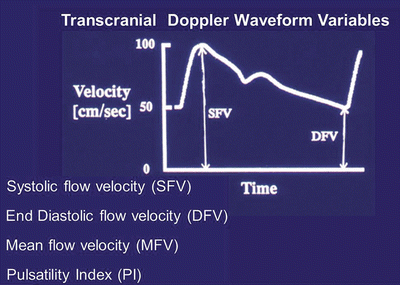
Fig. 32.4
Variables of Transcranial Doppler ultrasonography waveform. SFV systolic blood flow velocity, DFV diastolic blood flow velocity, MFV mean blood flow velocity, PI pulsatility index
TCD can be used to estimate: (1) cerebral blood flow, (2) ICP, (3) CO2 reactivity, and (4) effect of various therapeutic modalities on CBF, ICP, and CO2 reactivity [45, 46]. Figure 32.2, shows sequential changes in TCD patterns of a patient with acute hepatic failure [47]. Phase 1: Decreased systolic cerebral blood flow velocity (normal = 61 cm/s), normal pulsatility index (normal = 0.90 ± 0.24). Phase 2: Normal systolic cerebral blood flow velocity with low pulsatility index. Phase 3: Increased systolic cerebral blood flow velocity with low pulsatility index. Phase 4: Decreased systolic cerebral blood flow velocity, with high pulsatility index. Phase 5: Negative diastolic flow or retrograde CBF (brain death). Figure 32.3 shows the effects of hyperventilation on TCD patterns of a patient with acute liver failure. It shows that as the patient is hyperventilated and the PaCO2 is decreased from 44 to 27 mmHg the mean cerebral blood flow velocity reduces from 145 to 98 cm/s and at the same time the CBF determined by CT-xenon method also shows reduction from 80 to 60 ml/100 g. This indicates that; (1) the CO2 reactivity demonstrated by TCD compares very well with the CT-xenon CBF determination method, (2) CO2 reactivity is preserved even at very high CBF, though 50 % of normal (CO2 reactivity 1.4 %) [48–50] demonstrating that hyperventilation is an effective therapeutic modality in reducing CBF. The diminished CO2 reactivity is secondary to the vessels developing vasoparalysis. Figure 32.5 shows the effects of barbiturates on TCD patterns of a patient with acute liver failure. In a patient with high intracranial pressure (ICP = 34 mmHg, PI = 1.92) when barbiturates are administered, the ICP (28 mmHg) and PI (1.27) are reduced, provided the mean arterial pressure (MAP) is maintained at normal level (>80 mmHg). If the MAP reduces as an effect of barbiturates then ICP may further increase and cerebral perfusion may reduce to dangerously low levels. MAP should be maintained by administering vasopressors, alone or in conjunction with increased fluid volume
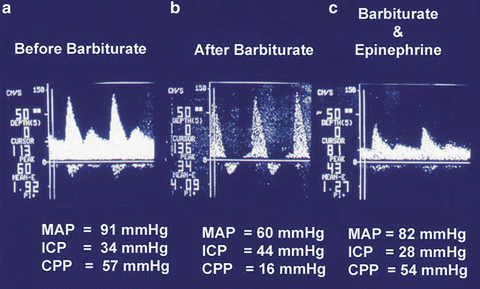
Fig. 32.5
Effect of Intravenous Barbiturate administration on Cerebral Blood Flow Velocity in an Acute Liver Failure patient with intracranial hypertension. (a) Cerebral Blood flow velocity in a patient with increased intracranial pressure (ICP). (b) Effect of barbiturates on ICP during hypotension (MAP = 60 mmHg), Cerebral Blood flow velocity shows loss of diastolic flow velocity and increase in ICP to 44 mmHg. (c) Effect of Barbiturate on ICP after restoration of mean artery pressure (MAP = 82 mmHg) by Epinephrine infusion. Cerebral Blood flow velocity shows restoration of diastolic flow velocity, and decrease in ICP to 28 mmHg
Cardiovascular System
Acute liver failure has varied hemodynamic manifestations depending on the etiology and the severity of the illness. It is essential that pulmonary artery catheter be placed so that appropriate diagnosis and treatment be made. Often in early phases of the disease (phase 1 and 2) these patients show a normal cardiac hemodynamic profile Fig. 32.2. As the disease progresses, they develop characteristics similar to those observed in septic shock (low systemic vascular resistance, high cardiac output, tachycardia, hypotension, and high mixed venous oxygen saturation of hemoglobin). Eventually (phase 4 and 5) [20], the hemodynamic status becomes very unstable and high doses of vasopressors are required for patient survival.
It is not unusual to observe pulmonary edema [51]. Most often, it is noncardiogenic in origin but in patients with viral etiology of ALF, myocarditis may cause cardiac failure and pulmonary edema. ST segment elevation on ECG is a rare occurrence and is observed without the presence of elevated myocardial enzymes levels (CPK) and abnormalities in serum electrolytes [52]. It is possible that increased intracranial pressure may cause ST segment elevation and be misinterpreted for myocardial ischemia.
Cardiac arrhythmias (supraventricular tachycardia, sinus bradycardia, premature ventricular contraction, and premature arterial contractions) are commonly seen in acute liver failure cases [53]. The etiology is not always known. However, viral myocarditis, accumulation of bilirubin, bile acids, acid-base and electrolyte imbalance and potentially other toxic metabolites may be the possible cause of the majority of arrhythmias. Sinus bradycardia in conjunction with episodic systemic hypertension (Cushing’s phenomenon) is a sign of impending brain herniation.
In addition to cardiac changes, there is tissue hypoxia in the presence of adequate oxygen delivery as demonstrated by high oxygen saturation in mixed venous blood and high serum lactate level [54].
Respiratory System
Patients often hyperventilate and develop a respiratory alkalosis before a metabolic acidosis as liver failure progresses [10]. Arterial hypoxemia is of common occurrence, especially when patients are in grade 3 and 4 coma. The etiology of hypoxemia appears to be multifactorial: The risk of (1) Aspiration of gastric contents due to loss of airway reflexes from progressive encephalopathy requires airway protection in early grades of coma, (2) Atelectasis from shallow rapid breathing provides potential foci for pulmonary infection and pneumonia, (3) Intrapulmonary shunting, (4) Pulmonary edema which, in these instances, is usually non cardiogenic in origin. It is normally associated with generalized capillary membrane leak and, therefore, can be part of the same phenomenon [55, 56]. However, these patients also have a potential for neurogenic pulmonary edema, especially in the phase of cerebral decomposition.
Renal System
Since acute tubular necrosis (ATN) is the most common cause of renal failure (reported incidence varying from 40 to 85 %, It is often multifactorial, with prerenal azotemia, renal ischemia, acute tubular necrosis, and hepatorenal syndrome as common causes [57, 58]. Avoidance of nephrotoxins and adequate intravascular volume is important in maintaining renal function.
Hepatic Metabolism
The liver is the primary site for carbohydrate metabolism. Therefore, as the liver fails acutely, patients develop hypoglycemia caused by depletion of glycogen stores and decreased gluconeogenesis. Monitoring of blood glucose level is important as the glucose levels can fall to life threatening levels in a very short period of time [59, 60]. Upper GI bleeding is a recognized complication and is often stress related. Histamine-2 receptor blocking agents and proton pump inhibitors have been shown to be efficacious in several trials [61].
Many clinicians believe that it is important to determine the extent of hepatic necrosis by either open liver biopsy or by transjugular biopsy. Transjugular biopsy of the liver is a relatively noninvasive technique and is performed under radiological guidance. It is a very useful technique and provides significant information [23, 62–64]. The one disadvantage of this technique is that since ALF may involve the liver in a heterogeneous way, there may be significant sample variability [65]. The liver biopsy information coupled with the patient’s clinical information and status should be evaluated continually in order to decide indications for transplant. Although a liver biopsy at the time of transplant can be made intra-operatively at the time of an available liver donor, ideally this decision is made before bringing the patient to the operating room.
Coagulation System
The primary hematologic derangements seen in ALF include platelet dysfunction and thrombocytopenia, reduced fibrinogen, and a prolonged prothrombin time [5, 61]. Because the liver is the primary site for the synthesis of coagulation factors (factor V, VII, IX, and X; partially factor VIII, XI, and XII), it is not surprising to see severe coagulopathy in patients with acute liver failure. Antithrombin III (AT III), a major inhibitor of coagulation, is also decreased. Out of all the coagulation factors, factor V decreases most rapidly followed by factor II, IX, and X. In contrast to other factors, factor VIII is increased, however the etiology of its increase is unknown [66].
Coagulopathy can be assessed using conventional coagulation profile (prothrombin time, partial thromboplastin time, serum fibrinogen level, fibrinogen degradation products, and platelet count) and/or by thromboelastography (TEG) .
Prothrombin time is greatly increased when acute liver failure is caused by a paracetamol overdose as opposed to viral hepatitis [67]. The prothrombin time (PT) is used as a prognostic indicator as well as a way to follow the progress of the liver injury and correction of the PT is not routinely done unless there is clinical bleeding or an invasive procedure is planned [68].
Electrolyte and the Acid–Base State
Electrolyte imbalance is common. Hypernatremia is often seen because of (1) renal dysfunction and (2) use of sodium bicarbonate to treat metabolic acidosis. Hypernatremia is difficult to treat and, its presence can be a factor in potentiating cerebral swelling [58]. Hyponatremia , although rare, requires extreme caution as rapid correction of serum sodium levels can predispose the patient for central pontine mylenolysis. Hyponatremia can also promote cerebral swelling. Hyperkalemia may be seen in the presence of renal failure. Ionized hypocalcemia and hypomagnesemia are rarely present. Metabolic acidosis is invariably present. The magnitude of acidosis depends on tissue perfusion, hepatic necrosis, and core body temperature. It is imperative to correct metabolic acidosis in order to avoid adverse effects on heart and brain. Hyperosmolarity is commonly seen in acute liver failure, which can be from hypernatremia. Presence of hyperosmolality hinders the beneficial effects of mannitol on the brain.
Management of Acute Liver Failure
The key for success in this group of patients is a team approach of dedicated anesthesiologists, gastroenterologists, intensivists, and surgeons. The gastroenterologist should take the responsibility of educating the physicians in local hospitals to identify these patients early in the course of illness and transfer them to a liver intensive care unit.
As the patient is referred, the team of physician must be alerted and work distributed, which includes: arrangement for CT scanner for CBF studies, placement of PA catheter, jugular bulb catheter, and endotracheal intubation if needed. After the preliminary examination is completed and monitoring is established, the management plan must be discussed. Since this is a multi organ disease, the management has to be focused on all the affected organs and the combined effect of multiorgan dysfunction. Evaluation of etiology of disease and decision regarding transplantation status also must occur concurrently.
Central Nervous System (Fig. 32.2)
In phase 1, the brain is in the flat portion of the pressure–volume curve (compliant), and the supply (CBF) and demand (CMRO2) are coupled. Airway protection should be determined based on clinical indications. In phase 2, the brain is still in the flat portion of the pressure–volume curve. However, there is an uncoupling between the supply (CBF) and demand (CMRO2). Mild hyperventilation is required to correct this. In phase 3, the patient is at the knee of the pressure–volume curve and has absolute hyperemia; ICP increases and there may be cerebral swelling. In this phase patient’s head of the bed should be raised 30° so that there is a gravity support in reducing ICP [69, 70]. In this phase aggressive treatment with a combination of mild hypothermia (33–34 °C) [71, 72], hyperventilation [73–75] and diuretics [61] and barbiturate infusion [76] may be required. Furosamide is effective in reducing cerebral swelling especially when combined with mannitol. Caution must be observed in using mannitol by itself, as these patients may have serum osmolality >320, at which level the mannitol may not be very effective and secondly, the initial response to mannitol may be further cerebral vasodilation, increase in CBF and increase in ICP. Barbiturates are very effective in reducing intracranial hypertension by causing cerebral vasoconstriction and thereby reducing CBF [76]. However, barbiturates also reduce systemic arterial pressure especially in the presence of hyovolemia. If systemic hypotension develops during barbiturate infusion, vasopressors or fluid must be infused promptly to avoid hypotension. Systemic hypotension is counterproductive in producing the desired effect of barbiturate on ICP. As a matter of fact, ICP may increase further as shown in a TCD tracing of a patient with acute liver failure (Fig. 32.5).
Hypothermia is an effective mode of treatment in reducing CBF and, thereby, reducing the intracranial pressure [72]. It has been shown that mild hypothermia (32–34 °C) is effective. Caution is advised during the cooling process because the temperature may drop to a level below the target point, when there is a propensity for the occurrence of cardiac arrhythmias [77]. The advantage of this temperature zone (32–34 °C), is that cardiac arrhythmias are seldom seen at this level of body temperature. The possible mechanisms of reduction of ICP by hypothermia may be a combination of: (1) reduction in uptake of ammonia by the brain [78, 79]; (2) reduction in inflammatory response [80–83]; (3) reduction in both active and basal metabolism of the brain thereby causing reflex vasoconstriction; and (4) direct cerebral vasoconstriction.
Phase 4 management is crucial. During this phase ICP is extremely high and the CBF is low. In this phase, because of the reduced compliance of the brain, all the treatment modalities mentioned above are needed—only more frequently. In phase 3 and 4, every effort should be made to replace the native liver as soon as possible [20].
Related posts:
 Preoperative Evaluation and Preparation for Lung Transplantation
Anesthesia and Intraoperative Management of Renal Transplantation
Preoperative Evaluation and Preparation for Lung Transplantation
Anesthesia and Intraoperative Management of Renal Transplantation
 Intensive Care of the Deceased Multiorgan Donor: One Donor, Nine Lives
 Preoperative Liver Recipient Evaluation and Preparation
 Technical Innovation and Visceral Transplantation
Postoperative Care of Heart Transplant Patients
Technical Innovation and Visceral Transplantation
Postoperative Care of Heart Transplant Patients
Stay updated, free articles. Join our Telegram channel

Full access? Get Clinical Tree


