The purpose of monitoring equipment is to augment the situational awareness of the anesthesiologist by providing clinical data either more rapidly than can be achieved manually or more precisely than can be achieved by direct examination of the patient. The value of any particular monitoring technique lies in its ability to inform the practice of the anesthesiologist so that the patient’s physiologic condition can be maintained within satisfactory parameters. No monitoring technique, however sophisticated, can substitute for the judgment of the anesthesiologist.
 It is mandatory to measure inspired oxygen concentration for patients receiving general anesthesia to prevent the inadvertent administration of a hypoxic gas mixture. However, inspired oxygen concentration monitoring cannot reliably detect disconnection of the circuit, nor does it guarantee adequate arterial oxygenation.
 Pulse oximetry provides a noninvasive means to detect the onset of hypoxemia rapidly. Modern pulse oximeters are noninvasive, continuous, autocalibrating, have quick response times and are suitable for use during transport. However, pulse oximetry is a poor indicator of adequate ventilation; desaturation is a late sign of apnea or respiratory insufficiency.
 Monitoring of expired carbon dioxide is now recommended for procedures involving moderate to deep sedation, in addition to procedures performed under general anesthesia. Advances in infrared absorption spectroscopy have led to the production of conveniently portable devices for expired gas analysis.
 During direct invasive arterial pressure monitoring, the fidelity of the system is optimized when the catheter and tubing are stiff, the mass of the fluid is small, and the length of the connecting tubing is not excessive.
 Automated noninvasive blood pressure monitors use the oscillometric method to estimate arterial blood pressure. Pulsatile flow generates oscillations in the internal pressure of an inflated blood pressure cuff; these oscillations are greatest when the cuff is inflated to mean arterial pressure. During prolonged surgical cases, it may be prudent to relocate the blood pressure cuff every few hours to reduce the risk of neurapraxia or cutaneous injury.
 On the basis of available evidence, it is difficult to draw meaningful conclusions regarding the effectiveness of pulmonary artery catheter (PAC) monitoring in reducing morbidity and mortality in critically ill patients. Expert opinion suggests that perioperative complications may be reduced if PACs are used in the appropriate patients and settings, and if clinicians interpret and apply the data provided by the PAC correctly. New, noninvasive devices have been developed to generate similar cardiac output parameters to the PAC, as well as potentially to be able to predict fluid responsiveness. However, certain common comorbidities can impair the accuracy of these devices; the PAC thermodilution technique remains the clinical gold standard for measuring cardiac output.
 Clinical studies have demonstrated that patients in whom intraoperative hypothermia develops are at a higher risk for development of postoperative myocardial ischemia and wound infection compared with patients who are normothermic in the perioperative period. Although liquid crystal skin temperature strips are convenient to apply, they do not correlate well with core temperature measurements.
 Although the algorithms used by processed EEG monitors are proprietary, the general features of the EEG that they use are well described. Processed EEG monitors have not been demonstrated to be superior to end-tidal agent concentration monitoring in the prevention of awareness under anesthesia, although neither technique is sufficient to avoid awareness with complete reliability.
 The advent of “smarter” and more technically sophisticated monitoring devices does not relieve the anesthesiologist of their obligation to employ their clinical judgment wisely. On the contrary, it requires the anesthesiologist to understand the operation of these devices intimately so that they can be used safely, accurately, and appropriately.
Multimedia
 Oximetry
 Galvanic Oxygen Analyzers
 Capnogram
 Cardiac Oscillation
 Arterial Line Tracing
 Arterial Line Insertion
 Ultrasound Guided Radial Artery Cannulation
 Transducer
 Arterial Line Infection
 Arterial Line Complications
 NIBP Oscillations
 Swan Pressure Tracing
 Swan Real Life
 CVP Waveforms
 Ultrasound Guided IJ Insertion
 Thermodilution Cardiac Output
 Respiratory Variation
INTRODUCTION
Historically, the foundation of anesthesia practice has been vigilance and ongoing clinical examination of the patient. The development of modern monitoring equipment does not replace these responsibilities. Automated monitoring equipment provides the anesthesiologist with the ability to acquire clinical information either more rapidly or frequently than can be achieved through manual techniques, or in a more quantitatively precise manner than can be achieved by physical examination alone. The purpose of monitoring equipment, then, is to augment the situational awareness of the anesthesiologist so that clinical problems can be recognized and addressed in a timely manner, and to guide treatment. The value of any particular monitoring technique lies in its ability to inform the practice of the anesthesiologist so that the patient’s physiologic condition can be maintained within satisfactory parameters . The term itself is derived from monere, which in Latin means to warn, remind, or admonish.
This chapter discusses the methods and biomedical devices through which anesthesiologists monitor the physiologic state of the patient during anesthesia care. The principles of operation for each of these devices are explained. These explanations are, by necessity, simplified as the actual design of a biomedical device involves significant engineering complexity. However, the explanations are intended to be sufficient to allow the anesthesiologist to understand how the device acquires its clinical data, and to understand how that process might be compromised and the data made erroneous; to understand how the device works, and how it may fail. There is little high-grade evidence that electronic monitors, by themselves, reduce morbidity and mortality. There is also controversy regarding the need for specific monitors in certain clinical situations, particularly where use of the monitor in question may add significant cost, or where the invasiveness of the monitoring technique may place the patient at risk of iatrogenic complications. Against these costs and risks, the anesthesiologist must balance the likely benefit from a particular monitoring technique, when used and interpreted correctly. Therefore, alongside the science and engineering aspects of monitoring, there is also the clinical art of choosing how a patient should best be monitored intraoperatively. For each of the monitoring techniques, relative indications, contraindications, and common technical problems are discussed.
Standards for basic anesthetic monitoring have been established by the American Society of Anesthesiologists (ASA). Since 1986, these standards have emphasized the evolution of technology and practice. The current standards (which became effective on July 1, 2011) emphasize the importance of regular and frequent measurements, integration of clinical judgment and experience, and the potential for extenuating circumstances that can influence the applicability or accuracy of monitoring systems.1
Standard I requires qualified personnel to be present in the operating room during general anesthesia, regional anesthesia, and monitored anesthesia care to monitor the patient continuously and modify anesthesia care based on clinical observations and the responses of the patient to dynamic changes resulting from surgery or drug therapy. Standard II focuses attention on continually evaluating the patient’s oxygenation, ventilation, circulation, and temperature. Standard II specifically mandates the following:
1. Use of an inspired oxygen analyzer with a low concentration limit alarm during general anesthesia.
2. Quantitative assessment of blood oxygenation during any anesthesia care.
3. Continuously ensuring the adequacy of ventilation by physical diagnostic techniques during all anesthesia care. Continual identification of expired carbon dioxide is performed unless precluded by the type of patient, procedure, or equipment. Quantitative monitoring of tidal volume and capnography is strongly encouraged in patients undergoing general anesthesia.
4. When administering regional anesthesia or local anesthesia, sufficient ventilation should be assessed by qualitative clinical signs. During moderate or deep sedation, ventilation shall be evaluated by continual assessment of qualitative clinical signs, and also monitoring for the presence of exhaled carbon dioxide unless precluded by the type of patient, procedure, or equipment.
5. Ensuring correct placement of an endotracheal intubation or laryngeal mask airway requires clinical assessment and qualitative identification of carbon dioxide in the expired gas.
6. When using a mechanical ventilator, use of a device that is able to detect a disconnection of any part of the breathing system.
7. The adequacy of circulation should be monitored by the continuous display of the electrocardiogram, and by determining the arterial blood pressure and heart rate at least every 5 minutes. During general anesthesia, circulatory function is to be continually evaluated by at least one of the following: Palpation of a pulse, auscultation of heart sounds, monitoring of a tracing of intra-arterial pressure, ultrasound peripheral pulse monitoring, or pulse plethysmography or oximetry.
8. During all anesthetics, the means for continuously measuring the patient’s temperature must be available. Every patient receiving anesthesia shall have temperature monitored when clinically significant changes in body temperature are intended, anticipated, or suspected.
MONITORING OF INSPIRED OXYGEN CONCENTRATION
Principles of Operation
Oxygen is a highly reactive chemical species, providing many chemical and physical opportunities to detect its presence. Three main types of oxygen analyzers are seen in clinical practice: Paramagnetic oxygen analyzers, galvanic cell analyzers, and polarographic oxygen analyzers.
Paramagnetic gases are attracted to magnetic energy because of unpaired electrons in their outer shell orbits.  Oxygen is a highly paramagnetic gas. Differential paramagnetic oximetry has been incorporated into a variety of operating room monitors. These instruments detect the change in sample line pressure resulting from the attraction of oxygen by switched magnetic fields. Signal changes during electromagnetic switching correlate with the oxygen concentration in the sample line.2
Galvanic cell analyzers meet the performance criteria necessary for operative monitoring. These analyzers measure the current produced when oxygen diffuses across a membrane and is reduced to molecular oxygen at the anode of an electrical circuit.3 The electron flow (current) is proportional to the partial pressure of oxygen in the fuel cell. Galvanic cell analyzers require regular replacement of the galvanic sensor capsule. In the sensor, the electric potential for the reduction of oxygen results from a chemical reaction. Over time, the reactants require replenishment.4
Polarographic oxygen analyzers are commonly used in anesthesia monitoring. In this electrochemical system, oxygen diffuses through an oxygen-permeable polymeric membrane and participates in the following reaction: O2 + 2H2O + 4e− S 4OH−. The current change is proportional to the number of oxygen molecules surrounding the electrode.  Polarographic oxygen sensors are versatile and are important components of gas machine oxygen analyzers, blood gas analyzers, and transcutaneous oxygen analyzers.5
Proper Use and Interpretation
The concentration of oxygen in the anesthetic circuit must be measured . Anesthesia machine manufacturers place oxygen sensors on the inspired limb of the anesthesia circuit to detect and alarm in the event that hypoxic gas mixtures are delivered to the patient. Carbon dioxide may reduce the usable lifetime of a galvanic oxygen sensor, so it is preferable to place the oxygen sensor on the inspired limb. Oxygen monitors require a fast response time (2 to 10 seconds), accuracy (±2% of the actual level), and stability when exposed to humidity and inhalation agents.
The removable, external oxygen sensors seen commonly on anesthesia machines such as the Narkomed and Drager Fabius are of the galvanic type. These devices should be calibrated against room air (FiO2 = 0.21) daily, and also after 8 hours of use. These devices may also infrequently require calibration against FiO2 = 1. As part of the preoperative checkout of the anesthesia machine, the clinician must confirm that the alarm limits of the inspired oxygen analyzer are set appropriately to alert to the presence of hypoxic mixtures. Inspired oxygen alarms cannot be relied upon to detect disconnection of the circuit.
Indications
According to the ASA Standards for Basic Anesthesia Monitoring,1 Standard 2.2.1 states “During every administration of general anesthesia using an anesthesia machine, the concentration of oxygen in the patient breathing system shall be measured by an oxygen analyzer with a low oxygen concentration limit alarm in use.”
The careful monitoring of the inspired oxygen concentration is of particular significance during low-flow anesthesia, in which the anesthesiologist attempts to minimize the fresh gas flow to the amount of oxygen necessary to replace the patient’s metabolic utilization. The gas mixture within the breathing circuit may become hypoxic if insufficient fresh gas flow is supplied, even if the fresh gas flow itself comprises pure oxygen.
Contraindications
This requirement to monitor inspired oxygen concentration may be waived by the responsible anesthesiologist under extenuating circumstances. There are no clinical contraindications to monitoring inspired oxygen concentration.
Common Problems and Limitations
Adequate inspiratory oxygen concentration does not guarantee adequate arterial oxygen concentration.6 Consequently, ASA1 Standard 2.2.2 mandates additional monitoring for blood oxygenation, including the provision of adequate lighting and exposure to assess the patient’s color by direct observation.
MONITORING OF ARTERIAL OXYGENATION BY PULSE OXIMETRY
Principles of Operation
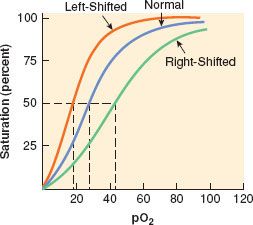
Pulse oximeters measure pulse rate and estimate the oxygen saturation of hemoglobin (Hb; SpO2) on a noninvasive, continuous basis.7 The oxygen saturation of hemoglobin (as a percentage) is related to the oxygen tension (as a partial pressure, mm Hg) by the oxyhemoglobin dissociation curve. On the steep part of the curve, a predictable correlation exists between arterial oxyhemoglobin saturation (SaO2) and partial pressures of oxygen (PaO2). In this range, the SaO2 is a good reflection of the extent of hypoxemia and the changing status of arterial oxygenation. For PaO2 greater than 75 mm Hg, the SaO2 reaches a plateau and no longer reflects changes in PaO2. Coexisting medical conditions, such as hypercapnia, acidosis, and hyperthermia, cause the oxyhemoglobin dissociation curve to shift to the right and decrease the affinity of hemoglobin for oxygen (Fig. 25-1). This favors the unloading of oxygen from hemoglobin to peripheral tissues.
FIGURE 25-1. The oxyhemoglobin dissociation curve. The relationship between arterial saturation of hemoglobin and oxygen tension is represented by the sigmoid-shaped oxyhemoglobin dissociation curve. When the curve is left-shifted, the hemoglobin molecule binds oxygen more tightly. (Reproduced from: Brown M, Vender JS. Noninvasive oxygen monitoring. Crit Care Clin 1988;4:493–509.)
Pulse oximetry is based on the following premises:
1. The color of blood is a function of oxygen saturation.
2. The change in color results from the optical properties of hemoglobin and its interaction with oxygen.
3. The ratio of oxyhemoglobin (HbO2) and hemoglobin (Hb) can be determined by absorption spectrophotometry.
Oxygen saturation is determined by spectrophotometry, which is based on the Beer–Lambert law. At a constant light intensity and hemoglobin concentration, the intensity of light transmitted through a tissue is a logarithmic function of the oxygen saturation of Hb. Two wavelengths of light are required to distinguish HbO2 from Hb. Light-emitting diodes in the pulse sensor emit red (660 nm) and near infrared (940 nm) light. The percentage of HbO2 is determined by measuring the ratio of infrared and red light sensed by a photodetector. Pulse oximeters perform a plethysmographic analysis to differentiate the pulsatile “arterial” signal from the nonpulsatile signal resulting from “venous” absorption and other tissues such as skin, muscle, and bone. The absence of a pulsatile waveform during extreme hypothermia or hypoperfusion can limit the ability of a pulse oximeter to calculate the SpO2.
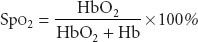
The SpO2 measured by pulse oximetry is not the same as the arterial saturation (SaO2) measured by a laboratory co-oximeter. Pulse oximetry measures the “functional” saturation, which is defined by the following equation:
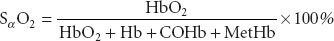
Laboratory co-oximeters use multiple wavelengths to distinguish other types of Hb, such as carboxyhemoglobin (COHb) and methemoglobin (MetHb) by their characteristic absorption. Co-oximeters measure the “fractional” saturation, which is defined by the following equation:
In clinical circumstances where other Hb moieties are present, the SpO2 measurement may not correlate with the actual SaO2 reported by the blood gas laboratory. For example, MetHb absorbs red and infrared wavelengths of light in a 1:1 ratio corresponding to an SpO2 of approximately 85%. Therefore, increases in MetHb produce an underestimation when SpO2 >70% and an overestimation when SpO2 <70%. Similarly, COHb also produces artificially high and misleading results; one study showed that at 70% COHb, the SpO2 still measured 90%. In most patients, MetHb and COHb are present in low concentrations so that the functional saturation approximates the fractional value.9
Proper Use and Interpretation
The assessment of arterial oxygenation is an integral part of anesthesia practice. Early detection and prompt intervention may limit serious sequelae of hypoxemia. The clinical signs associated with hypoxemia (e.g., tachycardia, altered mental status, cyanosis) are often masked or difficult to appreciate during anesthesia.
The appropriate use of pulse oximetry necessitates an appreciation of both physiologic and technical limitations. Despite the numerous clinical benefits of pulse oximetry, other factors affect its accuracy and reliability. Factors that may be present during anesthesia care and that affect the accuracy and reliability of pulse oximetry include dyshemoglobins, dyes (methylene blue, indocyanine green, and indigo carmine), nail polish, ambient light, light-emitting diode variability, motion artifact, and background noise. Electrocautery can interfere with pulse oximetry if the radiofrequency emissions are sensed by the photodetector. Surgical stereotactic positioning systems that make use of infrared position sensors may interfere with the infrared signals used by the pulse oximeter. Reports of burns or pressure necrosis exist but are infrequent. Inspecting the digits during monitoring can reduce these complications.
Recent developments in pulse oximetry technology reportedly may permit more accurate measurements of SpO2 during patient movement, low-perfusion conditions, and in the presence of dyshemoglobins. Some of these instruments use complex signal processing of the two wavelengths of light to improve the signal-to-noise ratio and reject artifact. Studies in volunteers suggest that the performance of pulse oximeters incorporating this technology is superior to conventional oximetry during motion of the hand, hypoperfusion, and hypothermia.10,11 Other pulse oximetry devices incorporate eight wavelengths of light to more accurately measure COHb and MetHb.9
Indications
Pulse oximetry has been used in all patient age groups to detect and prevent hypoxemia. The clinical benefits of pulse oximetry are enhanced by its simplicity. Modern pulse oximeters are noninvasive, continuous, and autocalibrating. They have quick response times and their battery backup provides monitoring during transport . The clinical accuracy is typically reported to be within ±2% to 3% at 70% to 100% saturation and ±3% at 50% to 70% saturation. Published data from numerous investigations support accuracy and precision reported by instrument manufacturers. Quantitative assessment of arterial oxygen saturation is mandated by the ASA monitoring standards,1 and the convenience and safety of pulse oximetry has supplanted earlier techniques such as heated transcutaneous pO2 electrodes.12
Pulse oximetry has wide applicability in many hospital and nonhospital settings. However, there are no definitive data demonstrating a reduction in morbidity or mortality associated with the advent of pulse oximetry. An older large randomized trial did not detect a significant difference in postoperative complications when routine pulse oximetry was used.13 However, a reduction of anesthesia mortality, as well as fewer malpractice claims from respiratory events, coincident with the introduction of pulse oximeters suggests that the routine use of these devices may have been a contributing factor.
Contraindications
There are no clinical contraindications to monitoring arterial oxygen saturation with pulse oximetry.
Common Problems and Limitations
Arterial oxygen monitors do not ensure adequacy of oxygen delivery to, or utilization by peripheral tissues and should not be considered a replacement for arterial blood gas measurements or mixed central venous oxygen saturation when more definitive information regarding oxygen supply and utilization is required.
Unless the patient is in breathing room air, pulse oximetry is a poor indicator of adequate ventilation; patients who have been breathing 100% FiO2 may be apneic for several minutes before desaturation is detected by the pulse oximeter. Once the PAO2 has fallen sufficiently to cause a detectable decrease in SpO2, further desaturation may occur precipitously once the steep part of the HbO2 dissociation curve is reached.
MONITORING OF EXPIRED GASES
Principles of Operation
The patient’s expired gas is likely to be composed of a mixture of oxygen (O2), nitrogen (N2), carbon dioxide (CO2), and anesthetic gases such as nitrous oxide (N2O) and highly potent halogenated agents (sevoflurane, isoflurane, or desflurane). Anesthesiologists have long sought to measure the composition of expired gases noninvasively and in real time; these measurements can provide vital information regarding the patient’s respiratory condition and assist in the titration of volatile anesthetic agents.
In 1972, White and Wardley-Smith14 described the construction of a simple detector of anesthetic gases. Anesthetic gases will tend to partition into silicone rubber, changing the elastic properties of the rubber. A mechanical device can be constructed to maintain silicone rubber strips under light tension; this device is attached to the expiratory limb of the anesthesia circuit so that the strips are exposed to the patient’s expired gases. As the concentration of anesthetic gas rises, the length of the strips will change proportionally, and a mechanical linkage to a pointer on a gauge can display this change. Although the practical shortcomings of such a device are obvious from a contemporary viewpoint, this is only evidence of how much biomedical engineering sophistication has been applied to this important problem in the intervening 40 years. For instance, the response time of this simple device would be expected to be very slow. However, if piezoelectric crystals are coated with a layer of lipid, the concentration of anesthetic gases can be detected by changes in the resonant frequency of the crystal as anesthetic gases partition into the lipid coating. This idea makes use of the same physical behavior of anesthetic gases, but evolved in its implementation so that the response time is now sufficient to detect inspired, expired, and breath-to-breath changes in anesthetic gas concentrations.15 Nevertheless, this new device is still significantly limited by its inability to identify the gas it is detecting and by its inability to work with mixtures of different gases.
Mass spectrometry systems and Raman scattering devices addressed these shortcomings. Mass spectroscopy systems obtain a sample of expired gas, and bombard this gas mixture with electrons, creating ion fragments of a predictable mass and charge. These fragments are accelerated in a vacuum. A sample of this mixture enters a measurement chamber, where the fragment stream is subjected to a high magnetic field. The magnetic field separates the fragments by their mass and charge. The fragments are deflected onto a detector plate, and each gas has a specific landing site on the detector plate. The ion impacts are proportional to the concentration of the parent gas or vapor. The processor section of the mass spectrometer system calculates the concentration of the gases of interest. Mass spectrometers are large devices and were often multiplexed—that is, connected to multiple patients, taking expired gas samples from each in turn.16
Raman scattering results when photons generated by a high-intensity argon laser collide with gas molecules. The scattered photons are measured as peaks in a spectrum that determine the concentration and composition of respiratory gases and inhaled vapors. O2, N2, N2O, CO2, H2O vapors and inhaled anesthetic agents are all simultaneously measurable using Raman scattering.17
Infrared absorption spectrophotometry (IRAS) gas analysis devices have now supplanted all of these earlier measurement techniques in clinical practice. Asymmetric, polyatomic molecules like CO2 absorb infrared light at specific wavelengths. By transmitting light through a pure sample of a gas over the range of infrared frequencies, a unique infrared transmission spectrum (like a fingerprint) can be created for the gas (Fig. 25-2).
FIGURE 25-2. Gaseous phase infrared transmission spectrum for carbon dioxide and nitrous oxide. Modified from the National Institute of Standards and Technology (http://www.nist.gov); and Craver CD, Coblentz Society. The Coblentz Society desk book of infrared spectra. 2nd ed. Kirwood, MO (P.O. Box 9952, Kirkwood 63122): The Society; 1982.
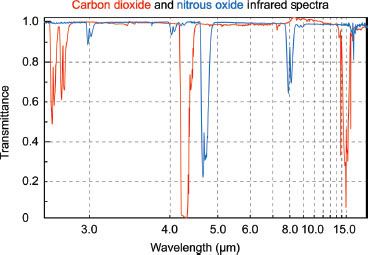
CO2 strongly absorbs infrared light with a wavelength of 4.3 microns. At this wavelength there is minimal interference from other gases that may also be present, such as water vapor, oxygen, nitrous oxide, and inhaled anesthetic agents. Infrared light at this wavelength can be passed through a sample of gas to an infrared detector. As the concentration of carbon dioxide increases, the intensity of the light that reaches the detector decreases, in accordance with the Beer–Lambert law.
IRAS devices have five components: A multiple-wavelength infrared light source, a gas sampler, an optical path, a detection system, and a signal processor. Operating room IRAS devices can detect CO2, N2O, and the potent inhaled anesthetic agents as mixed together in a sample of the patient’s expired gas. The gas mixture is passed through the optical path of multiple infrared beams whose wavelengths are chosen to correspond to key features in the transmission spectra of the gases of interest. By analyzing the combination of absorption of infrared light at these wavelengths, the presence and concentrations of all of these gases can be determined simultaneously.19 The use of multiple wavelengths allows the gases to be identified automatically. Older IRAS devices used a hot electrical element to generate radiant infrared light over a broad range of wavelengths. An optical filter wheel was then used to cut out all but the desired wavelengths. Contemporary devices make use of small lasers and filters, designed such that they emit only at the desired wavelengths. This approach consumes much less electrical power, is physically less heavy and has led to the development of conveniently portable handheld gas analyzers.20
Proper Use and Interpretation
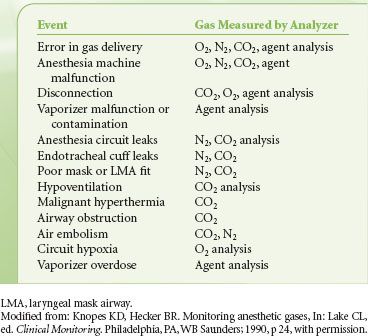
Expired gas analysis allows the clinician to monitor inspired and expired concentrations of carbon dioxide and anesthetic gases simultaneously. These measurements require separate clinical interpretation. Critical events that can be detected by the analysis of respiratory gases and anesthetic vapors are listed in Table 25-1.
TABLE 25-1. DETECTION OF CRITICAL EVENTS BY IMPLEMENTING GAS ANALYSIS
Interpretation of Inspired and Expired Carbon Dioxide Concentrations
Capnometry is the measurement and numeric representation of the CO2 concentration during inspiration and expiration. A capnogram is a continuous concentration–time display of the CO2 concentration sampled at a patient’s airway during ventilation. The capnogram is divided into four distinct phases (Fig. 25-3)  .
.
FIGURE 25-3. The normal capnogram. Point D delineates the end-tidal CO2 (ETCO2). ETCO2 is the best reflection of the alveolar CO2 partial pressure. See text for discussion of the curve.
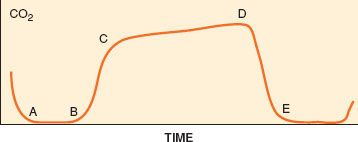
The first phase (A–B) represents the initial stage of expiration. Gas sampled during this phase occupies the anatomic dead space and is normally devoid of CO2. At point B, CO2-containing gas presents itself at the sampling site, and a sharp upstroke (B–C) is seen in the capnogram. The slope of this upstroke is determined by the evenness of expiratory ventilation and alveolar emptying. Phase C–D represents the alveolar or expiratory plateau. At this phase of the capnogram, alveolar gas is being sampled. Normally, this part of the waveform is almost horizontal. However, when ventilation and perfusion are mismatched, Phase C–D may take an upward slope. Point D is the highest CO2 value and is called the end-tidal CO2 (ETCO2). ETCO2 is the best reflection of the alveolar CO2 (PACO2). As the patient begins to inspire, fresh gas is entrained and there is a steep downstroke (D–E) back to baseline. Unless rebreathing of CO2 occurs, the baseline approaches zero. If the PACO2–PaCO2 gradient is constant and small, capnography provides a noninvasive, continuous, real-time reflection of ventilation. The ETCO2–PaCO2 gradient typically is around 5 mm Hg during routine general anesthesia in otherwise healthy, supine patients.
The size and shape of the capnogram waveform can provide additional clinical information.21 A slow rate of rise of the second phase (B–C) is suggestive of either chronic obstructive pulmonary disease or acute airway obstruction as from bronchoconstriction (asthma) secondary to mismatch in alveolar ventilation and alveolar perfusion. A normally shaped capnogram with an increase in ETCO2 suggests alveolar hypoventilation or an increase in CO2 production. Transient increases in ETCO2 are often observed during tourniquet release, aortic unclamping, or the administration of bicarbonate.
Capnography is an essential element in determining the appropriate placement of endotracheal tubes. The presence of a stable ETCO2 for three successive breaths indicates that the tube is not in the esophagus. A continuous, stable CO2 waveform ensures the presence of alveolar ventilation but does not necessarily indicate that the endotracheal tube is properly positioned in the trachea. An endobronchial intuition, in which the tip of the tube is located in a main stem bronchus, cannot be ruled out until breath sounds are auscultated bilaterally. A continuous CO2 tracing also does not guarantee that the endotracheal tube is placed securely; an endotracheal tube placed proximally to the vocal cords may still produce an otherwise satisfactory tracing until it becomes dislodged.
A sudden drop in ETCO2 to near zero followed by the absence of a CO2 waveform heralds a potentially life-threatening problem that could indicate malposition of an endotracheal tube into the pharynx or esophagus, sudden severe hypotension, massive pulmonary embolism, a cardiac arrest, or a disconnection or disruption of sampling lines. When a sudden drop of the ETCO2 occurs, it is essential to quickly verify that there is pulmonary ventilation and to identify physiologic and mechanical factors that might account for then ETCO2 of zero. During life-saving cardiopulmonary resuscitation, the generation of adequate circulation can be assessed by the restoration of the CO2 waveform.
Whereas abrupt decreases in the ETCO2 are often associated with an altered cardiopulmonary status (e.g., embolism or hypoperfusion), gradual reductions in ETCO2 more often reflect decreases in PaCO2 that occur when there exists an imbalance between minute ventilation and metabolic rate (i.e., CO2 production), as commonly occurs during anesthesia at a fixed minute ventilation. Increases in ETCO2 can be expected when CO2 production exceeds ventilation, such as in hyperthermia or when an exogenous source of CO2 is present. Capnographic waveforms that do not return to zero during inspiration indicate rebreathing of carbon dioxide. This can occur if the carbon dioxide absorber in an anesthesia machine is chemically exhausted if a valve in the ventilator circuit is not functioning properly, or if the flow of fresh gas is insufficient. An elevated baseline can also be seen if the device is calibrated incorrectly.
Alterations in ventilation, cardiac output (CO), distribution of pulmonary blood flow and metabolic activity influence ETCO2 concentration and the capnogram obtained during quantitative expired gas analysis. Table 25-2 summarizes the common elements that may be reflected by changes in ETCO2 during anesthesia care.
TABLE 25-2. FACTORS THAT MAY CHANGE END-TIDAL CO2 (ETCO2) DURING ANESTHESIA

Interpretation of Inspired and Expired Anesthetic Gas Concentrations
Monitoring the concentration of expired anesthetic gases assists the anesthesiologist in titrating those gases to the clinical circumstances of the patient. At high fresh gas flow rates, the concentration of an anesthetic gas in a circle breathing system will approximate the concentration set on the vaporizer. However, high fresh gas flow rates leads to wasteful use of anesthetic vapor. As the fresh gas flow rate is lowered, the concentration within the circuit and the concentration set at the vaporizer can become more decoupled. Inspired and expired gas concentration monitoring allows the anesthesiologist to maintain satisfactory and well-controlled agent levels in the circuit even when extremely low fresh gas flows are used. In an ideal, leak-free anesthesia system, the fresh gas flow can be minimized to only the amount of pure oxygen necessary to replace the patient’s metabolic utilization—a practice known as “closed-circuit anesthesia.” This practice makes the most economic use of anesthetic vapor.22
Anesthetic gases have differing potencies, and so their concentrations are often normalized against the concentration of that agent required to produce a predetermined clinical endpoint. The most commonly used endpoint is the MAC value, defined as the end-tidal gas concentration that when maintained constant for 15 minutes at a pressure of 1 atmosphere inhibits movement in response to a midline laparotomy incision in 50% of patients.23,24 Historically, MAC is an acronym of minimum alveolar concentration, although it is more accurately a median constant end-tidal partial pressure. Monitoring of end-tidal gas concentrations performed with reference to MAC values helps to prevent the occurrence of intraoperative awareness and in some studies was superior to the use of processed EEG monitors.25
Indications
Monitoring of the partial pressure of expiratory CO2 has evolved into an important physiologic and safety monitor. Capnography is the standard of care for monitoring the adequacy of ventilation in patients receiving general anesthesia. It is also now mandated for use to monitor ventilation during procedures performed while the patient is under moderate or deep sedation.1
Contraindications
There are no contraindications to the use of capnography, provided that the data obtained are evaluated in the context of the patient’s clinical circumstances. It is generally safe to use capnography for the monitoring of all patients.
Monitoring of expired anesthetic gases is only informative if detectable gases are used to maintain anesthesia. Infrared spectroscopy cannot detect Xenon, and is not informative if anesthesia is maintained using a total intravenous technique.
 Common Problems and Limitations
The sampling lines or water traps of expired gas analyzers may become occluded with condensed water vapor during prolonged use. Disconnecting the sampling line and flushing it with air from a syringe can sometimes clear it, but it may be necessary to replace these components. Elevating the sidestream sampling line above the ventilator circuit helps prevent the entry of condensed water. A humidity barrier is also useful, although this will increase the response time of the capnogram.
Although mass spectroscopy and Raman scattering are no longer seen in clinical practice, these technologies are able to detect the concentration of N2 directly. Nitrogen monitoring provides quantification of washout during preoxygenation. A sudden rise in N2 in the exhaled gas indicates either introduction of air from leaks in the anesthesia delivery system or venous air embolism. Infrared gas analyzers do not detect N2 directly, and its concentration must be inferred as the amount remaining after other measurable gases are accounted for.
Although capnography provides a quantitative measurement of ETCO2, it is not as accurate as blood gas analysis for the assessment of the partial pressure of arterial carbon dioxide. A gradient exists between the partial pressure of arterial carbon dioxide and ETCO2; this gradient increases as the dead-space volume increases. In disease states characterized by increased dead space and ventilation–perfusion mismatch, such as emphysema or pulmonary embolism, or in iatrogenic single lung ventilation, an arterial blood gas analysis is necessary for an accurate determination of the partial pressure of arterial carbon dioxide.
INVASIVE MONITORING OF SYSTEMIC BLOOD PRESSURE
Principles of Operation
Indwelling arterial cannulation permits the opportunity to monitor arterial blood pressure continuously and to have vascular access for arterial blood sampling.  Intra-arterial blood pressure monitoring uses fluid-filled tubing to transmit the force of the pressure pulse wave to a pressure transducer that converts the displacement of a silicon crystal into voltage changes. These electrical signals are amplified, filtered, and displayed as the arterial pressure trace. Intra-arterial pressure transducing systems are subject to many potential errors based on the physical properties of fluid motion and the performance of the catheter–transducer–amplification system used to sense, process, and display the pressure pulse wave.
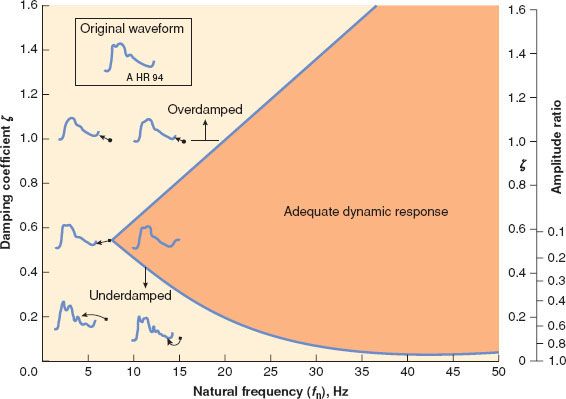
The behavior of transducers, fluid couplings, signal amplification, and display systems can be described by a complex second-order differential equation. Solving the equation predicts the output and characterizes the fidelity of the system’s ability to faithfully display and estimate the arterial pressure over time. The fidelity of fluid-coupled transducing systems is constrained by two properties: Damping (ζ) and natural frequency (fn). Zeta (ζ) describes the tendency for fluid in the measuring system to extinguish motion, and fn describes the frequency at which the measuring system is most prone to resonance. The fidelity of the transduced pressure depends on optimizing ζ and fn so that the system can respond appropriately to the range of frequencies contained in the pressure pulse wave. Analysis of high-fidelity recordings of arterial blood pressure indicates that the pressure trace contains frequencies from 1 to 30 Hz. The “fast flush” test is a method used at the bedside to determine the natural frequency and damping characteristics of the transducing system. This test examines the characteristics of the resonant waves recorded after the release of a flush. Damping is estimated by the amplitude ratio of the first pair of resonant waves and the natural frequency is estimated by dividing the tracing speed by the interval cycle.26
Proper Use and Interpretation
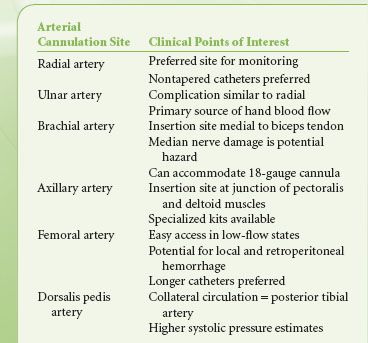
Multiple arteries can be used for direct measurement of blood pressure, including the radial, brachial, axillary, femoral, and dorsalis pedis arteries (Table 25-3). The radial artery remains the most popular site for cannulation because of its accessibility and the presence of a collateral blood supply. In the past, assessment of the patency of the ulnar circulation by performance of an Allen test has been recommended before cannulation. An Allen test is performed by compressing both radial and ulnar arteries while the patient tightens his or her fist. Releasing pressure on each respective artery determines the dominant vessel supplying blood to the hand. The prognostic value of the Allen test in assessing the adequacy of the collateral circulation has not been confirmed.27,28
TABLE 25-3. ARTERIAL CANNULATION AND DIRECT BLOOD PRESSURE MONITORING
Three techniques for cannulation are common: Direct arterial puncture, guidewire-assisted cannulation (Seldinger technique), and the transfixion–withdrawal method  .29 A necessary condition for percutaneous placement is identification of the arterial pulse, which may be enhanced by a Doppler flow detection device in patients with poor peripheral pulses.30
  Ultrasound imaging with Doppler color flowmetry can provide valuable further assistance when the pulse is difficult to locate or the caliber of the vessel appears to be small.31
Arterial blood pressure transduction systems must be “zeroed” before use. The  transducer is positioned at the same level as the right atrium, the stopcock is opened to the atmosphere so that pressure-sensing crystal senses only atmospheric pressure, and the “Zero Sensor” (or equivalent) option is selected on the monitoring equipment. This procedure establishes the calibration of the sensor and establishes the level of the right atrium as the datum reference point. For neurosurgical procedures in which the patient may be positioned in an upright or beach-chair position, it is a common practice to zero the transducer at the level of the Circle of Willis so that the arterial pressure tracing provides a reading that is adjusted for the height of the fluid column between the heart and the brain; it represents the arterial pressure at the base of the brain.
Direct arterial pressure monitoring requires constant vigilance. The data displayed must correlate with clinical conditions before therapeutic interventions are initiated. Sudden increases in the transduced blood pressure may represent a hydrostatic error because the position of the transducer was not adjusted after change in the operating room table’s height. Sudden decreases often result from kinking of the catheter or tubing. Before initiating therapy, the transducer system should be examined quickly and the patency of the arterial cannula verified. This ensures the accuracy of the measurement and avoids the initiation of a potentially dangerous medication error.
Traumatic cannulation has been associated with hematoma formation, thrombosis, and damage to adjacent nerves  . Abnormal radial artery blood flow after catheter removal occurs frequently. Studies suggest that blood flow normalizes in 3 to 70 days. Radial artery thrombosis can be minimized by using small catheters, avoiding polypropylene-tapered catheters, and reducing the duration of arterial cannulation. Flexible guidewires may reduce the potential trauma associated with catheters negotiating tortuous vessels. After arterial cannulation has been performed, the tissues that are perfused by that artery should be examined intermittently for signs of thromboembolism or ischemia. During cannula removal, the potential for thromboembolism may be diminished by compressing the proximal and distal arterial segment while aspirating the cannula during withdrawal.
Indications
The standards for basic monitoring1 stipulate that arterial blood pressure shall be determined and recorded at least every 5 minutes. This standard is usually met by intermittent, noninvasive blood pressure monitoring. However, continuous monitoring may be indicated by patient comorbidities or by the nature of the surgery to be performed.
Arterial catheters provide continuous monitoring of blood pressure and convenient vascular access to obtain blood samples for laboratory assays, including blood gas analysis to assess respiratory function. Placement of an arterial catheter can therefore be indicated by the need to meet any of these contingencies:
1. Rapid changes in blood pressure or extremes of blood pressure are anticipated.
High-risk vascular surgeries, trauma surgeries, neurosurgical procedures, intrathoracic and cardiac procedures are associated with the risk of sudden blood loss and rapid changes in blood pressure. These procedures may also involve periods of deliberate hypotension or hypertension.
2. The ability of the patient to tolerate hemodynamic instability is impaired.
Patients with clinically significant cardiac disease, such as coronary artery disease, valvular disease, or heart failure may require continuous monitoring in order to allow treatment for hypotension to be implemented rapidly and minimize the risk of coronary ischemia. Similar concerns apply to patients with a history of cerebrovascular disease. Procedures that involve potential compromise to the vascular supply of the spinal cord indicate the use of an arterial catheter to maintain adequate perfusion and decrease the risk of postoperative paraplegia from spinal cord infarction.32
Critically ill patients may already be hemodynamically unstable at the time of presentation, and require the administration of inotropes and vasopressors. Continuous blood pressure monitoring is indicated to manage the titration of these agents.
3. Compromise of the patient’s respiratory function, oxygenation or ventilation is anticipated.
Mismatch between pulmonary ventilation and perfusion will impair the ability of ETCO2 to predict PACO2. This may arise iatrogenically during procedures that require single lung ventilation. Patients may present with pulmonary comorbidities such as ARDS, pulmonary embolism, and pulmonary hypertension with consequent ventilation–perfusion mismatch and impaired alveolar diffusion. Arterial catheters provide a means to obtain arterial blood gas samples frequently to assess changes in respiratory function.
4. Metabolic derangements are anticipated.
Surgical procedures that are anticipated to produce large volume fluid shifts may indicate the placement of an arterial catheter to enable laboratory samples to be drawn frequently and to allow electrolyte and acid–base disturbances to be detected and corrected.
Contraindications
Arterial cannulation is regarded as an invasive procedure with documented morbidity. Ischemia after radial artery cannulation resulting from thrombosis, proximal emboli, or prolonged shock has been described.33 Contributing factors include severe atherosclerosis, diabetes, low CO, and intense peripheral vasoconstriction. Ischemia, hemorrhage, thrombosis, embolism, cerebral air embolism (retrograde flow associated with flushing), aneurysm formation, arteriovenous fistula formation, skin necrosis, and infection have reportedly occurred as the direct result of arterial cannulation, arterial blood sampling, or high-pressure flushing. Patients with compromised collateral arterial supply, such as those with Reynaud’s phenomenon or thromboangiitis obliterans (Buerger’s disease), are at increased risk for ischemic complications.29
Common Problems and Limitations
The fidelity of the transducer  system is optimized when catheters and tubing are stiff, the mass of the fluid is small, the number of stopcocks is limited, and the connecting tubing is not excessive. Figure 25-4 demonstrates the effect of damping on the character of the arterial pressure trace. In clinical practice, under-damped transducer systems tend to overestimate the systolic pressure by 15 to 30 mm Hg and amplify artifacts. Likewise, excessive increases in ζ reduce fidelity and underestimate systolic pressure.
FIGURE 25-4. The relationship between the frequency of fluid-filled transducing systems and damping (ζ). The shaded area represents the appropriate range of damping for a given natural frequency (fn). The size of the wedge also depends on the steepness of the arterial pressure trace and heart rate. (Reproduced from: Gardner RM. Direct blood pressure measurement–dynamic response requirements. Anesthesiology 1981;54: 227–236.)
Related posts:


Stay updated, free articles. Join our Telegram channel

Full access? Get Clinical Tree


