CHAPTER 24. Pulmonary Emergencies
Reneé Semonin Holleran
Competencies


Get Clinical Tree app for offline access
1. Perform a pretransport examination and evaluation of the patient’s pulmonary function.
2. Demonstrate the management of a pulmonary emergency during transport.
3. Provide critical interventions during the transport process for selected pulmonary problems.
The transport of patients with medical disorders of the pulmonary system can be a significant concern. Oxygenation in many patients with pulmonary system disease is already compromised, and altitude or disconnection from set ventilators may have deleterious effects. 1 For the healthy person, alveolar oxygen tension (PaO 2) decreases to 65 mm Hg at 8000 ft with a decrease in arterial oxygen tension (PaO 2) to approximately 60 mm Hg. 4 Patients with significant pulmonary disease may show signs of hypoxemia at altitudes well below 8000 ft. Severe tissue hypoxia can occur with minimal obvious clinical signs. Thorough physical assessment and the use of pulse oximetry and capnography may help the transport team identify and intervene in impaired oxygenation situations.
ANATOMY AND PHYSIOLOGY OVERVIEW
Anatomy
Airway
The upper airway consists of the nose, mouth, and pharynx. The pharynx extends from the nose to the larynx. The upper airway serves as a conducting system that warms, filters, and humidifies inspired air before it reaches the lungs. The pharynx branches into the larynx and the esophagus. The larynx contains the vocal apparatus, which includes the vocal cords, cartilage, and musculature. External landmarks of this area are the thyroid and cricoid cartilage, which can be palpated in the neck. The cricoid area is often the site for emergency surgical airway access. The epiglottis is a leaf-shaped flexible cartilage that covers the larynx during swallowing. Its primary function is to prevent food and liquids from entering the trachea and lungs. The lower airway consists of the trachea, the right and left mainstem bronchi, bronchioles, terminal bronchioles, respiratory bronchioles, alveolar ducts, and alveolar sacs. 3,6
The trachea originates at the distal margin of the cricoid cartilage at the level of the sixth cervical vertebra. It continues distally to the bifurcation, the carina, which is at the level of the fifth thoracic vertebra. In adults, the length of the trachea is approximately 11 cm with an internal diameter of 12 mm. The trachea accounts for approximately 20% of anatomic dead space (approximately 30 mL). 3,6
The mucosal surface of the trachea is made up of columnar epithelium and mucus-secreting cells. The carina branches into the left and right mainstem bronchi. The right mainstem bronchus is straighter and more in line with the trachea than the left mainstem, which may result in the endotracheal tube passing into the right mainstem rather than the left during intubation or suctioning.
The right and left mainstem bronchi branch into bronchioles. The bronchioles have some cartilage but consist of it less and less as the bronchioles progress distally. Further division gives rise to respiratory bronchioles that are the transitional zones between the bronchioles and the alveolar ducts. These zones are the transition between conducting airway and gas exchange areas. Alveolar sacs arise from the alveolar duct. 3,6
The alveolar sac and pulmonary capillary are in close contact to facilitate gas exchange. The thin alveolar walls are made up of two types of epithelial cells: type I and type II. Type I cells are most abundant and are thin flat squamous cells across which gas exchange occurs. Type II cells secrete surfactant, a lipoprotein that coats the alveoli. Surfactant facilitates gas exchange by lowering surface tension of the fluids that line the internal surface of the alveoli, which prevents alveolar collapse during expiration. 3,6
Thoracic Cage
The boundaries of the thoracic cavity are the sternum, ribs, and costal cartilage anteriorly and the ribs and thoracic vertebrae posteriorly. The clavicles and diaphragm establish the superior and inferior boundaries. Two layers of pleura line the thorax. The visceral pleura cover the outer surface of each lung. The parietal pleura lines the inner surface of the thoracic cavity. Between the two layers of pleural tissue is the pleural space, a potential space that contains a small amount of serous fluid. The fluid lubricates the two surfaces to facilitate ease of movement. It also creates a cohesive force that assists in maintaining the negative pressure that allows the lungs to remain inflated. Many organs are found within the thorax, including the heart, great vessels, trachea, esophagus, thymus gland, lymphatic vessels, and nerves. 13
Muscles of Ventilation
Ventilation has two phases: inspiration and expiration. Inspiration is an active process. Contraction of the diaphragm and the external intercostal muscles increases the anterior posterior diameter of the thorax by raising the ribs and lowering the diaphragm. As chest cavity size increases, a negative pressure gradient is created, and air is inspired. The muscles then relax and cause passive expiration.
Volumes and Capacities
For assessment of the events of pulmonary ventilation, the air in the lungs has been divided into four different volumes and four different capacities. 3 Volumes are distinct measurements (Table 24-1). Total lung capacity(TLC) is the sum of the volumes. Capacities are a combination of volumes (Table 24-2). Pulmonary volumes and capacities (Figure 24-1) are approximately 20% to 25% less in women than in men. 3
| Lung Volumes | Amount | Definition |
|---|---|---|
| Tidal volume | 500 mL | Volume of air inspired or expired with normal breath |
| Inspiratory reserve volume | 3000 mL | Extra air that can be inspired in excess of normal tidal volume |
| Expiratory reserve volume | 1100 mL | Amount of air that can be expired by forceful expiration after normal tidal volume |
| Residual volume | 1200 mL in a 70-kg patient | Volume of air remaining at end of maximal expiration |
| Capacities | Amount | Definition |
|---|---|---|
| Inspiratory capacity | 3500 mL (∼50 mL/kg) | Tidal volume plus inspiratory reserve volume: amount of air that can be breathed beginning at normal expiratory level and distending lungs to maximal capacity |
| Functional residual capacity | 2300 mL | Expiratory reserve volume plus residual volume: amount of air remaining in lungs at end of normal exhalation |
| Vital capacity | 4600 mL | Inspiratory reserve volume plus tidal volume: maximal amount of air that can be expelled from lungs after filling to maximum and expiring maximally |
| Total lung capacity | 5800 mL | Maximal volume lung expansion with greatest inspiratory effort |
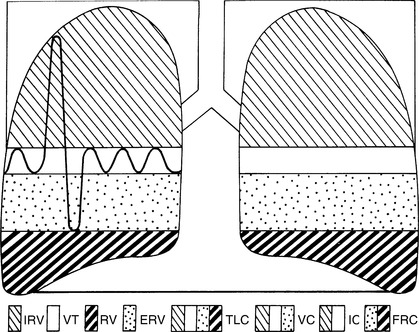 |
| FIGURE 24-1 Normal lung volumes and capacities.IRV, Inspiratory reserve volume; VT, tidal volume; RV,residual volume; ERV, expiratory reserve volume; TLC, total lung capacity; VC, vital capacity; IC, inspiratory capacity; FRC, functional residual capacity. (From Des Jardins T, Burton CG: Clinical manifestations and assessment of respiratory disease, ed 4, St Louis, 2002, Mosby.) |
Physiology
Effective ventilation depends on an intact thoracic cage, patent airway, integrity of the alveolar-capillary membrane, normal compliance, normal airway resistance, and adequate nutrition.
Alveolar-Capillary Membrane
Gas exchange occurs in the alveolar-capillary membrane. Several structures are involved in this exchange (Box 24-1). Any change in these components alters gas movement across the respiratory capillary membrane.
BOX 24-1
Structures Involved in Gas Exchange
Surfactant
Alveolar membrane
Interstitial space
Capillary membrane
Plasma
Red blood cells
The concepts integral to understanding gas exchange include diffusion, ventilation (V), perfusion (Q), ventilation-perfusion (V/Q) ratio, dead space, and shunts. Diffusion is the movement of gas from an area of higher pressure to an area of lower pressure—simply stated, from a greater concentration to a lesser concentration. Oxygen and carbon dioxide (CO 2) diffuse across the respiratory membrane.
Ventilation-Perfusion
Alveolar ventilation is the total volume of new air that enters the alveoli each minute. In the healthy adult male, alveolar ventilation is approximately 4 L/min. 3,6
Perfusion is the amount of blood flow to the respiratory capillaries. Normally, the amount of blood that perfuses the alveoli is 5 L/min (i.e., cardiac output). In a perfect physiologic state, the ventilation of every alveolus is matched by an equivalent of perfusion, resulting in an equal V/Q ratio.
Various physiologic conditions alter the ventilation and perfusion relationship. When ventilation is less than perfusion, as occurs in atelectasis, more unoxygenated blood enters the systemic circulation. The condition that results in blood entering the system circulation without passing through a ventilated area of the lung is defined as shunting. 3,6 Anatomic shunting is the effect of blood that has not been oxygenated by the lungs traveling from the right to the left side of the heart, as with bronchial circulation. 5 Anatomic shunting normally occurs to less than 5% of cardiac output. Inspiration of 100% oxygen does not correct the shunt unit because all blood does not come in contact with functional alveoli. Shunting is the single cause of hypoxemia that cannot be rectified with delivery of 100% oxygen. 6
When ventilation is greater than perfusion, a ventilation-perfusion mismatch occurs. A disease state that illustrates this situation is a pulmonary embolus. This physiologic occurrence is defined as a dead space unit. 6,16Dead space is the inspired volume of air that does not come in contact with pulmonary capillary blood. Anatomic dead space is made up of the conducting airways and is normally 2 mL/kg of ideal body weight. 6
In the setting of poorly ventilated arterioles, constriction occurs, thereby diverting the blood to better-ventilated areas. Similarly, poorly perfused alveoli collapse, which results in the diversion of airflow to more effectively perfused areas. This is termed a silent unit and helps to compensate for imbalanced V/Q ratios (Figure 24-2).
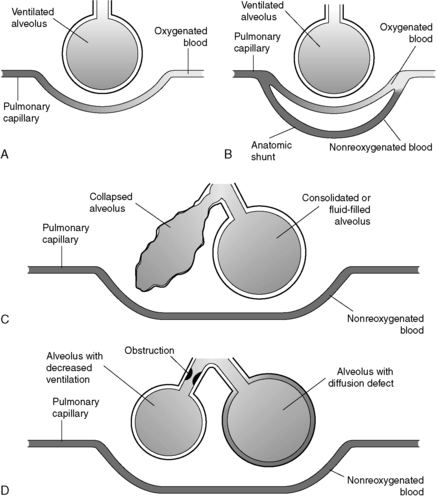 |
| FIGURE 24-2 Pulmonary shunting. A, Normal alveolar-capillary unit. B, Anatomic shunt. C, Types of capillary shunts. D, Types of shunt-like effects. (Modified from Des Jardins T: Cardiopulmonary anatomy and physiology: essentials for respiratory care, ed 2, Albany, NY, 1993, Delmar.) |
Transportation of Gases
Oxygen is transported in the blood as either bound to hemoglobin (97%) or dissolved in the plasma. The oxygen pressure (PO 2) reported on arterial blood gas analysis is a measure of dissolved oxygen only.
Oxygen-Hemoglobin Dissociation Curve
The oxygen-hemoglobin dissociation curve illustrates the relationship between hemoglobin saturation and PaO 2. This curve depicts the ability of hemoglobin to bind and release oxygen into the tissues. The relationship between oxygen content and the pressure of oxygen in the blood is not linear (Figure 24-3).
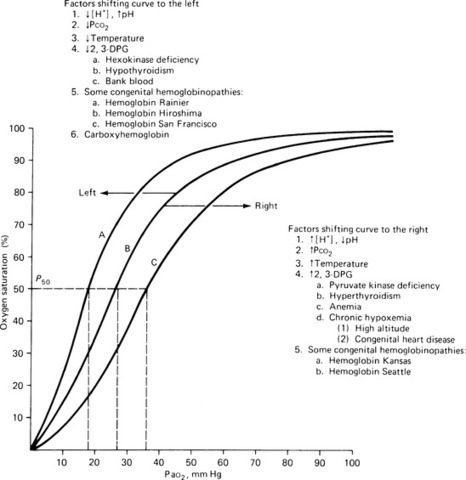 |
| FIGURE 24-3 Curve Bis the standard oxyhemoglobin dissociation curve. Curve Ashows the curve shifted to the left because of hemoglobin’s increased affinity for oxygen. Curve C shows the curve shifted to the right because of hemoglobin’s decreased affinity for oxygen. Factors responsible for shifting the curve are listed adjacent to curves A and C. (From Kinney MR, et al: AACN’s clinical reference for critical care nursing, St Louis, 1988, Mosby.) |
Various physiologic states change the relationship between hemoglobin saturation and PaO 2(i.e., the oxygen-hemoglobin dissociation curve shifts in position). 3,6
A shift to the left indicates an increase in the affinity of oxygen and hemoglobin. Physiologically, oxygen does not dissociate from the hemoglobin until tissue oxygen levels are very low because there must be a gradient. Situations that result in a left shift include alkalosis, hypocapnia, hypothermia, and decreased levels of 2,3-diphosphoglycerate (2,3-DPG). 2,3-DPG is an intermediate metabolite of glucose that assists in the dissociation of oxygen from hemoglobin at the tissue level. Levels of 2,3-DPG may be lower in patients who have received massive transfusions, related in part to the fact that stored blood is depleted of 2,3-DPG. 3
The oxygen-hemoglobin curve shifts to the right in conditions that cause oxygen to dissociate more rapidly. In such cases, hemoglobin has a lessened affinity for oxygen, which results in increased oxygen delivery at a cellular level. Physiologic conditions that result in a right shift include acidosis, hypercapnia, and hyperthermia (see Figure 24-3).
The understanding of this relationship is significant to the flight nurse to allow for the optimal intervention for patients. The amount of oxygen transported per minute is a product of oxygen content and cardiac output. This represents the quality of oxygen transported to the tissues per minute and is contingent on the interaction of the respiratory system, the circulatory system, and the erythropoietic system. 3 These relationships are defined in the formulas in Box 24-2.
BOX 24-2
Oxygen Content Components
| Oxygen content = (Oxygen capacity × oxygen saturation) + (0.0031 × PaO 2) | ||
| Oxygen capacity = Maximal amount O 2 blood can carry | Stated as milliliters of O 2 per 100 mL of blood (vol%) | Multiply hemoglobin by 1.34 |
| Oxygen saturation = % of hemoglobin saturated with oxygen | Stated as percent | SpO 2 or SvO 2 |
| Systemic oxygen transport (mL/min) = Arterial oxygen content (mL/100 mL) × cardiac output × 10 (conversion factor) = 1000 to 1200 mL/min | ||
Oxygen Consumption
The arterial-mixed venous difference in oxygen content is the difference between the arterial oxygen content and the mixed venous oxygen content. This difference indicates the actual sum of oxygen removed from the blood during circulation through the tissue. Normal oxygen transport is 1000 to 1200 mL/min. In normal physiologic conditions, the tissues use 250 to 300 mL. Therefore, normal oxygen consumption is 250 to 300 mL. Mixed venous oxygen content values are determined from blood samples from pulmonary artery catheters. 3,6,9
Carbon Dioxide
Carbon dioxide is transported in the blood by three mechanisms. CO 2 is dissolved in the plasma, which represents 10% of the CO 2 transported in the blood. Carbon dioxide also is moved by a chemical association with hemoglobin, carbaminohemoglobin. This mechanism affects 30% of the CO 2transported. It is a rapid system and can bind more CO 2than oxyhemoglobin. The final and most significant mechanism is a conversion reaction as bicarbonate, which represents 70% of the CO 2 in the body. The bicarbonate reaction is slow in the plasma and rapid in the red blood cells. 3,6,9
RESPIRATORY SYSTEM SUPPORT
Oxygen Therapy
Many critically ill and injured patients need oxygen therapy to augment the delivery of adequate tissue oxygenation. The most frequently used initial therapy for hypoxia is oxygen therapy.
Oxygen delivery systems are classified in two categories: high-flow systems and low-flow systems. Low-flow systems include a nasal cannula and simple oxygen face masks. These low-flow systems allow the patient to draw a supplemental amount of oxygen from the apparatus, and most of the inspired tidal volume comes from the room air within or around the apparatus. Therefore, the amount of oxygen that is inspired varies depending on the patient. The flow of oxygen from a cannula or simple mask is constant. The concentration of inspired oxygen is variable and depends on the patient’s minute ventilation (Table 24-3). 3,6,9 For example, a cardiac patient with a high minute ventilation inspires less oxygen than a patient with a lower minute ventilation because the patient with high minute ventilation uses a greater amount of room air per minute. 9,10
| Apparatus | Oxygen Flow Rate (L/min) | FiO 2(%) |
|---|---|---|
| Nasal cannula | 1-6 | 24-45 |
| Simple face mask | 4-6 | 35-45 |
High-flow oxygen systems include nonrebreather masks. These devices result in the patient inspiring the total present fraction of inspired oxygen (FiO 2). Venturi masks operate by drawing oxygen through a narrow conduit that increases gas velocity and results in more room air being pulled into the mask. This high flow makes the concentration of inspired oxygen less dependent on the patient’s ventilatory pattern. Venturi (air entrainment) masks can render precise low concentrations of oxygen between 24% and 50% (Figure 24-4). 3
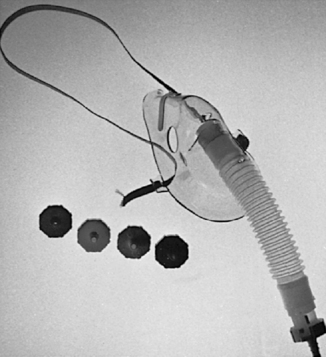 |
| FIGURE 24-4 Venturi mask and oxygen regulators. (Courtesy Richard Lazar, Stanford, CA.) |
Nonrebreather masks have a reservoir bag that fills with 100% oxygen. These masks also use a one-way valve that allows inspiration from the reservoir and precludes inspiration of room air. The rebreather ensures that patients inhale basically 100% oxygen, regardless of inspiratory effort (Figure 24-5). 3,14
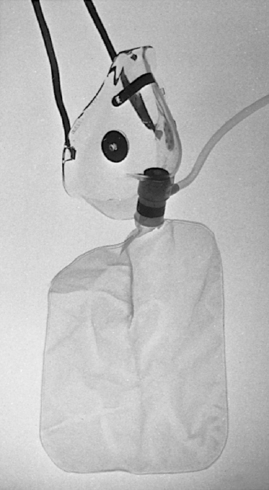 |
| FIGURE 24-5 Oxygen reservoir mask. (Courtesy Richard Lazar, Stanford, CA.) |
Ventilatory Support
Many patients with a pulmonary emergency need mechanical ventilation during transport. Chapter 12 contains extensive discussion about the use of ventilators during transport, including management of the machine and the patient.
Respiratory Monitoring Methods
Measurement of respiratory function during transport assists the team in assessment of acute changes in pulmonary function. Chapter 12 contains an in-depth discussion of current methods that can be used to monitor a patient’s pulmonary status during transport.
ACUTE RESPIRATORY FAILURE
Acute respiratory failure can occur when chronic pulmonary disease or other factors affect the patient’s ability to maintain adequate ventilation. Acute respiratory failure is defined as PO 2less than 60 mm Hg and carbon dioxide pressure (PCO 2) greater than 45 to 50 mm Hg. 16 The transport team’s initial concern is for adequate oxygenation and ventilation, followed by management of the underlying process that led to acute respiratory failure.
ACUTE RESPIRATORY DISTRESS SYNDROME
Etiology
Acute respiratory distress syndrome (ARDS) is a lung injury that has many causes (Figure 24-6). It may be a complication of other diseases or injuries, with the most common severe sepsis with a pulmonary source of infection. 4 It is most commonly seen in patients with direct or indirect acute lung injury (ALS). Direct injuries may include gastric aspiration or inhalation injuries. Indirect injuries result in hypoperfusion of the lung and may be the result of severe hemorrhage, major burns, sepsis, multiple transfusions, multiple trauma, head injury associated with a change in mental status, pulmonary contusion, multiple fractures, and acute pancreatitis. 5,9
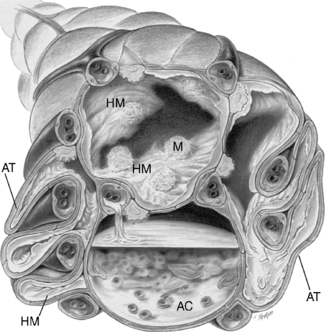 |
| FIGURE 24-6 Cross-sectional view of alveoli in adult respiratory distress syndrome.HM, Hyaline membrane; AT, atelectasis; AC, alveolar consolidation; M, macrophage. (From Des Jardins T, Burton GG: Clinical manifestations and assessment of respiratory disease, ed 4, St Louis, 2002, Mosby.) |
Pathophysiologic Factors
Acute respiratory distress syndrome results from a severe alteration in pulmonary vascular permeability, which leads to a change in lung structure and function. It is divided into two phases. Phase one is the disease process that initiates an exudative state with an overwhelming expression of a proinflammatory response. This response results in damage to pulmonary endothelium and epithelium and in accumulation of fluid in the alveoli. 5 The second phase causes extensive pulmonary fibrosis and loss of normal alveolar structure. 5,6 The outstanding characteristic of ARDS is hypoxemia refractory to oxygen therapy. Because ARDS is a complication of other illnesses or injuries, the transport team must also consider the pathophysiology of the underlying problem.
Assessment
Assessment of the patient with ARDS includes the history of the present illness to determine the predisposing factors that led up to the diagnosis. Patients with ARDS report sudden onset of dyspnea; cyanosis occurs, and intubation with mechanical ventilation often becomes necessary. The patient appears in obvious acute distress. If the transport team is using mechanical ventilatory support for the underlying illness or injury, pulmonary compliance may decrease. 5,6
Chest radiographs reveal widespread pulmonary infiltrates. Hypoxemia is present and may be severe. As the process worsens, accumulation of fluid in the alveoli significantly reduces pulmonary compliance. The patient’s condition may progress to hypercapnia respiratory failure as the ability to maintain an effective minute ventilation is lost. 5
< div class='tao-gold-member'>
Only gold members can continue reading. Log In or Register to continue
Related posts:


Stay updated, free articles. Join our Telegram channel
Full access? Get Clinical Tree
