(1)
Division of Pulmonary and Critical Care Medicine, Eastern Virginia Medical School, Norfolk, VA, USA
Keywords
Vital signsBlood pressureMean arterial pressureHeart rateRespiratory rateArterial oxygen saturationStroke volumeRapid response teamsEarly warning score (EWS)HypotensionHypoxiaHyperoxiaIt is by no accident that the five (now six) vital signs are called VITAL SIGNS. Yet, many clinicians do not appreciate the importance of these VITAL signs nor how to interpret them. The initial assessment of every ICU and ER patient requires a thoughtful review of the five vital signs; this has an essential role in triage decisions and the initial treatment strategy. Any patient with an abnormal vital sign is at an increased risk of death. The risk of death is compounded by derangements of multiple vital signs [1]. In addition, the trends in the vital signs are VITALLY important in tracking a patient’s progress. This chapter reviews the Five Vital Signs… and introduces the 6th vital sign.
Blood Pressure
Blood pressure is the most important of the six vital sign. Organ blood flow is driven by the difference in the pressure between the arterial and venous sides of the circulation. The mean arterial pressure (MAP)1 minus the central venous pressure (CVP) is the driving force for organ blood flow while the difference between post-arteriolar and venular pressure determines microcirculatory flow. As discussed in Chap. 12, venous pressure has a much greater effect on microcirculatory flow than the MAP. As long as the MAP is within an organs autoregulatory range (see below), the CVP becomes the major determinant of capillary blood flow. Microcirculatory flow and organ function “is best” with a higher MAP and a lower CVP (not higher CVP).
It should however be realized that CO and TPR and interdependent with changes in CO effecting TPR and changes in TPR effecting CO.
MAP = cardiac output (CO) × total peripheral resistance (TPR).
The Brain-Heart Distance and the Giraffe Theory of Blood Pressure Determination in Humans
As first suggested by Harvey Cushing in 1901 [2], any reduction in cerebral blood flow to the cardiovascular control centers (in the brainstem) will result in activation of these centers which will proportionally increase systemic blood pressure (BP) and return cerebral blood flow to a new homeostatic level. According to this theory the MAP at all times in all individuals is determined by the pressure needed to perfuse the brainstem. It should also be recalled that the hydrostatic pressure changes by 0.77 mmHg for every 1 cm change in vertical distance. This theory explains the increase in blood pressure in humans from birth to adulthood, the higher high blood pressure in taller than shorter individuals and the progressive increase in blood pressure as the length of the Giraffe’s neck grows with aging (see Fig. 14.1) [3]. This theory suggests that the cardio-cranial distance is a major factor determining BP. Furthermore, an increase in brainstem blood flow will result in homeostatic changes that lower BP; i.e. the brainstem is continually adjusting BP to ensure just the right perfusion pressure and blood flow. This may explain the lower blood pressure in humans at night (lying down during sleep) than during the day and the observation (that is not widely appreciated) that chronically bed ridden patients have a lower than normal BP as they require a lower BP to perfuse their brainstem. This observation also accounts for the cephalad location of the heart in terrestrial snakes as compared with aquatic snakes…. else terrestrial snakes would faint when they tried to climb a tree [4].
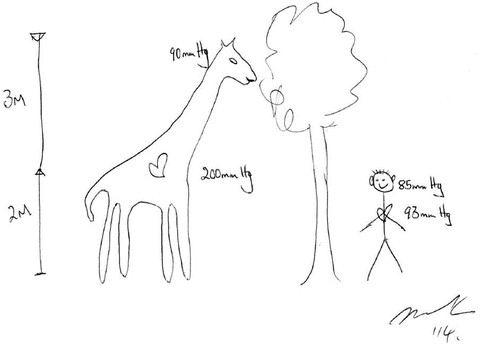
Fig. 14.1
Mean arterial pressures in a Giraffe and man at the level of the heart and brain
FYI: Birds have a higher BP than humans. Birds have larger hearts and a much higher cardiac output (CO) than that of mammals corrected for body mass. The high CO accounts for the high BP. The high CO is necessary to meet the high metabolic demands of flight. For example, during flight a pigeons heart rate increases to about 670/min, with a cardiac output of 1 L/min and an oxygen consumption of 200 mL/min.
What’s a Normal Blood Pressure?
The definition of a “normal” blood pressure (BP) is somewhat problematic for the following reasons:
The BP varies widely between groups of people, influenced by ethnic, genetic, lifestyle and cultural factors as well as the degree of industrialization.
The BP measured in a physician’s office/clinic differs from the mean ambulatory BP. The PAMELA study investigated clinic and ambulatory blood pressure in 1,438 non-hypertensive Italian patients [5]. This study demonstrated that a clinic BP measurement of 140/90 mmHg was equivalent to a 24 h ambulatory blood pressure value of 125/80 mmHg and a daytime value of 130/85 mmHg.
The Framingham Heart study demonstrated a progressive increase in BP with aging, beginning in childhood and continuing into adulthood (see Fig. 14.2) [6]. This trend is associated with a greater increase in systolic blood pressure (SBP) than diastolic blood pressure (DBP). Furthermore, while SBP continues to rise until the eighth or ninth decade, DBP tends to remain constant or decline after the fifth or sixth decade; as a consequence, pulse pressure increases progressively with age and the rate of rise accelerates after age 50 years. The pulse pressure has been demonstrated to be a strong predictor of cardiovascular disease [7]. Due to the diverging patterns of change in SBP and DBP with aging, the change in MAP is less than that of either the SBP or DBP.
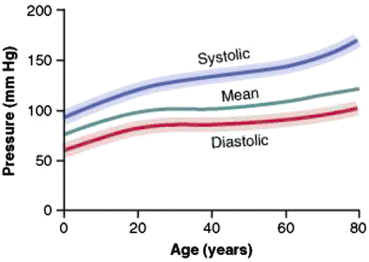
Fig. 14.2
Changes in blood pressure with aging [9]. Reproduced from Guyton and Hall Textbook of Medical Physiology, with permission from Saunders Elsevier
There is a sex difference in blood pressure trends; women’s blood pressure start lower than men’s, catches up by the sixth decade, and frequently become slightly higher thereafter.
Night time blood pressure is about 15 % lower than ambulatory daytime pressure. In the PAMELA study the average daytime BP was 120/80 mmHg (MAP 93) while that at nighttime was 108/64 mmHg (MAP 78). In the IDACO study, which evaluated the relationship between BP and outcomes, an ambulatory 24 h BP of 125/75 mmHg (MAP 92) was considered “normal”; the daytime and nighttime thresholds were 130/85 (MAP 100), and 110/70 (MAP 83) mmHg respectively [8].
It should be noted that none of the publications referencing normative values have corrected for the height of the subject (as discussed above).
As a consequence of these and other factors the BP values used to define and classify hypertension are continuously evolving (and changing). The current JNC 8 treatment thresholds are as follows [7]:
Patients >60 years SBP >150 and DPB >90 mmHg
Patients <60 years DBP >90 mmHg
BP Thresholds for the Intensivist/Anesthesiologist
From the perspective of the intensivist a MAP between 75 and 100 mmHg can be considered “normal.” As the intensivist/anesthesiologist has a limited role in patients’ long-term BP management the threshold values for long term treatment is of “lesser importance”. However, the BP thresholds that require immediate intervention are critically important. The blood pressure thresholds that are relevant are those associated with:
Hypertensive crisis and acute end-organ damage: Diastolic >110 mmHg (see Chap. 28)
Hypotension with organ ischemia: MAP <65 mmHg (see below)
Non-Invasive Blood Pressure (NIBP) vs Arterial Line Blood Pressure (IAP) and Systolic Blood Pressure (SBP) vs Mean Arterial Pressure (MAP)
Lehman et al. compared 27,022 simultaneously measured invasive arterial blood pressure (IAP) recordings with NIBP using a large ICU database [10]. Their analysis demonstrated that systolic NIBP was higher than systolic IAP at pressures less than 95 mmHg and lower than systolic IAP at pressures >95 mmHg. In hypotensive patients with a SBP <60 mmHg the average difference between the two techniques was 10 mmHg. However, the agreement between the NIBP and IAP was much better when comparing the MAP’s rather than the SBP’s. Furthermore, the risk of acute kidney injury (AKI) and death were significantly different between NIBP and IAP, when using the SBP but not the MAP. The risk of AKI and death increased sharply as the MAP fell below 60 mmHg.

The MAP is a better indicator of organ perfusion than the SBP. Furthermore, agreement between NIBP and IAP is much better between the MAP than the SBP. The MAP is the true driving pressure for organ blood flow and should be recorded in all ICU patients. However, the pulse pressure may be important in patients with vascular aneurysms, the DBP in patients with hypertensive emergencies and the SBP in patients with an intracerebral bleed. This suggests the MAP, SBP and DBP should be recorded in ALL ICU patients.
Central vs Peripheral Blood Pressure Measurement
Many clinicians assume that the peripherally measured systolic, diastolic, mean and pulse pressures represent these pressures throughout the arterial tree. However, the arterial pressure waveform undergoes characteristic morphological changes as it travels from central to peripheral vessels. These complex, dynamic changes involve reflection and summation of pressure waves, modulated by factors such as stroke volume, heart rate and arterial elastance [11]. Compared with arterial pressure waveforms measured in the central arteries (e.g. aorta or femoral artery), those at the periphery (e.g. radial artery) characteristically have steeper upstrokes, higher systolic peaks, a later appearing diastolic notch, more prominent diastolic waves and lower end-diastolic pressure. In health, distal pulse amplification results in higher systolic arterial pressures at the periphery, while DPB and MAP are relatively preserved. The differences between the central and peripheral pressures are increased with some vasodilating agents, in shock and with tachycardia. A large difference between central and peripheral systolic blood pressures may occur in the elderly who have poorly complaint blood vessels. When using a radial arterial line for BP monitoring, the alteration in the distal arterial waveform provides a compelling reason to use the MAP rather than the SBP (once again).
After CABG and in shocked ICU patients on vasopressor agents there may be a reversed radial artery to aortic pressure gradient (systolic aortic pressure higher than radial SBP by up to 60 mmHg) [11–14]. In these patients the difference between the MAP is less than that of the SBP, however this difference may still be as large as 20 mmHg. Baka et al. have suggested that radial artery constriction could be responsible for this pressure gradient [15]. In these patients the femoral artery is the preferred site for arterial pressure monitoring [11–13].
Blood Pressure Autoregulation
In all regional circulations including renal, splanchnic, cerebral and coronory beds, blood flow is autoregulated [16, 17]. When blood pressure falls below a given value (autoregulatory threshold), such autoregulation is lost. Below the autoregulatory threshold organ blood flow decreases in an almost linear fashion. The fall in blood flow is likely to occur at a higher blood pressure in patients with long-standing hypertension (see Fig. 14.3). Furthermore, different vascular beds will lose autoregulation at different blood pressure values. For example, the mammalian kidney does so at a MAP of about 70 mmHg, the brain at between 60 and 70 mmHg while the coronary circulation require a MAP of about 50–55 mmHg [16, 18, 19]. The EEG demonstrates features of ischemia when the MAP falls below 50 mmHg [20]. However, there is a wide a range of individual lower and upper limits of the autoregulation ranges in health and disease. The pressure-flow relationship of the kidney has a steeper slope than that of other regional beds. Thus, for a given fall in blood pressure, the proportional fall in blood flow would be expected to be particularly sharp for the kidney. These observations explain why renal function is particularly vulnerable to hemodynamic instability.
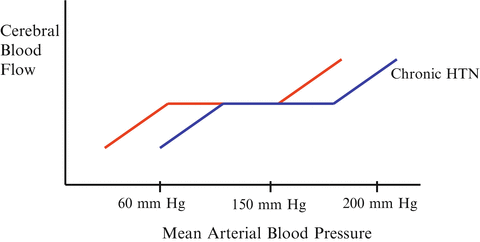
Fig. 14.3
Normal range of cerebral autoregulation and the right shitted curve with chronic hypertension
MAP, Organ Failure and Death
Walsh and colleagues evaluated the association between intraoperative hypotension and postoperative acute kidney injury (AKI) and cardiac injury in 33,330 non-cardiac surgeries [21]. In this study the risk of AKI was greatest for the time spent with a MAP of <60 mmHg and myocardial injury for a MAP less than 55 mmHg. In patients with a MAP <55 the risk of AKI and cardiac injury increased linearly with time spent below this threshold with periods of hypotension as short as 1–5 min being associated with a significantly increased risk of AKI and cardiac injury. Aronson et al. evaluated the association of SBP and mortality in 7,504 patients undergoing CABG surgery [22]. These authors calculated the “area under the curve” (AUC) of all SBP excursions greater than 135 mmHg and less than 95 mmHg. They reported that the AUC <95 mmHg, AUC for 20 % below the patients baseline SBP, minutes <95 mmHg and mean incursion nadir <95 mmHg were all highly predictive of 30 day mortality.
In the study by Lehman et al. cited above a MAP <60 mmHg was a strong predictor of AKI and death in ICU patients [10]. Varpula and colleagues studied the hemodynamic variables associated with mortality in patients with septic shock [23]. These authors calculated AUC of various MAP thresholds over a 48 h time period. The highest AUC values were found for a MAP <65 mmHg (AUC 0.83, 95 % CI, 0.772–0.934). Due to the shift of the autoregulatory range (to the right) in patients with chronic hypertension a higher MAP may be required in these patients. The Assessment of Two Levels of Arterial Pressure on Survival in Patients With Septic Shock (SEPSISPAM) is a multicenter randomized controlled trial recently completed in France (ClinicalTrials.gov NCT01149278). In this study patients with septic shock were randomized to achieve a target MAP of 65–70 or 80–85 mmHg. The primary outcome was 28 day mortality. Secondary outcomes included 90 day mortality and organ failures. A priori a secondary analysis was planned in patients with and without a history of hypertension. Overall there was no difference in either primary or secondary end-point between the two treatment groups. However the incidence of organ failures (particularly renal dysfunction) was higher in the sub-group of patients with chronic hypertension in the lower MAP group. Furthermore, similar to the Varpula study, the time below the 65 mmHg (but not 80 mmHg) threshold was an independent predictor of death. It is important to recognize that the MAP in the 65–70 mmHg group exceeded the target threshold, with the average MAP being about 75 mmHg. Panwar et al. investigated the relationship between the mean perfusion pressure (MPP) deficit and the risk of AKI in 51 shocked patients [24]. The MPP deficit was calculated as the difference between the patients estimated basal MPP and the MPP achieved in the ICU. These authors demonstrated that the risk of AKI was related to the degree of the MPP deficit and the time spent with a >20 % MPP deficit.

These data suggest that in most ICU patients and those undergoing surgery the MAP should be maintained above 65–70 mmHg. In those patients with a history of hypertension the MAP should be kept above 80 % of their baseline value. In hypertensive patients in whom the baseline BP is not known, a target MAP of 75–80 mmHg may be desirable.
Patients with ESRD receiving hemodialysis, patients with systolic heart failure, chronically critically ill patients and bedridden patients frequently have a low blood pressure and tolerate MAP’s as low as 55 mmHg. As long as the patient is mentating adequately and is not symptomatic these patients do not need pressor therapy. Why should the heart waste energy generating a higher pressure that is required? Adrenal insufficiency should however be excluded (see Chap. 39). Do not treat these patients with Midodrine, Florinef or snake oil; you are treating yourself and not the patient.
Circulatory Shock
Shock is traditionally defined as “circulatory failure that results in inadequate cellular oxygen utilization” [25]. This definition is problematic as oxygen delivery has to fall to very low levels before oxygen consumption falls and most patients with “shock” have normal levels of oxygen consumption. Ronco and colleagues determined the critical oxygen delivery threshold for anaerobic metabolism in critically ill humans while life support was being discontinued [26]. The critical oxygen delivery threshold was 3.8 ± 1.5 mL/min/kg (266 mL/min in a 70 kg patient); assuming a hemoglobin concentration of 10 g/L this translates into a cardiac output of approximately 2 L/min; it is likely that only pre-terminal moribund patients with “shock” would have such a low cardiac output. Furthermore, while an elevated lactate concentration is widely believed to be a marker of anaerobic metabolism, an overwhelming body of evidence suggests that in most clinical situations, that lactate is produced aerobically as part of the stress response (see Chap. 13). While it is unclear how best to define shock, we believe “circulatory shock” is best defined as “a potentially life threatening reduction in systemic organ blood flow.” The clinical diagnosis of shock is then based on a constellation of clinical and hemodynamic features which include hypotension, tachycardia, increased respiratory rate and decreased urine output. Typically, the SBP is less than 90 mmHg or the MAP is less than 65 mmHg. While altered mentation, notably obtundation, disorientation and confusion is common, patients may be remarkably lucid despite profound hemodynamic compromise (due to blood flow redistribution to the brain).
Shock results from four potential, and not necessarily exclusive, pathophysiological mechanisms: (i) hypovolemia, (ii) decreased systolic cardiac function, (iii) circulatory obstruction (e.g., pulmonary embolism, cardiac tamponade, or tension pneumothorax) or distributive factors (sepsis or anaphylaxis) [25]. The first three mechanisms are characterized by low cardiac output while distributive shock is characterized by decreased systemic vascular resistance. Characterization of the type(s) and cause of shock is essential in order to provide appropriate therapy.
Pulse Rate

More common causes of sinus tachycardia
Hypovolemia/dehydration
Blood loss
Myocardial dysfunction
Sepsis
Fever
Hypoxemia
Anxiety/delirium/agitation
Substance withdrawal; alcohol, opiates, etc.
Thyrotoxicosis
Pulmonary embolism
Severe anemia
Drug induced; dopamine, epinephrine, etc.
Drug toxicity with sympathomimetic agent; cocaine, etc.
Respiratory Rate (& Pattern)
A ‘breath’ is an inspiration followed by expiration and can be seen by observing the movement of the chest wall. The normal respiratory rate in adults is between 12 and 20/min. and should be counted for one full minute. Depth of breathing should also be recorded, as either ‘shallow’, ‘normal’ or ‘deep’, along with whether accessory muscles are used. The depth of breathing can easily be followed on the bedside monitor which uses trans-thoracic impedance to determine the respiratory rate and produce a respiratory waveform (see Fig. 14.4). The respiratory rate, depth of breathing, patient position (supine vs upright) and work of breathing should be evaluated. A patient lying flat (on one or two pillows) breathing comfortably with good chest excursions at a rate 16–18 breaths/min is “A” okay. However an increase in the depth and rate of breathing (hyperventilation) indicates impending respiratory failure (type 1), while a low respiratory rate (bradypnea) is a sign of type II respiratory failure. A respiratory rate above 20/min is an early warning sign of patient decompensation; while a rate above 26/min indicates impending “doom”. Kussmaul breathing is usually associated with a metabolic acidosis (e.g. ketoacidosis) while Cheyne-Stokes breathing is seen in moribund patients most notably with severe systolic heart failure. Biot’s respiration is an abnormal pattern of breathing characterized by groups of quick, shallow inspirations followed by regular or irregular periods of apnea. It generally indicates a poor prognosis. Biot’s respiration is caused by damage to the medulla oblongata due to strokes or trauma or by pressure on the medulla due to uncal or tentorial herniation. Ataxic respiration is an abnormal pattern of breathing characterized by complete irregularity of breathing, with irregular pauses and increasing periods of apnea. As the breathing pattern deteriorates, it merges with agonal respirations. Ataxic respiration is related to Biot’s breathing, having similar causes.
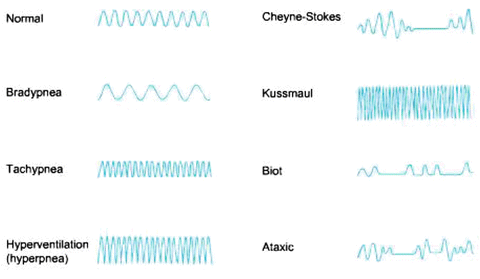
Fig. 14.4
Patterns of spontaneous breathing
Temperature
The patient’s temperature is the “least vital” of all the vital signs. However, patients’ temperature should be measured on presentation and at least 6 hourly once in the ICU. Core rather than peripheral temperatures should be recorded. Alterations in temperature are important in the diagnosis of infection. (See Chap. 18, Fever in the ICU).
Pulse Oximetry
Pulse oximetry is invaluable in the assessment and management of patients with hypoxemia; cyanosis only becomes obvious clinically at saturation below 80 %… much too late. The value of pulse oximetry in patient care has been so great that pulse oximetry has been referred to as the “fifth vital sign” and arguably the greatest advance in patient monitoring since electrocardiography [28, 29]. Continuous monitoring of arterial saturation (SaO2) by pulse oximetry is now considered the standard of care in the ICU, OR and PACU. In addition, continuous pulse oximetry is required in all patients undergoing conscious sedation as well as ER patients with respiratory failure, those patients receiving supplemental oxygen and during endotracheal intubation [30]. While pulse oximetry is the standard of care in these settings there is no data that proves that this technology improves outcome [31]. Moller et al. performed a remarkable study (published in 1993) in which 20,802 surgical patients in Denmark were randomly assigned to be monitored or not with pulse oximetry in the OR and PACU [32]. In this study there was a 19-fold increase in the incidence of diagnosed hypoxemia in the oximetry group as compared to the control group, however, the two groups did not differ in cardiovascular, respiratory, neurologic, or infectious complications. Despite the findings of this study “common sense” should dictate that pulse oximetry improves the safety of patients managed in the ICU, OR, PACU and ER, and that the failure to prove a benefit does not mean that the technology is not beneficial. By alerting the clinician to the presence of hypoxemia, pulse oximeters can lead to a more rapid treatment of serious hypoxemia and possibly avoid serious complications. Moreover, pulse oximetry can reduce the requirement/frequency of arterial blood gas analysis. Pulse oximetry is invaluable in the titration of fractional inspired oxygen concentration (FiO2) and flow rate (nasal canula) in patients’ receiving supplemental oxygen/assisted ventilation. In these settings pulse oximetry should prevent hypoxemia (PaO2 < 60 mmHg) as well as hyperoxia (PaO2 >200 mmHg) conditions associated with an increased risk of death (see below).
Pulse oximetry provides an estimation of the arterial oxygen saturation of hemoglobin (SaO2), which is related to the partial pressure of oxygen in arterial blood (PaO2). Compared with the measurement standard (multiwavelength CO oximeter), pulse oximeters have a mean difference (bias) of between 0.2 and 1 % and a standard deviation (precision) of less than 2 % when SaO2 is above 80 % [33]. With modern pulse oximeters the bias is about 1.5 % and the precision less than 2 % with oxygen saturations between 60 and 80 % (data from Nellcor). Patients with hemoglobinopathies (e.g. Sickle hemoglobin) are at risk of having inaccurate pulse oximetry readings. A falsely elevated SaO2 will be obtained in patients with elevated levels of carbon monoxide and methemoglobin. In addition, patient movement, arrhythmias, nail polish (black, green, blue), hypotension and skin pigmentation can affect pulse oximetry readings [33–37]. Pulse oximetry has been found to be reliable with SBP readings greater than 80 mmHg [37]. Low perfusion states such as hypotension, low cardiac output, vasoconstriction, vasoactive drugs and hypothermia produce a low signal-to-noise ratio resulting in inaccurate readings. Several studies comparing black and white patients reported no significant pigment-related errors in pulse oximeters at normal saturations [38, 39]. “Older” generation pulse oximeters overestimated SaO2 in dark-skinned individuals at saturations below 80 % (bias of 2–4 %), however this discrepancy appears less with newer generation pulse oximeters (data from Nellcor) [40, 41]. High-intensity lighting, typically fluorescent lights, may also lead to false readings. The SaO2 level displayed should only be assumed to be accurate when there is a high-quality plethysmographic tracing displayed on the monitor (see Fig. 14.5). Ideally, the display will show a pulse wave with a demonstrable dicrotic notch. Ultimately, the clinician must look at the patient, and if the pulse oximeter (or any other monitor) does not seem to be behaving in a way that is consistent with the clinical picture that is presented, the clinician must determine the cause of the discrepancy.
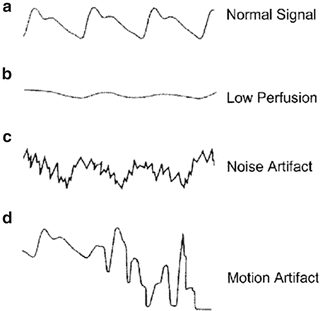
Fig. 14.5
Pulse oximetric waveforms
As the oxygen–hemoglobin dissociation curve is sigmoidal in shape, at high PaO2, or when the patient is on the “flat part of the curve,” large changes in PaO2 level will lead to only minor changes in SaO2 level (see Fig. 14.6). At lower levels of PaO2, relatively small decreases in oxygen tension can lead to rapid decreases in oxygen saturation. A PaO2 of 60 mmHg usually is associated with a SpO2 level of about 90 %. The “knee” of the oxygen–hemoglobin dissociation curve is at about 90 %. Below this value oxyhemoglobin saturation decreases more rapidly as oxygen tension declines (see Fig. 14.6 and Table 14.1). On most pulse oximeters the default setting for the low oxyhemoglobin saturation alarm is therefore 90 %, and this should be regarded as the target for oxygenation in most patients.
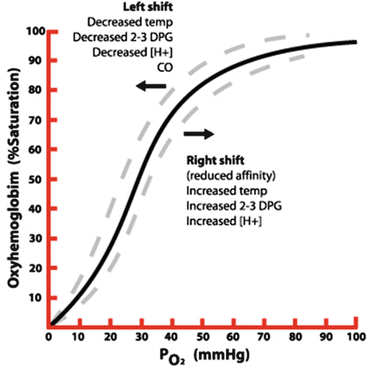
Fig. 14.6
Oxygen-hemoglobin dissociation curve
Table 14.1
Relationship between arterial oxygen saturation and partial pressure of oxygen
SaO2 | PaO2 (mmHg) |
|---|---|
10 | 10.3 |
20 | 14.5 |
30 | 19.2 |
40 | 22.8 |
50 | 26.6 |
60 | 31.2 |
70 | 36.9 |
80 | 44.5 |
90 | 57.8 |
95 | 74.2 |
97.5 | 99.4 |
100 | 700 |
Equation for calculation of arterial oxygen content:
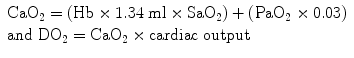 As is evident from the arterial oxygen content equation oxygen delivery is dependent almost entirely on the saturation of arterial blood and cardiac output and not on the PaO2 (which contributes to the small amount of oxygen dissolved in serum). While respiratory failure is usually defined as a PaO2 <60 mmHg it is in reality the SaO2 which should be used to make clinical decisions and the titration of oxygen therapy. However, determining the “safe degree of hypoxemia” for an individual subject is exceedingly difficult. The brain is the most sensitive organ to hypoxemia, and visual, cognitive, and electro-encephalographic changes develop when the oxyhemoglobin saturation is less than 80–85 % in normal subjects [42]. Therefore, in most patients, a SaO2 of 90–92 % results in an adequate level of oxygenation. It is important to note that non-hypoxemic patients do not benefit from oxygen therapy [29]. The recommended target saturation range for critically ill patients not at risk of hypercapnic respiratory failure is 92–96 %; however emerging data suggests that targeting a saturation of 90–92 % may be preferable [43]. In patients with severe acute respiratory distress syndrome (ARDS), a SaO2 target of 86–90 % is acceptable in order to minimize pulmonary oxygen toxicity. Patients chronically exposed to lower oxygen saturation levels adapt to these conditions; this is clearly evident in patients with cyanotic heart disease and mountain climbers. Patients with Fallot’s tetralogy are able to mentate with arterial saturations in the 60’s [44]. Hillary and Tenzing used supplemental oxygen to achieve the first ascent of Mt. Everest in 1953. Twenty-five years later Messner and Habeler ascended Mt.Everest without supplemental oxygen [45]. The Caudwell Xtreme Everest Research Group performed blood gas analysis (from femoral arterial blood) at the balcony of Mt Everest (27,559 ft) in climbers not receiving supplemental oxygen (see Fig. 14.7) [45]. These data clearly indicate that the “acclimatized” human brain can function at quite low levels of SaO2. In patients with COPD or other known risk factors for hypercapnic respiratory failure (e.g. morbid obesity, chest wall deformities or neuromuscular disorders), a target saturation range of 86–90 % is generally recommended (see Chap. 24) [29]. However, these patients may tolerate a SaO2 as low as 80–88 % without cognitive dysfunction. The decision to accept lower values should be based on each individual patient’s circumstances [42].
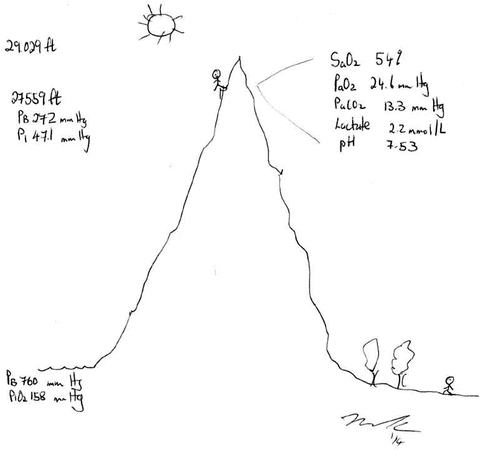
Fig. 14.7
Arterial blood gas analysis at the Balcony of Mt Everest
The SUPPORT study group randomized 1,316 premature infants to a target oxygen saturation of 85–89 % or 91–95 % [46]. Death before discharge occurred more frequently in the lower-oxygen-saturation group (in 19.9 % of infants vs. 16.2 %; relative risk, 1.27; 95 % CI, 1.01–1.60; p = 0.04), whereas severe retinopathy among survivors occurred less often in this group (8.6 % vs. 17.9 %; relative risk, 0.52; 95 % CI, 0.37–0.73; p < 0.001). This study highlights the risks of both hypoxemia and hyperoxia, particularly in the developing brain.

It is important to remember that pulse oximetry only reflects the state of oxygenation of the patient. It does not provide any information regarding the patient’s ventilation.
Alveolar hypoventilation is the main form of respiratory failure postoperatively and results from combinations of central respiratory depression, muscular weakness, and upper airways obstruction. Alveolar hypoventilation is also common in patients receiving opiates. As arterial carbon dioxide (PaCO2) tension rises so does alveolar carbon dioxide tension (PCO2); alveolar PO2 falls, leading to arterial hypoxemia. If the patient is breathing room air then the saturation will fall early and is a reasonably sensitive indicator of hypoventilation. The situation is different if the patient is receiving supplemental oxygen. The alveolar PO2 will now be much higher and alveolar PCO2 will have to rise much further before hypoxemia sufficient to produce measurable desaturation occurs [37, 47]. It is therefore critical to realize that when patients are receiving supplemental oxygen, they may have normal SpO2 levels but be in respiratory failure with hypercapnia and respiratory acidosis. These patients may suffer a cardiac arrest despite normal oximetry. End-tidal CO2 (ETCO2) monitoring is “mandatory” in these patients.
Too Much Oxygen Kills
Oxygen is a treatment for hypoxemia, not breathlessness, nor pain, nor anxiety, nor hemorrhage, nor wound infection, nor cardiac ischemia, nor….. Although supplemental oxygen is often given “automatically” to patients admitted to hospital, oxygen therapy has no proven benefit in non-hypoxemic patients and is likely to be harmful. In addition, a high oxygen fraction has been suggested to prevent adverse outcomes after surgery and anesthesia, including wound infections and postoperative nausea and vomiting (kinda stupid, see below). The deleterious effects of hypoxia are well known and physicians may be overly concerned about avoiding hypoxia and give additional oxygen ‘to be on the safe side’. HOWEVER, hyperoxia is also to be avoided as too much oxygen is toxic.
Related posts:


Stay updated, free articles. Join our Telegram channel

Full access? Get Clinical Tree


