(1)
Division of Pulmonary and Critical Care Medicine, Eastern Virginia Medical School, Norfolk, VA, USA
Keywords
Stress responseHyperglycemiaStress hyperlactemiaOxygen metabolismAerobic metabolismOxygen debtCortisolAdrenal glandAny intelligent fool can make things bigger, more complex, and more violent. It takes a touch of genius—and a lot of courage—to move in the opposite direction
—Albert Einstein, Theoretical Physicist (1879–1955)
The Stress Response

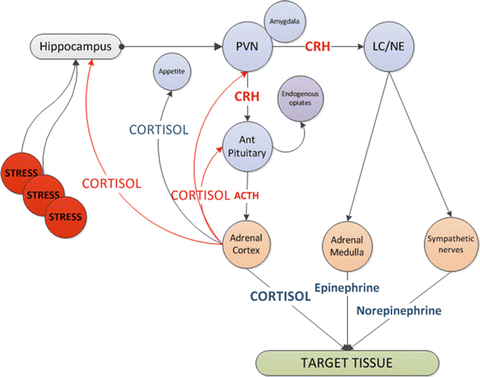
Exposure of the host to diverse noxious stimuli results in a stereotypic and coordinated response, referred to by Hans Selye as the “general adaption syndrome” (or stress response) which serves to restore homeostasis and enhance survival [1]. The stress response is mediated primarily by the hypothalamic-pituitary-adrenal (HPA) axis as well as the sympathoadrenal system (SAS). Activation of the HPA axis results in increased secretion from the paraventricular nucleus of the hypothalamus of corticotropin-releasing hormone (CRH) and arginine vasopressin (AVP) (see Fig. 13.1) [2]. CRH stimulates the production of ACTH by the anterior pituitary, causing the zona fasciculata of the adrenal cortex to produce more glucocorticoids (cortisol in humans) [3]. Activation of the SAS results in the secretion of epinephrine and norepinephrine from the adrenal medulla and sympathetic nerves and to an increased production of inflammatory cytokines such as interleukin-6 (IL-6) [2].


Fig. 13.1
Activation of the stress response. CRH corticotrophin releasing hormone, PVN paraventricular nucleus, LC/NE locus ceruleus norepinephrine system, ACTH adrenocorticotrophic hormone, CRH corticotrophin
In general, there is a graded response to the degree of stress. Cortisol and catecholamine levels correlate with illness severity, the type of surgery, the severity of injury, the Glasgow Coma Scale and the APACHE score [3]. Adrenal cortisol output increases up to tenfold with severe stress (~300 mg hydrocortisone/day) [3]. In patients with shock, plasma concentrations of epinephrine increase 50-fold and norepinephrine levels increase tenfold [4]. The adrenal medulla is the major source of these released catecholamines [4]. Adrenalectomy eliminates the epinephrine response and blunts the norepinephrine response to hemorrhagic shock [4].
The stress response acts via multiple genomic and nongenomic mechanisms to enhance cardiovascular reserve and provide a ready source of fuel (glucose and lactate) for the brain, and heart, allowing the organism to take appropriate action (flight or fight) while preventing excessive activation of the immune system [2].
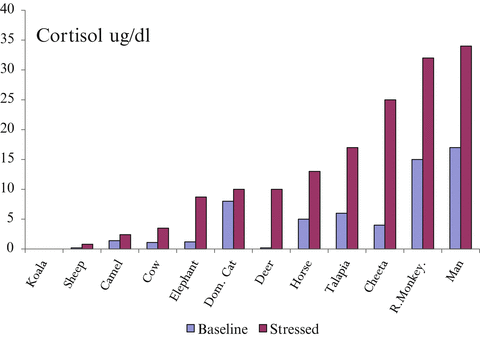
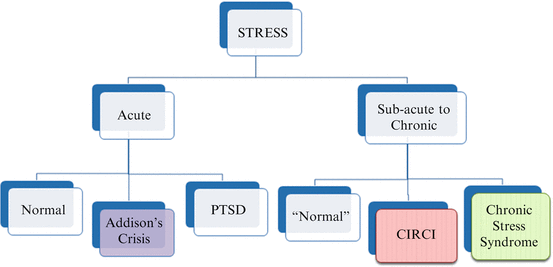
The increase in serum cortisol during stress protects the organism against developing post-traumatic stress disorder (PTSD) [5]. The fight and flight response is essential for survival and is present in the most primitive of species. Furthermore, within species the degree of activation of the HPA axis has evolved to match the degree of stress to which the organism is exposed [6] (see Fig. 13.2). Dysfunction of the stress response is illustrated in Fig. 13.3.


Fig. 13.2
Baseline and stress cortisol level amongst various species

Fig. 13.3
Dysfunction of the stress response. CIRCI Critical illness related steroid insufficiency (see Chap. 39)
Modulators of the stress response
Nicotine, alcohol, medications
Genetic factors
Glucocorticoid receptor and CRH receptor polymorphisms
Sex hormone levels
Male/female
Phase of menstrual cycle
Oral contraceptives
Previous exposure to stress/physical abuse
Maternal stress and fetal programming
Obesity
Position in social hierarchy
Educational level
Chronic stress syndrome is characterized by: (see also Chap. 8)
Stress hyperglycemia
Oxidative injury
Immune suppression
Decreased cell mediated immunity
Infections
Neuropsychiatric
Cognitive dysfunction
Memory
Muscle wasting
Cardiovascular Effects of the Stress Response
Increased sympathetic tone and the increased release of epinephrine and norepinephrine from the adrenal medulla, act on the cardiovascular system to increase heart rate, myocardial contractility and venous return, thereby increasing cardiac output. The increased blood flow is preferentially redistributed to the adrenal glands, myocardium, brain and skeletal muscles. It is noteworthy that norepinephrine increases venous return by α-1 mediated venoconstriction. In addition, norepinephrine increases lymphatic return to the venous system by increasing lymphatic duct contraction [7]. Cortisol increases blood pressure through several mechanisms involving the kidney and vasculature. In vascular smooth muscle, cortisol increases sensitivity to vasopressor agents such as catecholamines and angiotensin II [8, 9]. These effects are mediated partly by the increased transcription and expression of the receptors for these hormones [8, 9].
Immune Effects of the Stress Response
Native CD4+ Th0 cells are bipotential and serve as precursors of Th1 and Th2 cells. Th1 cells play an important role in killing intracellular pathogens whereas Th2 cells are important for antibody production. Th1 cells primarily secrete interferon-γ (IFN-γ), interleukin-2 (IL-2) and tumor necrosis factor-β (TNF-β) which promote cellular immunity, whereas Th2 cells secrete a different set of cytokines (anti-inflammatory cytokines), primarily interleukin-4 (IL-4), interleukin-10 (IL-10) and interleukin-13 (IL-13) which promote humoral immunity and depress cell mediated immunity [10]. Importantly, Th2 cytokines inhibit macrophage activation, T cell proliferation, and the production of pro-inflammatory cytokines. Epinephrine and norepinephrine act synergistically with glucocorticoids to induce a Th2 shift [25]. Glucocorticoids shift the Th1/Th2 balance by decreasing the synthesis of type 1 cytokines and increasing the synthesis of type 2 cytokines, by acting directly on CD4+ T cells and indirectly by inhibiting IL-12 production by monocytes [11]. The Th1/Th2 switch during acute stress serves to prevent over-activation of the immune system. This immune switch explains the immuno-paresis and increased risk of infection associated with trauma and surgery, as well as following prolonged stress [12].
Metabolic Effects of the Stress Response
The stress response results in a multiple endocrine and metabolic effects including stress hyperglycemia, stress hyperlactemia, lipolysis with the release of free fatty acids, proteolysis with the release of amino acids, as well as inhibition of the thyroidal, growth hormone and gonadal axes.
Stress Hyperglycemia
The neuroendocrine response to stress is characterized by excessive gluconeogenesis, glycogenolysis and insulin resistance. Stress hyperglycemia, however, appears predominantly by increased hepatic output of glucose (gluconeogenesis) rather than impaired tissue glucose extraction. Cortisol increases blood glucose concentration through the activation of key enzymes involved in hepatic gluconeogenesis and inhibition of glucose uptake in peripheral tissues such as the skeletal muscles [13]. Both epinephrine and norepinephrine stimulate hepatic gluconeogenesis and glycogenolysis; norepinephrine has the added effect of increasing the supply of glycerol to the liver via lipolysis. Stress hyperglycemia and insulin resistance are evolutionarily preserved responses which allows the host to survive during periods of severe stress [14]. Insects, worms and all verterbrates including fish develop stress hyperglycemia when exposed to stress [14, 15].
Glucose is largely utilized by tissues that are non-insulin dependent, and these include the central and peripheral nervous system, bone marrow, white and red blood cells and the reticuloendothelial system [16]. Cellular glucose uptake is mediated by plasma membrane glucose transporters (GLUT) which facilitate the movement of glucose down a concentration gradient across the non-polar lipid cell membrane [16]. Insulin increases GLUT4 mediated glucose transport in adipose tissue and skeletal muscle by increasing translocation of GLUT4 from intracellular stores to the cell membrane [16]. Thermal injury and sepsis have been demonstrated to increase expression of GLUT-1 mRNA and protein levels in the brain and macrophages [17, 18]. Concomitantly, stress and the inflammatory response result in decreased translocation of GLUT-4 to the cell membrane. It is likely that pro-inflammatory mediators particularly TNF-α and IL-1 are responsible for the reciprocal effects on the surface expression of these glucose transporters. During infection, the upregulation of GLUT1 and downregulation of GLUT-4 may play a role in redistributing glucose away from peripheral tissues towards immune cells and the nervous system.
For glucose to reach a cell with reduced blood flow (ischemia, sepsis), it must diffuse down a concentration gradient from the blood stream, across the interstitial space and into the cell. Glucose movement is dependent entirely on this concentration gradient, and for adequate delivery to occur across an increased distance, the concentration at the origin (blood) must be greater. Stress hyperglycemia results in a new glucose balance, allowing a higher blood ‘glucose diffusion gradient’ which maximizes cellular glucose uptake in the face of maldistributed microvascular flow [19]. In patients with infection and tissue injury the increased energy requirements of activated macrophages and neutrophils are regulated by enhanced cellular glucose uptake related to the increased glucose diffusion gradient and increased expression of glucose transporters [20, 21]. In addition, acute hyperglycemia may protect against cell death following ischemia by promoting anti-apoptotic pathways and favoring angiogenesis. These mechanisms ensure adequate glucose uptake by immune cells and neuronal tissue in the face of decreased microvascular flow. Indeed, two independent groups of investigators using microdialysis and brain pyruvate/lactate ratios demonstrated that attempts at blood glucose normalization in critically ill patients with brain injury were associated with a greater risk of critical reductions in brain glucose levels and brain energy crisis [22, 23]. Similarly, Duning and colleagues demonstrated that hypoglycemia worsened critical illness induced neurocognitive dysfunction [24]. Multiple studies have demonstrated that even moderate hypoglycemia is harmful and increases the mortality of critically ill patients [20, 21]. Iatrogenic normalization of blood glucose may impair immune and cerebral function at a time of crises. In summary, these data suggest that stress hyperglycemia provides a source of fuel for the immune system and brain at a time of stress and that attempts to interfere with this evolutionary conserved adaptive response is likely to be harmful [25].
The association between hyperglycemia and adverse clinical outcomes is complicated by the pre-existing diabetes. Observational data has demonstrated that the association between increasing blood glucose and mortality was much stronger among non-diabetic than among diabetic patients [26, 27]. Egi and colleagues demonstrated that in patients with a high HbA1c (>7 %) there was an inverse relationship between ICU glycemic control and mortality—higher blood glucose levels during ICU stay were associated with lower mortality [28]. Biological adjustment to preexisting hyperglycemia might explain this phenomenon. These observations generate the hypothesis that glucose levels that are considered safe and desirable in other patients might be undesirable in diabetic patients with chronic hyperglycemia. In diabetic patients whose glucose has been poorly controlled prior to ICU admission, rapid and substantial lowering of their blood glucose levels during their acute illness/surgery may worsen outcomes.
Chronic hyperglycemia in patients with diabetes is associated with a myriad of harmful complications. The adverse outcomes associated with chronic hyperglycemia are attributed to the pro-inflammatory, pro-thrombotic and pro-oxidant effects observed with increased glucose levels [29]. The duration and degree of hyperglycemia appears to be critical in determining whether hyperglycemia is protective or harmful. Acute hyperglycemia limits myocardial injury following hypoxia and ischemia [30, 31]. However, in experimental models chronic hyperglycemia is associated with an increased the rate of myocyte death and increased infarct size [31, 32]. These data suggest that acute hyperglycemia may be protective and may result in greater plasticity and cellular resistance to ischemic and hypoxic insults. It is possible that severe stress hyperglycemia (BG >220 mg/dL) may be harmful; this postulate however remains unproven. Furthermore, it is unclear at what threshold stress hyperglycemia may become disadvantageous.
Treatment of “Stress Hyperglycemia”
Numerous studies in both ICU and hospitalized non-ICU patients have demonstrated a strong association between hyperglycemia and poor clinical outcomes, including mortality, morbidity, length of stay, infections and overall complications. These studies have included patients following trauma, burns and surgery as well as in patients with cerebrovascular accidents and acute coronary syndromes. Furthermore, this association is well documented for both the admission as well as the mean glucose level during the hospital stay [25]. In addition to hyperglycemia, glucose variability has been demonstrated to be an independent predictor of poor outcome [33]. Badawi and colleagues demonstrated a progressive increase in the adjusted relative risk of mortality for ICU patients for the maximum average daily glucose from 110 mg/dL to greater than 300 mg/dL, when compared to patients whose highest average daily glucose was 80–110 mg/dL [34].
Based on these data clinicians, researchers and policy makers have assumed the association between stress hyperglycemia and poor clinical outcomes to be causal with the widespread adoption of protocols and programs for in-hospital glycemic control. These individuals who believe that strict glycemic control will “cure all the ills of the world” cite the 2001 study by Van den Berghe to support their argument [35]. There are however a number of serious factors which limit the generalizability of this study, including:
i)
this was a single center, unblinded study with highly “invested” investigators,
ii)
patients received intravenous glucose on arrival to the ICU at a dosage of 200–300 g/day, equivalent of 2–3 L of 10 % glucose per day (quite bizarre),
iii)
parenteral nutrition was provided to almost all patients within 24 h of ICU admission, even those who could tolerate enteral or oral nutrition (a very unusual practice),
iv)
the mortality of patients who had undergone cardiac surgery (the majority of patients) in the control group was twice the national average for the US (very scary!) and
v)
the unadjusted relative reduction in mortality was 42 %, an effect exceeding that of any other interventional trial in critically ill patients (similar to the Rivers EGDT study) stretching the biological plausibility of the findings [36].
NO other study has been able to reproduce the “Leuven Glycemic Control Study” [35]. Indeed, NICE-SUGAR, a large randomized, multi-center, multinational trial performed in 6,104 ICU patients, demonstrated that intensive glucose control increased mortality [37]. More recently the CGAO-REA study group performed a RCT testing tight computerized versus conventional glucose control in 34 French ICU’s [38]. In this study tight computerized glucose control using a clinical computerized decision support system did not significantly change 90-day mortality but was associated with more frequent severe hypoglycemia episodes in comparison with conventional glucose control. A metaanalysis which evaluated “tight glycemic control” in the ICU concluded that “tight glycemic control is associated with a high incidence of hypoglycemia and an increased risk of death in patients not receiving parenteral nutrition. Furthermore, there is no evidence to support the use of intensive insulin therapy in general medical-surgical ICU patients who are fed according to current guidelines” [39]. Hyperglycemia has been assumed to increase infarct size and worsen outcome in patients who have suffered an ischemic stroke [40]. Consequently, tight glycemic control has been recommended in patients who have suffered an ischemic stroke [40]. However, the INSULINFARCT Trial demonstrated that intensive versus subcutaneous insulin in patients with hyperacute stroke significantly increases infarct size [41]. Recently de Mulder et al randomized 294 patients with Acute Coronary Syndrome with an admission BG level between 140 and 288 mg/dL to tight glycemic control (85–100 mg/dL) or conventional glucose management [42]. In this study intensive glucose control did not reduce infarct size, but was associated with an increased risk of death and second myocardial infarction. The current American College of Physicians Guidelines recommends a target BG level of 140–200 mg/dL in medical/surgical ICU patients with hyperglycemia [43]. It does not recommend intensive insulin therapy because of the high likely-hood of hypoglycemia and the absence of benefit. It should be noted that “tight glycemic control” is very labor intensive; nurses spend hours a day on this mindless task (which together with other mindless tasks) limits the amount of time they actually spend looking after their patient!
Tight glycemic control is currently considered the standard of care in patients undergoing cardiac surgery. This practice is based on retrospective data and before-after studies [44–46]; which as discussed in Chap. 1, are no better than “The 10 Tales of Witchcraft.” Agus et al. performed a RCT comparing tight glycemic control to standard of care in 980 pediatric patients undergoing cardiac surgery [47]. Continuous glucose monitoring was used to avoid hypoglycemia. In this study none of the outcome measures differed between groups. More recently Macrae and colleagues performed a multicenter randomized trial of glucose control comparing 72–126 mg/dL with a target of <216 mg/dL in 1,369 pediatric ICU patients [48]. Sixty percent of patients had undergone cardiac surgery and patients were followed for up to 1 year. In this study there was no difference in clinical outcomes overall or in any predefined subgroup of patients. Gandhi et al compared intensive intraoperative insulin therapy versus conventional glucose management during cardiac surgery [49]. In this study there was an increased risk of death and stroke in the intensive insulin group. More recent cohort studies in patients undergoing cardiac surgery have demonstrated a lower risk of complication in patients treated with moderate rather than tight glycemic control [50]. This is likely due to the fact that hypoglycemia with intensive insulin therapy is independently associated with an increased risk of postoperative complications [51]. More recent publications on this topic recommend a “more liberal” blood glucose target (140–180 mg/dL) in patients undergoing cardiac surgery [52].
It would appear that van Den Berghe and colleagues hoodwinked the entire world into this thing called “tight glycemic control”; an approach which appears to increase the risks of complications and death amongst diverse populations of critically ill patients. It should also serve as a lesson regarding the widespread change of clinical practice based on a single center, unblinded study [53]. Common sense would suggest that a few days of moderate hyperglycemia in the ICU should be of no adverse consequence and indeed is probably a protective response. It is possible, however unproven, that prolonged moderate hyperglycemia may be deleterious in Chronically Critically Ill patients (see Chap. 8). “Conservative” glycemic control (BG 140–180 mg/dL) should be considered in these patients.
So What to Do!
Don’t obsess about glycemic control
Check HbA1C on admission in all diabetic patients
Non-diabetics and diabetics with HbA1C <7 %
Target BG between 140 and 200 mg/dL
Diabetics with HbA1C >7 %
Target BG between 160 and 220 mg/dL
How to Achieve These Goals?
Avoid IV glucose and never use TPN
Use an enteral formula with a higher fat (omega-3) to CHO ratio and don’t overfeed
Limit the dose of corticosteroids. ? administer as a continuous infusion
Consider adding insulin (see below)
Stop oral hypoglycemic agents in diabetic patients
24 h trial of 6-hourly insulin sliding scale (continuous tube feed patients)
Consider basal long acting insulin in diabetics
Consider basal long acting insulin (low dose)+bolus insulin in patients receiving bolus tube feeds (See Chap. 32)
Insulin infusion if above measures fail or in patients with severe hyperglycemia (BG >300 mg/dL).
In ICU’s that have 1:1 nursing (not the case in the US), it may be preferable to initiate an insulin infusion in patients’ with a blood glucose >200 mg on two or more occasions rather than attempting glycemic control with subcutaneous insulin.
Glucose Control and Steroids
There is little data that treatment of glucocorticoid induced hyperglycemic in the acute care setting improves outcome. However, efforts to minimize the fluctuations in blood glucose levels may be beneficial and contribute to overall glycemic control. In patients receiving stress doses of corticosteroids (see Chap. 39), hydrocortisone may be given as an infusion at a rate of 8–10 mg/h; a continuous infusion results in a smoother glucose profile than intermittent boluses [54, 55]. The addition (or increased dose) of basal long acting insulin should be considered in patients receiving a glucocorticoid infusion. Similarly, as the biological effect of dexamethasone is about 20 h [56], the addition of a long acting insulin should be considered in these patients (neurosurgical patients). Patients with a COPD exacerbation (see Chap. 24) and those receiving steroids for immunosuppression usually receive methylprednisolone once daily. Prednisone and prednisolone demonstrate a peak biological effect at 4–8 h and a duration of approximately 12–16 h [57]. This pattern mirrors that of NPH insulin [56]. Consequently, concomitant NPH insulin should be considered in these patients. In patients receiving >40 mg/day a dose of 0.4 U/kg NPH is recommended, 0.3 U/kg in those receiving 30 mg/day and 0.2 U/kg in those receiving 20 mg/day [56].
Stress Hyperlactemia
It is widely believed that in critically ill patients when oxygen delivery fails to meet oxygen demand an oxygen debt with global tissue hypoxia ensues [58, 59]. This results in anaerobic metabolism and increased lactate production [58, 59]. An increased blood lactate concentration is therefore regarded as evidence of anaerobic metabolism and tissue hypoxia [58]. It follows from this reasoning that patients with an elevated blood lactate should be treated by increasing oxygen delivery. In 2004 Nguyen and colleagues reported that “lactate clearance”, defined as the percentage decrease in lactate from emergency department presentation to 6 h, was an independent predictor of mortality [58]. They concluded that “lactate clearance in the early hospital course may indicate a resolution of global tissue hypoxia and that this is associated with decreased mortality rates.” This study popularized the concept of “lactate clearance” and has led to a number of studies which have used “lactate clearance” as the major end-point of hemodynamic resuscitation in critically in patients with sepsis (see also Chap. 12) [60–62].
We believe that these arguments are flawed and that in most situations lactate is produced aerobically as part of the stress response—hence the term stress hyperlactemia. Based on this argument it would be illogical to attempt to increase oxygen delivery in patients with an increased lactate concentration in order to treat a non-existent oxygen debt. Indeed, such an approach may be harmful [63]. Furthermore, as indicated below, the condition known as “lactic acidosis” may be a myth that does not exist.
Lactate Metabolism
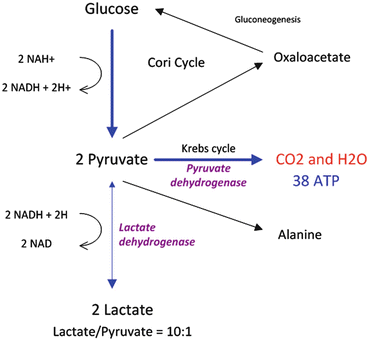
Lactate is produced by glycolysis and metabolized by the liver and to a lesser degree by the kidney. Lactate is produced in the cytoplasm according to the following reaction:
 This reaction favors lactate formation, yielding a tenfold lactate/pyruvate ratio. In physiological conditions, lactate is produced by muscles (25 %), skin (25 %), brain (20 %), intestine (10 %) and red blood cells (20 %) [64]. Cytosolic lactate increases under most if not all circumstances where cytosolic pyruvate also increases. Logically, therefore, lactate accumulation may not imply a state of anaerobic glycolysis but simply a state of accelerated glycolysis (glycolytic flux >citric acid cycle flux) or a state of decreased pyruvate dehydrogenase activity both of which would logically lead to cytosolic pyruvate accumulation. Arterial lactate concentration is dependent on the balance between its production and consumption. In general, this concentration is less than 1 mmol/L, although daily production of lactate is actually 1,500 mmol/L [64, 65]. Generated lactate can be transformed into oxaloacetate or alanine via the pyruvate pathway or can be utilized directly by periportal hepatocytes (60 %) to produce glycogen and glucose (glycogenesis and glucogenesis; Cori cycle). The kidney also participates in the metabolism of lactate (30 %), with the cortex classically acting as the metabolizer by glucogenesis and the medulla as a producer of lactate. Pyruvate is metabolized by the mitochondrial aerobic oxidation pathway via the Krebs cycle. This reaction leads to the production of large quantities of ATP (36 molecules of ATP for one molecule of pyruvate) (see Fig. 13.4).


