(1)
Chennai Breast Centre, Chennai, India
Systematic Approach to Read a Mammogram
Mammographic image interpretation involves a systematic search for specific signs and a disciplined adherence to strict search algorithms. The process starts from clinical information to image quality, image analysis, and documentation and is complete with appropriate communication of the findings and recommendations.
History and Clinical Information
Every attempt should be made to get accurate information regarding symptoms, signs, reproductive history, risk factors, details about previous breast imaging, breast surgery, and breast biopsies. Moles and scars should be marked, and the area of clinical concern should be highlighted. Previous films if available should be obtained for comparison.
Image Adequacy
Compromise in image quality affects image interpretation. Under- or overexposure, poor contrast, positioning errors resulting in exclusion of posterior tissue, and motion blurring are the most common technical deficiencies that lead to a missed cancer. Avoid interpreting suboptimal images (Figs. 5.1a, b and 5.2a, b)
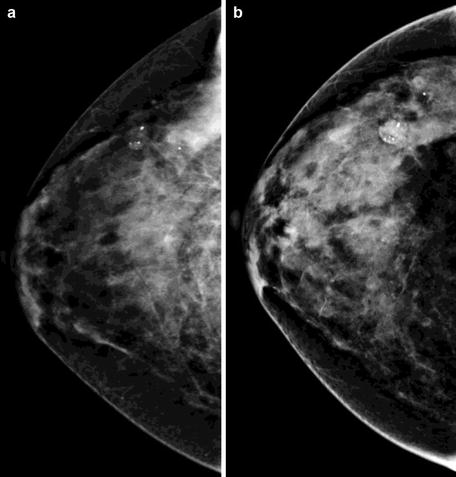
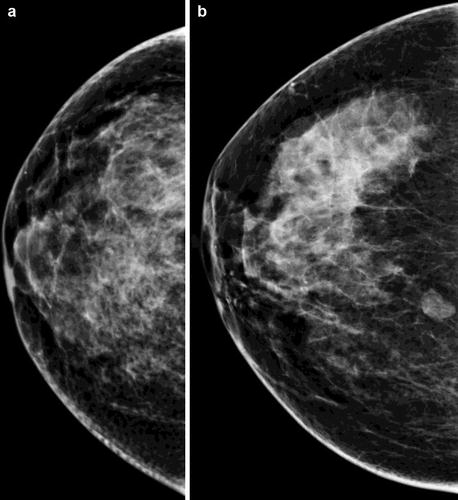
Fig. 5.1
(a) C view without adequate compression. (b) CC view with adequate compression
Fig. 5.2
(a) CC view retromammary area is not included. (b) CC view with retromammary area included
Distraction
Distraction and multitasking make the breast imager vulnerable for errors. A trained helper to read out clinical details, mount the films, and fill in the data sheets could be very useful particularly in large-volume centers. This leaves the radiologist to focus on the view box unhindered. Extraneous light should be decreased. Dedicated mammographic interpretation time should be allotted to the radiologist with no requirements to multitask during this period.
Image Display
Films should be mounted back to back for viewing tissue symmetry. A standard display protocol should be followed. An automated multiviewer is useful in an analog setup, with films mounted back to back with previous images mounted for comparison.
For comparison, mammograms done at least 2 years prior to the current study should be studied if available (Fig. 5.3). In the units where digital transition is being made, provision for viewing the films alongside the digital workstation should be available. A handheld magnifier along with tools for masking technique should be made available for screen–film examinations. Softwares for masking techniques are available for digital workstations.
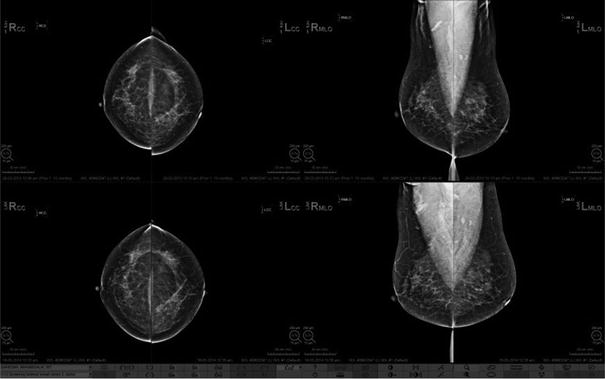
Fig. 5.3
Previous mammograms available on the display workstation for comparison
Image Reading
A patterned, disciplined approach to reading a mammogram should be followed. After ensuring the interpretative quality of the images, the first step is to assess the parenchymal pattern. Dr. Tabar has described five parenchymal patterns, and ACR describes four parenchymal patterns of breast composition. Follow one standard pattern reading for consistency.
ACR Pattern of Breast Density (Fig. 5.4a–d)
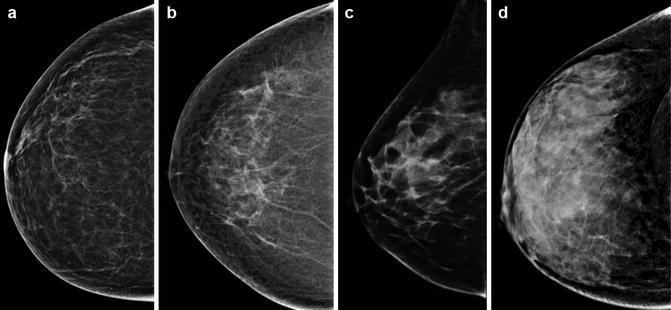
Fig. 5.4
(a) Almost entirely fatty. (b) Scattered fibroglandular densities. (c) Heterogeneously dense. (d) Extremely dense breast
Almost entirely fatty (<25 % glandular)
Scattered fibro glandular densities (25–50 % glandular)
Heterogeneously dense (51–75 % glandular)
Extremely dense breast (>75 % glandular)
Tabar’s Classification of Breast Patterns (Fig. 5.5a–e)
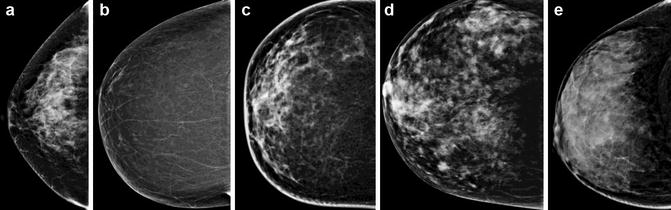
Fig. 5.5
(a–e) Images showing patterns according to Tabar’s classification. (a) Pattern I. (b) Pattern II. (c) Pattern III. (d) Pattern IV. (e) Pattern V
Pattern I
Pattern II
Pattern III
Pattern IV
Pattern V
Women with dense breasts are at a slightly higher risk for breast cancer. Dense breasts also make interpretation challenging, but dense breasts should not be an excuse to miss subtle signs of breast cancer. It is important to compare the relative increase or decrease in density over time, and any new density or a developing density should be evaluated further. Normal involution in the breast occurs from posterior to anterior, medial to lateral and from below upwards. The retroglandular area, lower quadrant, and medial quadrant are usually devoid of glandular tissue as involution progresses, and any asymmetry or abnormal opacities in these areas should be investigated further (Fig. 5.6a, b).
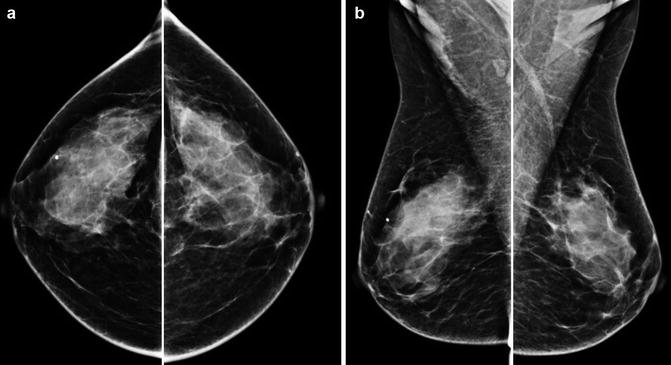
Fig. 5.6
(a, b) Normal pattern of involution occurs from the inner to outer quadrant in CC view and the lower to upper quadrant in MLO view
Masking technique is very useful to highlight more subtle asymmetries. Dr. Tabar’s masking protocol is available with different vendors with digital technology. With analog films, dark sheets can be used to mask segments of the film to focus attention in specific areas. A handheld viewer is useful for horizontal masking as it blocks out extraneous light (Fig. 5.7a, b).
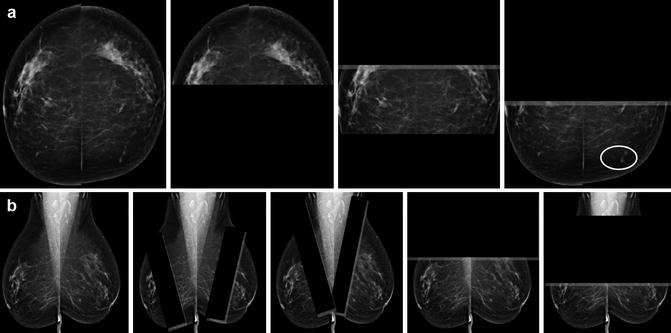
Fig. 5.7
(a) CC view with horizontal masking technique. (b) MLO view with oblique and horizontal masking technique
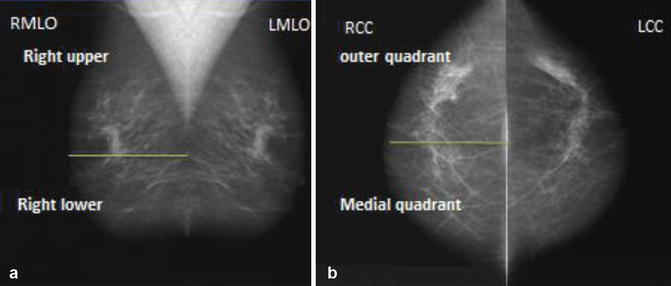
Quadrant Identification
By convention, the markers for labeling are always positioned in the axillary end for both CC and MLO views. The posterior nipple line (PNL) on CC view divides the breast into inner (medial) and outer (lateral) quadrants. The quadrant where the label is placed (axillary end) is the outer (lateral) quadrant. In the MLO, the pectoralis major and the label are the identifiers for the upper quadrant. The area below the PNL is the lower quadrant (Fig. 5.8a, b).