Ciliated columnar epithelium
Many goblet cells
Mechano- and chemoreceptors
Left main bronchus 45° angle of deviation from trachea
No cartilage, with high proportion of smooth muscle in walls
Cuboidal epithelium
Alveolar sacs are blind ended
Total surface area 50–100 m2
Adult trachea (generation 1)
The trachea is lined with columnar ciliated epithelium containing many mucus-secreting goblet cells. It also contains a number of receptors that are sensitive to mechanical or chemical stimuli. These mediate respiratory and cough reflexes.
Major bronchi (generations 2–4)
The major bronchi are named after the lobe or segment supplied. Circumferential cartilage rings support them. The right bronchus is wider than the left and leaves the trachea at about 25° from the tracheal axis, while the angle of the left bronchus is about 45°. Inadvertent endobronchial intubation or aspiration of foreign material is, therefore, more likely to occur in the right lung than the left. The right upper-lobe bronchus branches posteriorly at about 90° to the right main bronchus. Thus, foreign bodies or fluid aspirated by a supine subject usually enter the right upper lobe.
Small bronchi (generations 5–11)
These are smaller versions of the major bronchi, and their mucosa tends to be more cuboidal than columnar towards the periphery. As the number of bronchi increases, the total cross-sectional area increases markedly, with a reduction in the velocity of gas flow and a decrease in airway resistance.
Bronchioles (generations 12–16)
Bronchioles typically have diameters < 1 mm. They are devoid of cartilage and have a high proportion of smooth muscle in their walls in relation to intraluminal diameter. There are 3–4 bronchiolar generations, the final generation being the terminal bronchioles. Goblet cells are not found in bronchioles, and there is a continued gradual transition from ciliated epithelial cells to cuboidal epithelium.
Respiratory areas of the lung
Gas exchange begins in the smaller bronchioles and extends throughout the succeeding generations of airways to the most peripheral spaces, which are the alveoli.
Respiratory bronchioles (generations 17–19)
These are characterised by intermittent alveolar outpockets. Their cuboidal epithelium is thinning and a muscle layer is still present, forming ‘sphincters’ around openings to alveoli.
Alveolar ducts and sacs (generations 20–23)
These are formed from the alveoli that line and form their walls. The sacs differ from the ducts in being blind-ended. The alveolus is the basic unit of gas exchange, being a thin-walled pocket, about 0.3 mm in diameter. There are 300 million alveoli, with a total surface area of 50–100 m2.
Three types of cells cover the alveolar surface:
Type I alveolar cells occupy 80% of the surface for gas exchange. They provide a very thin layer of cytoplasm, spread over a relatively wide area (50 times that of a type II cell). Type I cells are derived from type II cells and are highly differentiated and metabolically limited, which makes them susceptible to injury.
Type II alveolar cells have extensive metabolic and enzymatic capacity and manufacture surfactant. Both type I and II alveolar cells have tight intracellular junctions, providing a relatively impermeable barrier to fluids.
Type III alveolar cells are alveolar macrophages and form an important part of lung defences. They contain proteolytic enzymes, which may be released during lung injury, thus contributing to pulmonary damage.
Alveoli have holes in their walls called pores of Kohn (8–10 μm in diameter), which permit collateral ventilation between neighbouring alveoli. Similarly, larger-diameter (30 μm) ducts allow collateral ventilation between respiratory bronchioles.
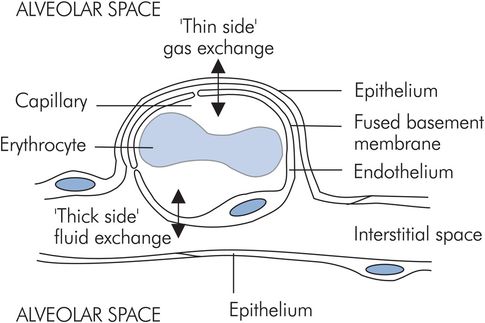
Alveolar–capillary membrane
The alveolar–capillary membrane or ‘blood–gas barrier’ exists between the alveolar space and the capillary lumen, and consists of:
Alveolar epithelium, which is a thin layer of type I alveolar cell cytoplasm
Interstitial tissue, consisting of fused alveolar and endothelial basement membranes
Pulmonary capillary endothelium
In order to allow gas exchange and fluid exchange, the capillaries are located asymmetrically in the alveolar walls, which gives them a ‘thick side’ and a ‘thin side’. The ‘thick side’ is used for fluid exchange with the interstitium, while the ‘thin side’ forms the blood–gas barrier (Figure 17.2).
Alveolar–capillary membrane
The alveolar–capillary membrane performs two conflicting functions:
Gas exchange across the blood–gas barrier
Fluid exchange between alveolar interstitial tissue and the capillary lumen
Blood vessels and lymphatics
The lung is divided into lobes, each supplied by its own artery, vein and bronchus. The arterioles form densely packed sheets of capillaries in the walls of the alveoli, thus matching the large ventilated surface area with an equivalent perfused area. Bronchi receive their own blood supply via bronchial arteries originating directly from the aorta.
Lymphatic drainage is important in the lung because of the magnitude of the perfused area and the effect accumulating interstitial fluid would have on gas exchange. Pulmonary lymphatics travel with blood vessels to the hila, ultimately draining into the thoracic duct.
Lung volumes
The lung can be divided into various volumes. These are identified either by measurements made during lung function testing, or according to the function of the lung in gas exchange.
Lung volumes derived from spirometry
During quiet breathing a small volume of gas is moved in and out of the lungs repeatedly. If a maximal inspiration is taken, followed by a maximal expiration, the volume changes occurring can be recorded using a spirometer. Figure 17.3 shows a typical spirometer trace of these changes.
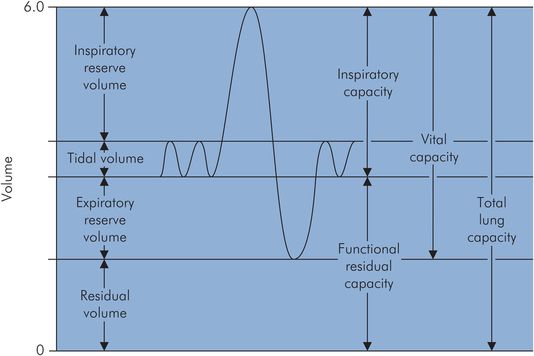
Spirometer trace of lung volumes
Lung volumes vary with age, sex and body size (height more so than weight). The lung volumes are:
Total lung capacity (TLC) – volume of gas present in the lungs at the end of maximal inspiration
Tidal volume (VT) – amount of gas inspired and expired during normal quiet breathing
Inspiratory reserve volume (IRV) – extra volume of gas that can be inspired over and beyond the normal VT
Expiratory reserve volume (ERV) – amount of gas that can be forcefully expired at the end of normal tidal expiration
Residual volume (RV) – amount of gas remaining in the lungs at the end of a maximum forced expiration
Vital capacity (VC) – maximal volume of gas which can be expelled after a maximal inspiration
Functional residual capacity (FRC) – lung volume following expiration during quiet breathing
Some typical values for the above volumes are given in Figure 17.4.
| Lung volume | Male | Female |
|---|---|---|
| TLC | 6000 | 4200 |
| VT | 500 | 500 |
| IRV | 3300 | 1900 |
| ERV | 1000 | 700 |
| RV | 1200 | 1100 |
Vital capacity
Apart from body size, the major factors that determine VC are the strength of the respiratory muscles, and chest and lung compliance.
Vital capacity is an important clinical measure of respiratory sufficiency, particularly in patients with restrictive diseases.
VC < 10 mL kg–1 is indicative of impending respiratory failure.
Functional residual capacity
From the spirometry trace in Figure 17.3 it can be seen that FRC is the lung volume at the end of normal quiet expiration, and is also equal to the sum of ERV + RV. The thoracic cage normally has a resting volume > FRC, while the normal lung has a volume < FRC.
FRC represents the equilibrium point between the tendency of the lungs to collapse and of the thoracic cage to expand. It is not a fixed volume, and it varies with normal respiration as well as depending on gravity and other factors.
FRC is decreased by 20–25% in the supine position and is further decreased by the head-down posture and induction of anaesthesia. Some of the factors affecting FRC are shown in Figure 17.5.
| Factor | Change in FRC |
|---|---|
| Age Posture Anaesthesia Surgery Pulmonary fibrosis Pulmonary oedema Obesity Abdominal swelling Thoracic wall distortion Reduced muscle tone | Decreased |
| Positive intrathoracic pressure Emphysema Asthma | Increased |
Measurement of FRC
Spirometry does not give a value for FRC, nor for TLC and RV. The latter two can be derived if FRC is measured. Two common methods of determining FRC are:
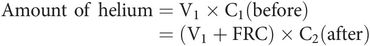
Helium dilution – used to obtain FRC using a spirometer, and an analyser to measure helium concentration. The subject is connected to the spirometer containing a known volume of fresh gas mixture (V1) with a known initial concentration of helium (C1). Normal breathing is allowed to take place through the spirometer until the helium becomes diluted and mixed in the larger combined volume (V1 + FRC) of the spirometer and the respiratory system of the subject. Oxygen is fed into the spirometer to keep the spirometer reading constant, thus compensating for the difference between oxygen consumption and CO2 production. Helium is used because it is virtually insoluble and not metabolised. FRC can be derived by measuring final helium concentration (C2) and using the expression for the amount of helium present before and after as follows:
Body plethysmograph – obtains FRC by placing the subject in a closed chamber and measuring the pressure and volume changes occurring when the subject makes an inspiratory effort. Boyle’s gas law can be applied before and after the inspiratory effort to derive FRC.
Closing capacity
Closing capacity (CC) is the volume at which airway collapse and closure occurs during expiration.
Closing capacity (CC) is important because it can affect gas exchange by virtue of its relationship to FRC. Under normal circumstances FRC is always > CC.
If FRC decreases or CC increases, for example due to loss of lung elasticity from disease, then airway closure may occur at the end of normal expiration in the dependent areas of the lung. Plate-like areas of atelectasis develop in dependent areas of the lungs shortly after induction of anaesthesia. The difference between FRC and CC is also reduced in infants and the elderly.
Dynamic lung volumes
Lung function can also be measured by its dynamic performance during active inflation or deflation. A common test is the recording of expired volumes during forced expiration of a maximal breath. The forced vital capacity (FVC) is the total volume of gas that can be forcibly expired after maximal inspiration. During forced expiration, dynamic compression of the intrathoracic airways occurs, limiting both the rate of expiration and the total amount of gas that can be expelled. The limiting effect may be seen from the expiratory curve of a VC breath, which is linear rather than exponentially declining and is described by the mid-expiratory flow rate, which applies to the gas volume expired between 25% and 75% of the total (MEFR25–75). In clinical practice the volume expired in the first second (FEV1) is often measured as part of an FVC measurement. The ratio (FEV1/FVC) can then be derived, which is a useful index of obstructive airways disease (Figure 17.6).
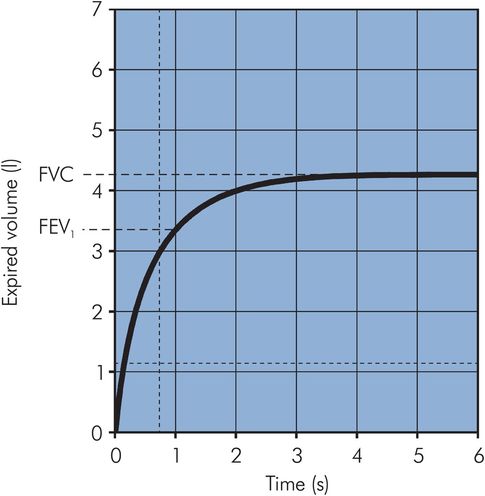
Vitalograph trace
Ventilation
Ventilation describes the process of fresh gas reaching the areas of the lung where gas exchange takes place. Gas exchange is dependent on the volume of gas moved in and out of the lungs per minute. This is referred to as total ventilation (minute ventilation).
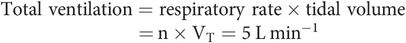
Not all of the gas moving in and out of the lungs takes part in gas exchange, since there are two main parts of the lung: dead space, which does not take part in gas exchange, and alveolar space, in which gas exchange does take place.
Dead space
Dead space refers to the volumes of the lungs which are ventilated but do not take part in gas exchange.
Dead space can be subdivided into anatomical dead space, which corresponds to the conducting airways, and alveolar dead space, which consists of those parts of the lung which are ventilated but not perfused.
The sum of the anatomical and alveolar dead space is the physiological dead space.
Anatomical dead space
This is about 2 mL kg–1 (150 mL in an adult). Early measurements of the volume were obtained by taking casts of the conducting airways, but it may be measured non-invasively by Fowler’s method.
In Fowler’s method the patient takes a single VC breath of 100% oxygen and exhales through a rapid nitrogen analyser. Expired N2 concentration is then plotted against expired volume (Figure 17.7). The initial gas from the dead space (phase I) is free of nitrogen, being pure oxygen, and thereafter the nitrogen concentration increases with the introduction of alveolar gas (phase II) until an ‘alveolar’ plateau is achieved (phase III). The dead space is found by dividing phase II by a vertical line such that area A = area B and measuring the volume from zero.
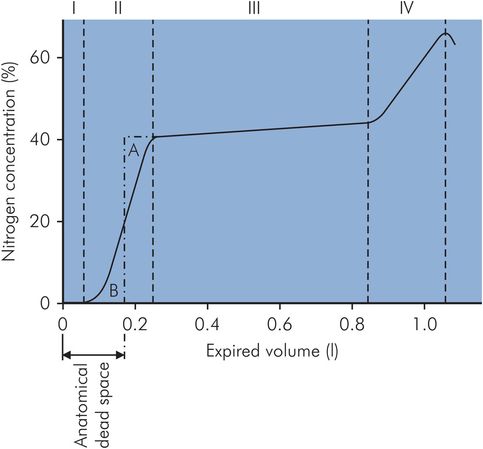
Fowler’s method of dead space measurement
Anatomical dead space will vary with changes in bronchial muscle tone and also with changes in position of the head and neck or the placing of an endotracheal tube. A functional decrease in anatomical dead space occurs at low VT, when gas flow in the airways is laminar.
Alveolar dead space
Alveolar volume
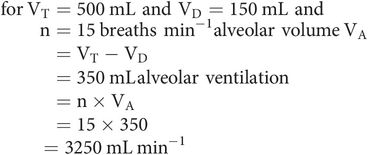
Only fresh gas reaching the alveoli takes part in gas exchange. In each breath, only a portion of each VT will reach the alveoli, because of anatomical dead space (VD). This portion is the alveolar volume (VA).
Alveolar ventilation
Alveolar ventilation is the volume of gas per minute reaching the alveolar spaces. It can be calculated from the respiratory rate (n) and alveolar volume (VA).
Physiological dead space
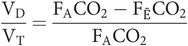
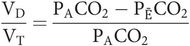
Under normal circumstances, physiological dead space differs very little from the anatomical and may be estimated with Bohr’s equation:

In practice, the partial pressure of the mixed expired gas (PĒCO2) can be measured from a collection of mixed expired gas in a large bag, and the partial pressure in the alveoli (PACO2) can be taken as being equal to that in the arteries (PaCO2).
The total volume of CO2 expired in one breath (VTCO2) may be expressed in two ways.
First, as the product of the alveolar volume and the fractional concentration of CO2 in the alveolar gas (FACO2):
Second, as the product of VT and the concentration of CO2 in the mixed expired gas (FĒCO2):
Thus
Substituting, as
gives
Rearrange to give
As the barometric pressure is the same for expired gas and alveolar gas, the partial pressures in the alveoli (PACO2) and mixed expired gas (PĒCO2) may be substituted instead, yielding
Physiological dead space is dependent on both anatomical and alveolar dead space. Anatomical dead space varies as noted above. Alveolar dead space will be increased whenever areas of the lung become better ventilated than perfused.
Respiratory mechanics
The movement of gas in and out of the lungs is a mechanical process, which is dependent on the following factors:
The respiratory muscles and their actions
The compliance of the chest wall and the lungs
The gas flow in the airways
The respiratory muscles and their actions
Respiration can be divided into inspiration and expiration. Inspiration is normally active while expiration is passive.
Inspiration
During inspiration the lungs can be expanded with two degrees of freedom (Figure 17.8):
Displacement of the abdominal contents by contraction of the diaphragm
Radial expansion of the thoracic cage by the accessory respiratory muscles
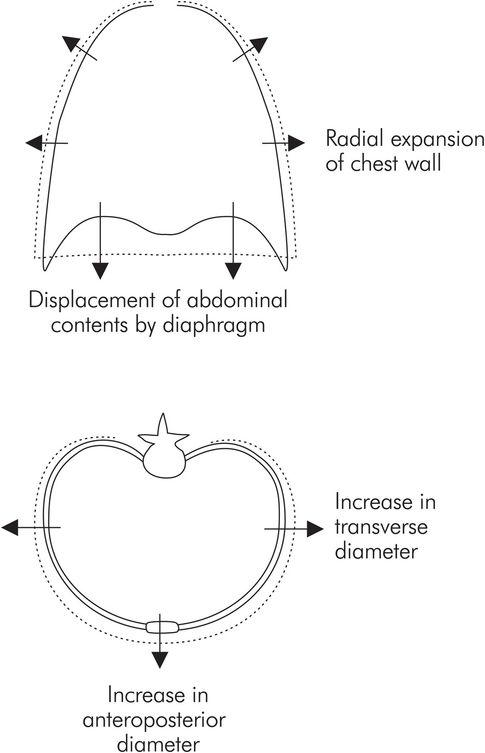
Movement of the chest wall during inspiration
Diaphragm
This is the principal muscle of breathing, accounting for about 75% of the air that enters the lungs during spontaneous inspiration. Contraction of the diaphragm moves abdominal contents downward and forward during each inspiration. Two-thirds of the diaphragmatic fibres are slow twitch, making it relatively resistant to fatigue.
Accessory respiratory muscles
These comprise the external intercostal and strap muscles (sternocleidomastoid, anterior serrati, scalenes). During quiet breathing their contribution to inspiration is small. They act mainly to stabilise the upper rib cage and prevent indrawing. As respiration deepens, the contribution of these muscles increases by elevating the rib cage and expanding it in the lateral and anteroposterior directions.
Expiration
In contrast with inspiration, the diaphragm relaxes during exhalation and the elastic recoil of the lungs, chest wall and abdominal structures compresses the lungs. Forced expiration for a cough or when airway resistance is increased requires the abdominal muscles and the internal intercostals. Paralysis of abdominal muscles produced by regional anaesthesia does not usually influence alveolar ventilation.
Compliance of the chest wall and lungs
Mechanically the respiratory system consists of two main components, the lungs and thoracic cage (including the diaphragmatic surface), which expand and contract together. Thus, the lungs and chest wall move together as a unit. The lung expands in response to a pressure gradient produced across its surface, called the transpulmonary pressure. The transpulmonary pressure is equal to the difference between the airway pressure in the lungs and the pressure on the lung surface, i.e. in between the lung and chest wall. This pressure is the intrapleural pressure.
Intrapleural pressure
The resting position of the lungs and chest wall occurs at FRC. If isolated, the lungs, being elastic, would collapse to a volume < FRC. However, the isolated thoracic cage would normally have a volume > FRC. Since the chest wall is coupled to the lung surface by the thin layer of intrapleural fluid between parietal and visceral pleura, opposing lung and chest wall recoil forces are in equilibrium at FRC. This produces a pressure of about –0.3 kPa in the pleural space. Normal inspiration reduces intrapleural pressure further to –1.0 kPa, but with forced inspiration it can reach negative pressures of –4.0 kPa or more. Intrapleural pressure may be measured by an intrapleural catheter or from a balloon catheter placed in the mid-oesophagus.
Transpulmonary pressure
Normally, during spontaneous respiration, airway pressures in the lung can be approximated to atmospheric pressure. The pressure on the lung surface is the intrapleural pressure, which may reach –1.0 kPa during inspiration. This is equivalent to a distending transpulmonary pressure of +1.0 kPa.
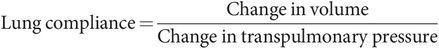
Lung compliance
The lungs expand in response to the transpulmonary pressures produced by the respiratory muscles. The amount of expansion for a given transpulmonary pressure represents the ease with which the lungs expand. This property is measured by the lung compliance, which is the change in lung volume produced by unit change in transpulmonary pressure.
A value for compliance can be obtained from the pressure–volume curve for a normal isolated lung undergoing inflation, as shown in Figure 17.9. It can be seen that the curve is approximately linear over the ‘working range’ of the lung centred around FRC. At FRC, lung compliance is about 200 mL cm–1 H2O. However, compliance is reduced at high lung volumes because the elastic fibres are fully stretched close to their elastic limit, while at low lung volumes compliance is reduced because airway and alveolar collapse occurs, requiring greater pressures to open up the airways and alveoli. Lung compliance may also be reduced by other factors (see below).
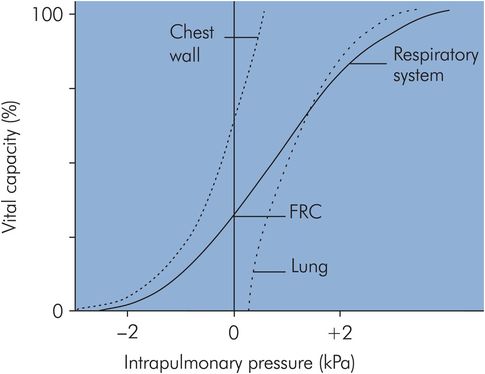
Lung and chest wall compliance
Chest wall compliance
If a pressure–volume curve is plotted for the isolated thoracic cage (Figure 17.9) the chest wall compliance can be obtained from the gradient, and this is also about 200 mL cm–1 H2O at FRC. The chest wall compliance can be reduced by disease, as in ankylosing spondylitis, in which the chest wall can become virtually rigid, giving an extremely low compliance value.
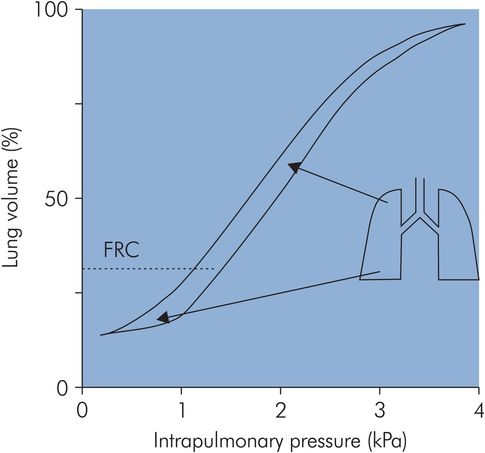
Total respiratory system compliance
In the respiratory system the lungs and chest wall move together during inspiration and expiration. The respiratory system compliance is, therefore, the combination of chest wall and lung compliances.
If lung compliance (CL) = 200 mL cm–1 H2O, and chest wall compliance (CW) = 200 mL cm–1 H2O, then respiratory system compliance (CR) is given by
The effect of combining lung and chest wall compliances to give the overall respiratory system pressure–volume curve is shown in Figure 17.9. Here it can be seen how the respiratory system compliance at FRC (gradient of the curve) is less than the individual gradients for lung or chest wall.
Measurement of respiratory system compliance
Compliance can be obtained from the gradient of a pressure–volume curve plotted for the respiratory system. However, this leads to two different values depending on the measurement technique.
Static compliance
To obtain static compliance a pressure–volume curve is plotted by applying known distending pressures to the respiratory system, and measuring the corresponding changes in volume produced. Appropriate time must be allowed between measurements for equilibration of the lung, when all gas movement has ceased. The static compliance is then given by the gradient of this pressure–volume curve based on static measurements.
Dynamic compliance
To measure dynamic compliance a pressure–volume curve is plotted continuously during spontaneous breathing or mechanical ventilation. In this case the changes in volume and pressure are recorded continuously as analogue signals with no pause between measurements. The dynamic compliance is derived from the gradient of the continuous pressure–volume curve.
The value for dynamic compliance is usually lower than the static compliance.
This is because:
Airflow may not have ceased completely within the lung in response to pressure changes, particularly in diseased lungs. Further volume increases can follow gas movement from less distensible areas of the lung to more distensible areas (‘pendelluft’).
Relaxation of tissues occurs with applied pressures that are sustained. This is due to the so-called ‘viscoelastic’ nature of tissues. This property of tissues, which mimics the action of hydraulic dampers in mechanical systems, means that when stretching forces are applied to real tissues they do not respond instantaneously, but stretch gradually in a viscous manner.
The intrapulmonary pressure will be less than the applied airway pressure, because of airway resistance and inertia of the respiratory system. This causes an underestimation of the compliance.
The resultant effect of making dynamic measurements is that airway pressures in the dynamic case will be greater than those in the static case at any given lung volume. This means that the value for dynamic compliance will always be less than the static compliance.
Factors decreasing respiratory system compliance
Respiratory system compliance is usually maximum or optimal at FRC, and is decreased by both physiological factors and disease. Disease may affect both lung compliance (CL) and chest wall compliance (CW). Some examples of these factors are shown in Figure 17.10.
| Factor | Change in CR |
|---|---|
| FRC | |
| • Normal | Maximum |
| • High | Decreased |
| • Low | Decreased |
| Posture | |
| • Standing | Maximum |
| • Supine | Decreased |
| Age | |
| • Infant | Decreased |
| • Elderly | Decreased |
| • Pregnancy | Decreased |
| Disease | |
| • ARDS | Decreased (↓ CL) |
| • Pulmonary oedema | Decreased (↓ CL) |
| • Ankylosing spondylitis | Decreased (↓ CL and ↓ CW) |
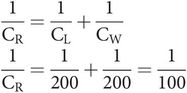
Pressure–volume loop for the respiratory system
If a pressure–volume curve for the respiratory system is plotted through a cycle of inspiration and expiration a ‘loop’ is obtained, as the inspiratory and expiratory limbs of the curve do not exactly coincide (Figure 17.11). This ‘loop’ effect is known as hysteresis. The area of the loop represents wasted energy, which occurs as a result of viscous losses during the stretching and recoil of the tissues, and also the frictional losses due to airway resistance. A factor that reduces this wasted energy and hence improves the efficiency of the breathing cycle is the lining of surfactant in the alveoli.
Surfactant
Surfactant is a phospholipid-based substance secreted by the alveolar type II cells, which lines the alveoli and acts by markedly reducing surface tension.
Surfactant has the following effects:
Reduction of surface tension, which helps to even out the distribution of compliance and hence ventilation. Without surfactant, alveoli with low resting volumes are significantly more difficult to expand than those with larger resting volumes. This effect is important in neonates, in whom deficiency of surfactant is associated with infant respiratory distress syndrome.
Stabilisation of small alveoli. In a bubble wall, surface tension acts to shrink or collapse the bubble. A similar effect is seen in an alveolus. The smaller the alveolus the greater the tendency to collapse. Because of this, small alveoli tend to collapse by forcing their gas into larger communicating alveoli. The reduction of surface tension by surfactant decreases this effect.
Reduction of the energy expended as heat during each inspiratory–expiratory cycle, i.e. the hysteresis area of the pressure–volume loop is decreased.
Surfactant also keeps the alveoli dry by reducing the ‘suction’ effect created by surface tension as it tries to collapse alveoli. Surface tension creates negative interstitial pressures as it tries to shrink alveoli, thus drawing fluid from capillaries into the air spaces.
Distribution of ventilation
When inspiration occurs the fresh gas entering the lung is not evenly distributed. Traditional teaching has upheld for decades that ventilation is distributed unevenly, with the majority of fresh ventilation passing to the more dependent regions of the lung. This model is based on the assumption of gravitationally determined distribution of lung perfusion, which indirectly determines local lung compliance and leads to ventilation inequalities. Thus both ventilation (V̇) and perfusion (Q̇) become gravitationally determined, ensuring optimum ventilation/perfusion (V̇/Q̇) matching.
More recent work, however, challenges this simple model of ventilation distribution by demonstrating significant variations in distribution in sections at the same vertical level, i.e. in areas subject to the same gravitational effect. In addition, the dependence of perfusion on gravitational effects is also challenged. This leads to a different concept of ventilation and perfusion distribution and matching that is based on the structural heterogeneity of the lung.
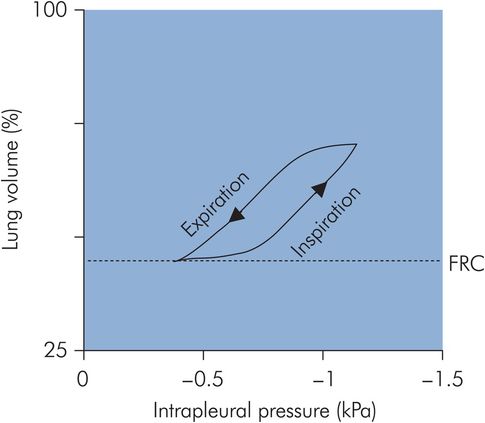
Gravitational model for distribution of ventilation and perfusion
The mechanism determining the preferential distribution of ventilation to the most dependent regions of the lung during spontaneous breathing depends on the basic assumption of a gravitationally defined distribution of perfusion throughout the lung. Effectively the lung behaves as a continuous volume of fluid with a hydrostatic pressure gradient increasing from apex to base in the upright position. In the upright adult the intrapleural pressure at the base of the lung is approximately 0.7 kPa greater than the pressure at the apex. This variation in intrapleural pressure means that the alveoli will also vary in degree of distension, and correspondingly the alveoli will vary their position on the pressure–volume curve for the lung (Figure 17.12). The more dependent alveoli will be less distended, and located on the linear part of the pressure–volume curve, compared with the apical alveoli, which are over-distended and situated on the top part of the pressure–volume curve. Thus at the base of the lung the alveolar compliance (gradient of the pressure–volume curve) is greater than that at the apex. Consequently, during inspiration, greater expansion of alveoli in the lower parts of the lung occurs, and ventilation is preferentially directed to the base. The end result is to direct ventilation to the areas of the lung with the most perfusion. In addition to the effects of gravity, airway resistance also plays a part in directing ventilation preferentially to the bases, since airway resistance is lower to the dependent areas of the lung.
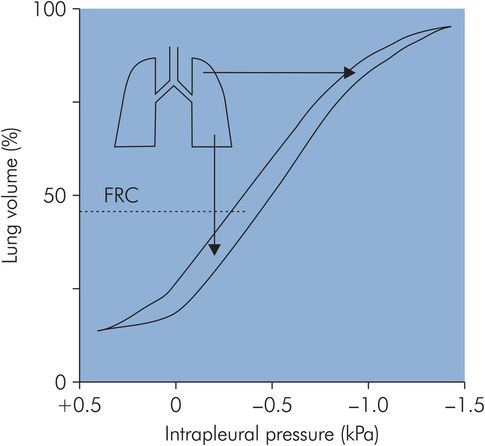
Compliance during spontaneous ventilation
This distribution of ventilation during spontaneous breathing contrasts with the situation when a patient is undergoing artificial ventilation. Under these circumstances the FRC is reduced, and this causes a reversal of the distribution of alveolar compliances, producing preferential ventilation of non-dependent areas (Figure 17.13).
Compliance during mechanical ventilation
Structural model for distribution of ventilation and perfusion
The traditional model for distribution of ventilation, as described above, is based on gravity being the most important determinant of local perfusion and hence indirectly regional ventilation. The use of enhanced CT scanning techniques suggests that regional variation of ventilation follows a more centripetal pattern rather than the vertical gravitationally determined distribution described above. Similarly, studies under variable and zero gravity conditions refute the predominant effect of gravity in determining local perfusion and ventilation, and offer the following observations:
Significant heterogeneity of ventilation and perfusion occurs at the same vertical level (iso-height), i.e. where gravitational effects are excluded.
The variability in perfusion and ventilation at iso-height level may be much greater than that observed over a vertical (gravitational) gradient.
Heterogeneity of perfusion and ventilation occurs under zero gravity conditions.
Postural changes fail to produce predicted changes in ventilation and perfusion, e.g. total lung perfusion in the dependent lung when in the left lateral position is less than in the non-dependent lung.
A more recent concept suggests that the main determinant of regional perfusion differences is regional vascular resistance, which will be largely influenced by changes in lung volume. Ventilation and perfusion remain matched in the lungs by virtue of their development as a twinned system of branching airways and pulmonary vessels. In this way, although regional variations in perfusion may occur independently of gravity, the distribution of ventilation will tend to vary in parallel since the main determinant of regional ventilation will be local airways resistance. The variability of perfusion and ventilation throughout the lung is attributed mainly to the asymmetrical branching nature of the airways and vascular trees, rather than to the gravitational gradient of the traditional model.
Related posts:


Stay updated, free articles. Join our Telegram channel

Full access? Get Clinical Tree


