Respiratory Monitoring during Mechanical Ventilation
Todd W. Sarge
Ray Ritz
Daniel Talmor
Respiratory function may be simply classified into ventilation and oxygenation, where ventilation and oxygenation are quantified by the ability of the respiratory system to eliminate carbon dioxide and form oxyhemoglobin, respectively. The goal of respiratory monitoring in any setting is to allow the clinician to ascertain the status of the patient’s ventilation and oxygenation. The clinician must then use these data appropriately to correct the patient’s abnormal respiratory physiology. As with all data, it is imperative to remember that interpretation and appropriate intervention are still the onus of the clinician, who must integrate these data with other pieces of information (i.e., history and physical exam) to make a final intervention. In the acutely ill patient, the principal intervention with regard to respiratory function and monitoring typically often involves the initiation, modification, or withdrawal of mechanical ventilatory support. This chapter will focus on respiratory monitoring for the mechanically ventilated patient.
Mechanical ventilation entails the unloading of the respiratory system via the application of positive pressure to achieve the goal of lung insufflation (i.e., inspiration) followed by the release of pressure to allow deflation (i.e., expiration). These simplified goals of mechanical ventilation are achieved in spite of complex and dynamic interactions of mechanical pressure with the physical properties of the respiratory system, namely elastance (E) and resistance (R). Furthermore, the patient’s neurologic and muscular condition can also affect the goals of respiration, and they need to be monitored and evaluated as well. This chapter will focus on three specific areas in monitoring the mechanically ventilated patient: (a) the evaluation of gas exchange; (b) respiratory mechanics, and (c) respiratory neuromuscular function.
Gas Exchange
Basic Physics of Gas Exchange
As mentioned, the primary function of the respiratory system is gas exchange (i.e., elimination of carbon dioxide while instilling oxygen to form oxyhemoglobin). Inadequate ventilation and oxygenation within the intensive care setting are typically caused by hypoventilation, diffusion impairment, or shunt and ventilation-perfusion mismatch.
Hypoventilation is defined as inadequate alveolar ventilation, and it is commonly caused by drugs, neurologic impairment, or muscle weakness/fatigue, which results in hypercarbia, according to the following equation:
PaCO2 = ([V with dot above]CO2/[V with dot above]A) × k,
where PaCO2 is the arterial partial pressure of carbon dioxide, [V with dot above]co2 is the production of carbon dioxide in the tissues, [V with dot above]A is alveolar ventilation, and k is a constant. Fortunately, the institution of mechanical ventilatory support readily corrects hypoventilation while the underlying cause is determined and corrected.
Diffusion impairment results from inadequate time for the exchange of oxygen across the capillary-alveolar membrane. This may occur due to pathologic thickening of the membrane or high output cardiac states such as sepsis. However, the relative clinical significance of diffusion impairment in the intensive care unit (ICU) is debatable. This is because the hypoxemia that results from the acute exacerbation of diffusion impairment is usually corrected by supplemental oxygen therapy. Furthermore, PaCO2 is rarely affected by diffusion impairments because it is highly soluble and is eliminated in multiple forms, such as bicarbonate.
The most common cause of hypoxemia in the ICU is ventilation-perfusion ([V with dot above]/[Q with dot above]) mismatch. One manifestation of [V with dot above]/[Q with dot above] mismatch is shunting. The true shunt fraction is the amount of cardiac output that results in venous blood mixing with end-arterial blood without participating in gas exchange. This has little effect on carbon dioxide tension; however, increases in shunt can lead to hypoxemia. The true shunt is expressed via the shunt equation as follows:
Qs/Qt = (Cc – Ca)/(Cc – Cv),
where Qs and Qt are the shunt and total blood flows, and Cc, Ca, and Cv represent the oxygen contents of end-capillary, arterial, and mixed venous blood, respectively. The concentration of mixed arterial and venous blood is calculated according to the oxygen content equation:
Cx = (1.34 × Hb × SxO2) + (PO2 × 0.003),
where Cx and Sxo2 are the oxygen content and saturation of arterial and venous blood, respectively. The oxygen content of end-capillary blood is estimated by the alveolar gas equation as follows:
Cc = (Patm – PH2O) × FiO2 + PaCO2/RQ,
where Patm and PH2O are the partial pressures of the atmosphere and water (typically 760 and 47 at sea level), respectively, while FiO2 is the concentration of inspired oxygen and RQ is the respiratory quotient. The significance of true shunt is the fact that it is not amenable to supplemental oxygen therapy. Shunted blood reenters the circulation and dilutes the blood that has been oxygenated by the lungs, resulting in a lower partial pressure of oxygen, Pao2 in the arterial system. Increasing the Fio2 will not improve oxygenation since the blood does not meet alveolar gas.
Ventilation-perfusion ([V with dot above]/[Q with dot above]) mismatch is the result of inequality of the normal ventilation perfusion ratio within the lung. [V with dot above]/[Q with dot above] mismatch is a spectrum of abnormal ratios signifying inadequate gas exchange at the alveolar level. It is possible with supplemental oxygen to overcome hypoxemia that is caused by an abnormal ratio of ventilation and perfusion, which differentiates this form of hypoxemia from true shunt. However, in the extreme, as the [V with dot above]/[Q with dot above] ratio in any alveolus approaches zero (i.e., ventilation approaches zero), it approaches true shunt as described above. At the other end of the spectrum, as the ratio in any alveolus approaches infinity (i.e., as perfusion approaches zero), it becomes physiologic “dead space,” which denotes alveoli that are ventilated but not perfused. Dead space will be described in greater detail later in this chapter.
Direct Blood Gas Analysis
Monitors of gas exchange in the mechanically ventilated patient are typically directed at measurements of gas content and their gradients from the ventilator circuit to the alveolus and from the alveolus to the end-artery. As with most monitors, sources of error abound at many points as gases flow down their concentration gradients. The most accurate assessment of gas exchange is direct measurement from an arterial blood sample. This provides the partial pressures of carbon dioxide (PaCO2) and oxygen (PaO2) in the blood as well as the pH, base deficit, and cooximetry of other substances such as carboxyhemoglobin and methemoglobin. Advantages of arterial blood gas (ABG) analysis include the fact that it is a fairly exact representation of the current state of the patient with regard to acid-base status, oxygenation, and ventilation. However, the limitations of blood gas analysis as a tool for monitoring gas exchange are numerous, including the fact it is invasive, wasteful (blood), and noncontinuous (i.e., it is only a snapshot of the patient’s condition at the time the ABG is drawn).
Central and peripheral venous blood gas sampling has been proposed as a surrogate to arterial blood for monitoring pH, PCO2, and base deficit [1]. The obvious advantage is mitigation of the invasiveness (i.e., patients are not required to have arterial access or punctures), while the disadvantages are the need for correlation and inability to assess oxygenation. With the exception of patient’s undergoing cardiopulmonary resuscitation [2], good correlation has been observed between arterial and venous pH and PCO2 in patients with acute respiratory disease, with one author noting an average difference of 0.03 for pH and 5.8 for PCO2 [1]. A recently published study in mechanically ventilated trauma patients also demonstrated good correlation between arterial and central venous pH, PCO2, and base deficit; however, the authors concluded that the limits of agreement (-0.09 to 0.03 for pH and -2.2 to 10.9 for PCO2) represented clinically significant ranges that could affect management and therefore should not be used in initial resuscitation efforts of trauma patients [3].
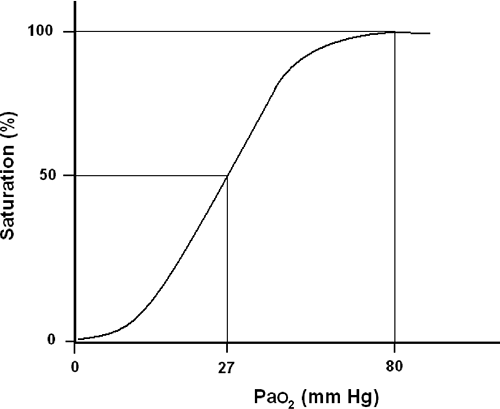 FIGURE 33-1. This is a schematic demonstrating a normal hemoglobin dissociation curve with 50% saturation at Pao2 of 27 mm Hg and approaching 100% saturation at a Pao2 of 80 mm Hg. |
Pulse Oximetry
Without question, pulse oximetry has been the most significant advance in respiratory monitoring in the past three decades. Based on established oxyhemoglobin dissociation curve (Fig. 33-1), pulse oximetry allows for the continuous, noninvasive estimate of a patient’s oxyhemoglobin and is expressed as a percentage of total hemoglobin [4, 5, 6, 7, 8, 9, 10, 11, 12, 13, 14, 15, 16, 17, 18, 19, 20, 21, 22, 23, and 24]. A detailed explanation of pulse oximetry including the physics and limitations is provided in Chapter 27.
Expired Carbon Dioxide Measurements
Capnometry is the quantification of the carbon dioxide concentration in a sample of gas. Capnography is the continuous plotting of carbon dioxide over time to create a waveform (Fig. 33-2). When capnography is performed on continuous samples of gas from the airway circuit, a waveform is created whereby the plateau is reported as the maximum pressure in millimeters Hg and termed end-tidal carbon dioxide, or PetCO2. Although continuous capnography has limited usefulness in the ICU, capnometry has many clinical uses such as early detection of esophageal intubation [25, 26, 27, 28, 29, 30, 31, 32, 33, 34 and 35]. For a detailed explanation of capnography and its uses, please refer to Chapter 27.
Dead Space Measurements
Dead space is defined as any space in the respiratory system that is ventilated but not perfused, such that no gas exchange can occur. Measurement of dead space is a marker of respiratory efficiency with regard to carbon dioxide elimination. Dead space can be subdivided into several categories including alveolar and anatomic. Anatomic dead space is the sum of the inspiratory volume that does not reach the alveoli and, therefore, participate in gas exchange. For mechanically ventilated patients, the anatomic dead space includes the proximal airways, trachea,
endotracheal tube, and breathing circuit up to the Y-adapter. In normal human subjects, anatomic dead space is approximately 2 to 3 times the ideal body weight in kilograms, or 150 to 200 cc. Alveolar dead space is the conceptual sum of all alveoli that are ventilated but not participating in gas exchange, otherwise described as West Zone 1 [36]. Physiologic dead space (Vd) is the sum of anatomic and alveolar dead space and is usually expressed as a ratio of the total tidal volume (Vt) and can be calculated at the bed side using the Bohr equation:
endotracheal tube, and breathing circuit up to the Y-adapter. In normal human subjects, anatomic dead space is approximately 2 to 3 times the ideal body weight in kilograms, or 150 to 200 cc. Alveolar dead space is the conceptual sum of all alveoli that are ventilated but not participating in gas exchange, otherwise described as West Zone 1 [36]. Physiologic dead space (Vd) is the sum of anatomic and alveolar dead space and is usually expressed as a ratio of the total tidal volume (Vt) and can be calculated at the bed side using the Bohr equation:
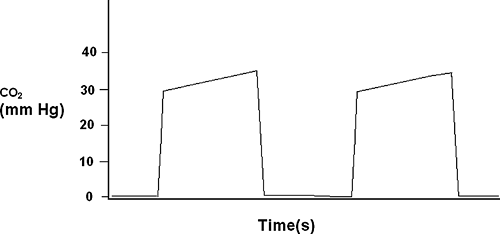 FIGURE 33-2. This is a schematic representation of a capnograph waveform with the expiratory plateau delineating the end-tidal co2 between 30 to 40 mm Hg. |
Vd/Vt = PaCO2 – PaCO2/PaCO2,
where PaCO2 is the partial pressure of carbon dioxide and PaCO2 is the partial pressure of carbon dioxide in the alveoli. PaCO2 is often estimated as either end-tidal carbon dioxide, PetCO2 or more accurately as mixed expired carbon dioxide, PeCO2; however, the latter is more difficult to measure, often requiring metabolic monitors. Volume capnography is a novel and simple approach to estimating PaCO2, involving measurements of carbon dioxide at the Y-adapter, and has been shown to correlate with more complex methods of metabolic monitoring [37].
Physiologic dead space, Vd/Vt, is often increased in critical illnesses that cause respiratory failure, such as acute respiratory distress syndrome (ARDS) and chronic obstructive pulmonary disease (COPD). Vd/Vt can also increase with dynamic hyperinflation, or auto-PEEP, as well as overaggressive extrinsic PEEP due to overinflated alveoli impeding pulmonary artery blood flow, effectively increasing West Zone 1 volume. Serial measurements of Vd/Vt have been shown to correlate with outcome in ARDS [38] and have been used to monitor the degree of respiratory compromise in critically ill patients [39]. However, these data have not translated into changes in treatment and may only be prognostic for fibroproliferative ARDS, which is known to occur in a subset of these patients that fail standard treatment. Furthermore, Mohr et al. [40] found no appreciable difference in Vd/Vt while studying a series of post-tracheostomy patients successfully weaned from mechanical ventilation versus those who had failed weaning.
Pulmonary Mechanics
Modern ventilators allow measurement of airway pressures (Paw), volumes (V), and flows ([V with dot above]). Integration of these measurements allows assessment of the mechanical functions of the respiratory system. These mechanical functions are influenced by various disease states, and understanding these relationships may allow delivery of more appropriate ventilator support.
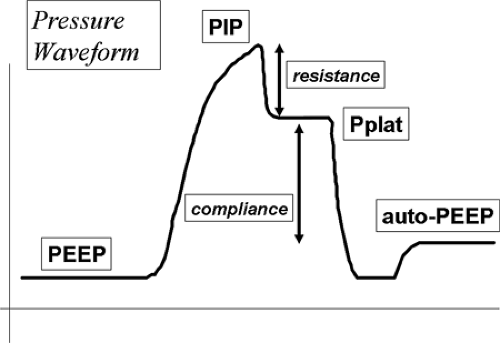 FIGURE 33-3. Schematic drawing of an airway pressure waveform delineating PEEP, auto-PEEP, Peak inspiratory pressure (PIP), plateau pressure (Pplat), resistance, and compliance. |
Rapid airway occlusion during constant flow inflation in a relaxed, ventilator-dependent patient produces a typical picture as depicted in Figure 33-3 [41]. Rapid airway occlusion at end inflation results in a drop in Paw from the peak value (Ppeak) to a lower initial value (Pinit) and then a gradual decrease over the rest of the inspiratory period until a plateau (Pplat) is recorded. Pplat measured at the airway represents the static end-inspiratory recoil of the entire respiratory system [42]. Using an esophageal balloon catheter and measuring the pressure in the esophagus (Pes), it is possible to further partition all of these pressures into their lung (Ptp) and chest wall components (Ppl) using the equation:
Paw = Ptp + Pes.
These partitioned pressures are presented graphically in Figure 33-4.
Compliance and Elastance
The static compliance of the respiratory system and its reciprocal, elastance of the respiratory system, are measured clinically using the end-inspiratory airway occlusion method. The
equation for elastance of the respiratory system (Est,rs) is based on the driving pressure between plateau pressure (Pplat) and the intrinsic PEEP (PEEPi). This number is then divided by Vt:
equation for elastance of the respiratory system (Est,rs) is based on the driving pressure between plateau pressure (Pplat) and the intrinsic PEEP (PEEPi). This number is then divided by Vt:
Est,rs = (Pplat – PEEPi)/Vt.
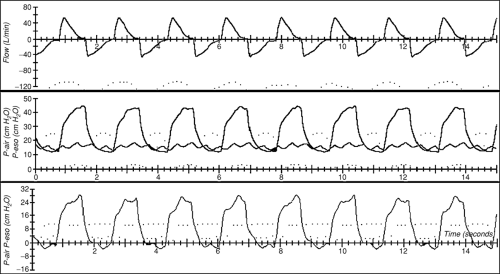 FIGURE 33-4. Esophageal pressure tracing (P-eso) can be seen super-imposed on the airway pressure tracing (P-air) during pressure control ventilation (PCV). Transpulmonary pressure has been estimated as the difference between these pressures with specific assumptions. |
Est,rs may also be separated into its lung and chest wall components by applying this equation to the Ptp and Pes tracings obtained using Pes tracings (see Fig. 33-4). The relative contributions of the lung and chest wall to the total elastance may be dependant on the etiology of respiratory failure. By way of example, pulmonary edema, either cardiogenic or as a result of ARDS, will lead to an elevated lung Est and reduced compliance. ARDS of a nonpulmonary origin, sepsis as an example, may also lead to edema of the chest wall and abdominal distension. Both of these will lead to an additional increase in the Est,rs as a result of an increase in the elastance of the chest wall.
Dynamic Compliance
Effective dynamic compliance can be derived by dividing the ventilator-delivered Vt by [Ppeak – PEEP] [43]. Ppeak is influenced by all of the resistive and elastic pressure losses of the respiratory system and endotracheal tube and therefore cannot be considered a true measure of thoracic compliance. Alternatively, dynamic elastance of the respiratory system (Edyn,rs) can be obtained by dividing the difference in Paw at points of zero flow by the delivered Vt. Accordingly, Edyn,rs can be computed according to the formula:
Edyn,rs = Pinit – PEEPi/Vt.
Dynamic measurements of compliance and elastance have generally not been shown to be useful in predicting an individual patient’s ability to breathe spontaneously [44].
Resistance
Airway resistance can be measured in ventilator-dependent patients by using the technique of rapid airway occlusion during constant flow inflation. The maximum resistance (Rmax) of the respiratory system is calculated by:
Rmax = [Ppeak – Pplat]/[V with dot above].
And the minimum resistance (Rmin) of the respiratory system can be computed by dividing
Rmin = [Ppeak – Pinit]/[V with dot above].
Rmin is considered to reflect ohmic airway resistance, while the difference between Rmax and Rmin (ΔR) reflects both the viscoelastic properties (stress relaxation) and time-constant inhomogeneities within the respiratory tissues (pendelluft).
Pressure Volume Curves
Static Measurements of the Pressure-Volume Curve
The gold standard of pressure-volume (P-V) curve measurement is the super-syringe method. Using a large calibrated syringe, increments of volume of 50 ± 100 mL gas are used to inflate the lung up to a total volume of 1,000 ± 2,000 mL. After each increment, the static airway pressure is measured during a pause lasting a few seconds during which there is no flow, and the pressure is the same in the entire system from the super-syringe to the alveoli. The lung is then deflated in the same manner and
the pressure at each increment of gas is recorded and the inspiratory and expiratory P-V curves are plotted. Continued oxygen uptake from the blood during this slow inflation-deflation cycle, coupled with equalization of the partial pressure of CO2 in the blood and alveoli, will lead to a decrease in the deflation volume as compared to the inflation volume of gas. This artifact may appear to contribute to the phenomena of hysteresis. The more important mechanical cause of hysteresis is based on the slow inflation of the lung during the P-V curve maneuver. This slow inflation recruits or opens up areas of the lung with slow time constants and collapsed alveoli. This again will lead to a decreased expiratory volume and hysteresis.
the pressure at each increment of gas is recorded and the inspiratory and expiratory P-V curves are plotted. Continued oxygen uptake from the blood during this slow inflation-deflation cycle, coupled with equalization of the partial pressure of CO2 in the blood and alveoli, will lead to a decrease in the deflation volume as compared to the inflation volume of gas. This artifact may appear to contribute to the phenomena of hysteresis. The more important mechanical cause of hysteresis is based on the slow inflation of the lung during the P-V curve maneuver. This slow inflation recruits or opens up areas of the lung with slow time constants and collapsed alveoli. This again will lead to a decreased expiratory volume and hysteresis.
Semistatic Measurements of the Pressure-Volume Curve
There are two methods for obtaining semistatic measurements of the P-V curve. These methods do not require the specialized skill and equipment needed for the super-syringe technique. The multiple occlusion technique uses a sequence of different-sized volume-controlled inflations with an end inspiratory pause [45,46]. Pressure and volume are plotted for each end inspiratory pause to form a static P-V curve. If expiratory interruptions are also done, the deflation limb of the P-V curve may also be plotted. This process may take several minutes to complete, but yields and the results are close to those obtained by static measurements. The second method is the low-flow inflation technique. This technique uses a very small constant inspiratory flow to generate a large total volume. The slope (compliance) of the curve is parallel with a static P-V curve only if airway resistance is constant throughout the inspiration. This is likely not the case as the low flow lessens airway resistance. The low flow also causes a minimal but recognizable pressure decrease over the endotracheal tube, which means that the dynamic inspiratory pressure volume curve will be shifted to the right [47,48]. The long duration of the inspiration produces the same artifacts as the super-syringe technique, which are represented as hysteresis. Another drawback of these static and semistatic methods is that they require stopping therapeutic ventilation while the maneuver is performed. The question has been raised, therefore, if these maneuvers are relevant in predicting the mechanical behavior of the lung under dynamic conditions, where resistance and compliance depend on volume, flow, and respiratory frequency.
Related posts:


Stay updated, free articles. Join our Telegram channel

Full access? Get Clinical Tree


