Chapter 31 Physics and technology of ultrasound
What is ultrasound?
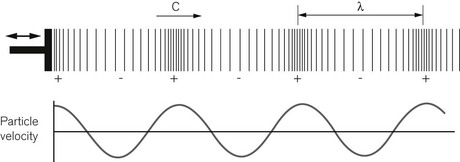
Diagnostic ultrasound uses high-frequency sound waves sent into the body, to build up an image of the anatomical structures within from the detected echoes. A sound wave is what is known as a longitudinal compression wave (Fig. 31.1). It may be formed by some sort of piston, a loudspeaker for example, that pushes forward onto the molecules of air in front of it forming a region of higher density and pressure immediately in front of the piston. These molecules then push on to the molecules in front of them and so on, so the pulse of high pressure starts to move forward away from the piston. Meanwhile the piston moves backwards creating a region of low density and pressure in the molecules in front of it. By repeatedly moving forwards and backwards, a succession of high pressure followed by low-pressure regions move away from the piston forming a longitudinal pressure wave, a sound wave. If we were able to see just one molecule in front of the piston, we would see it oscillate forwards and backwards about an average position, like a child on a swing. Hence the molecules of the medium carrying the sound wave stay in approximately the same place, but the disturbance, i.e. the change in pressure, travels out, away from the piston.
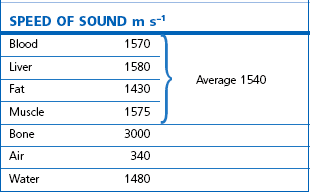
For any given medium the speed of sound is constant. This means that a high frequency implies a short wavelength and low frequency a long wavelength. Table 31.1 gives examples of the speed of sound travelling through different tissues, and also air and water. The speed of sound depends on how rigid a material is, that is: how strongly the molecules are bound together, and how massive the molecules are, i.e. how easy they are to move. In air the molecules are very poorly connected with one another and the speed of sound is low at 340 m s−1. Bone is a very rigid material and the speed of sound is fast at 3000 m s−1. Water has a speed of sound somewhere in between these figures: 1480 m s−1 at 20°C. The speed of sound for all the soft tissues in the body shows little variation, with values being not very different from that of water. For the purposes of image formation using ultrasound, the speed of sound in the different soft tissues can be approximated by an average value of 1540 m s−1 (+/− 10%) and this is the value of c that is used for ultrasound imaging.
Ultrasound is any sound with a frequency that is higher than the range of our hearing, which in a young person runs from 20 Hz to 20 kHz. For diagnostic imaging the frequencies used are far higher than anything we can hear and are in the range of 3–15 MHz. Putting these frequencies into the speed of sound equation, and using a speed of sound of 1540 m s−1, we see that the wavelength of ultrasound in soft-tissue ranges from 0.5 to 0.1 mm. The reason for using these very high frequencies is to produce narrow beams of sound (see below) and to image with high resolution so that small structures within the body can be viewed.
Pulse echo principle
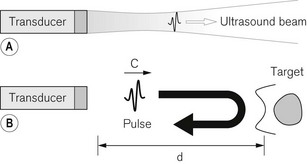
Ultrasound imaging uses the pulse-echo principle in a similar manner to sonar on a submarine (Fig. 31.2). A short pulse of sound is sent into the body and echoes reflected off anatomical structures in the tissues return to the transducer. The received signals are used to build up an image of the anatomy. The pulse transmitted into the body is typically only two to three cycles long and lasts just less than 1 µs. If the transducer were to produce a continuous wave of sound there would be a beam of sound travelling into the body as described before (Fig. 31.2A). When a short pulse is used, the pulse travels down the same beam shape. In other words, the ultrasound beam can be thought of as the corridor down which the pulse travels and from which the echoes will arise. Any tissue lying outside the beam, in general will not see the pulse and not send any echoes back to the transducer. The pulse travels at 1540 m s−1 towards the target at some depth (d) in tissue. An echo is reflected from the target which travels back to the transducer at the same speed. The echo pulse has, therefore, travelled the distance twice, from the transducer to the target and back, and the time of arrival of the echo back at the transducer Δt is given by equation:
For a speed of sound of 1540 ms−1, the go and return time of the pulse is 13 µs per cm. Because the machine can assume a constant value of sound of 1540 m s−1, the scanner can use the timing of echo arrival to position echoes in the image and mark the depth axis of the display in centimetres depth.
The ultrasound transducer
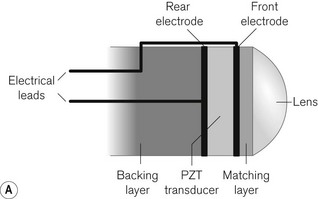
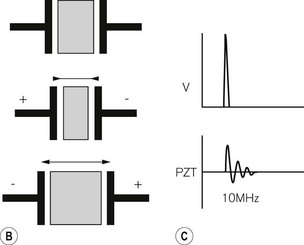
The transducer plays the role of the piston in producing the sound wave (Fig. 31.3A). It converts electrical energy into sound energy and vice versa. Ultrasound transducers use a piezoelectric material to produce a sound wave. This is a material having the property that when an electrical voltage is placed across it, it changes shape and contracts in the direction of the applied voltage. If the polarity of the voltage is reversed, the piezoelectric material expands. The process is reciprocal. If the material is squeezed, a voltage forms across it, and if the material is stretched, the voltage produced has the opposite polarity. A naturally occurring example of a piezoelectric material is quartz. This is what forms the resonator in a quartz clock. Ultrasound transducers usually use a ceramic material called lead zirconate titanate (PZT). A piece of this material is used whose thickness is such that it has a natural resonance at the frequency of ultrasound we wish to use, say 10 MHz. The PZT element has electrodes on its faces. When a high-voltage spike is applied to the electrodes the PZT is made to rapidly contract. It then vibrates at its resonant frequency, like an empty wine glass struck with a fingernail. In order to make a very short pulse the back of the PZT element has a layer of sound absorbing material (backing layer) stuck to it to reduce the ringing (Fig. 31.3B). This shortens the pulse in a similar way to striking the wine glass, but with the fingers of the other hand pinching the rim of the glass.
Image formation
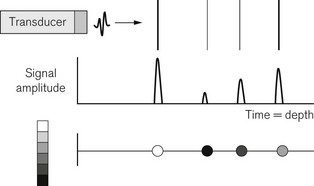
The way a modern ultrasound scanner forms an image may be considered in three stages. Firstly, if an ultrasound beam is directed into the body towards a series of reflecting targets the output from the received echoes can be displayed as a series of peaks whose time of arrival depends on the depth equation and whose amplitude depends on the reflecting strength of the targets. A strong reflector gives a high amplitude signal and a weak reflector gives a small signal. This type of display is known as an A-mode or amplitude mode display (Fig. 31.4).
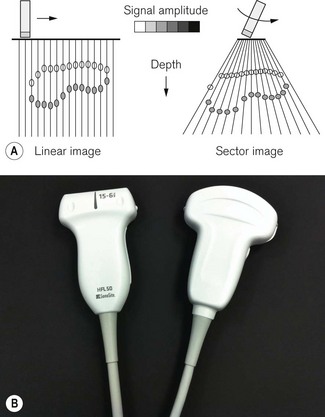
The final step is to sweep the beam through the tissue and to repeatedly interrogate the tissue with a series of pulses, displaying the resulting grey scale encoded lines side by side so as to form an image of extended targets in tissue. This type of display is known as a B-mode, for brightness mode or grey scale image (Fig. 31.5A).
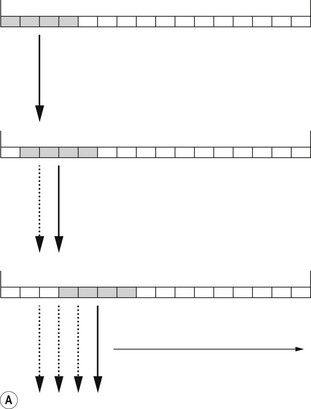
Modern transducer probes consist of an array of 128–256 piezoelectric elements mounted in a flat line to form a linear array, or on a curve to produce a curvilinear array, producing linear and sector images respectively (Fig. 31.5). Groups of elements can be switched electronically between transmit–receive pulse sequences to move the active area along the array. In this way a series of scan lines is produced, scanning through the target to form an image (Fig. 31.6A). The whole image is then scanned and refreshed many times each second to give a continuous real-time image that can show any movement taking place, for example a needle moving towards its intended target.
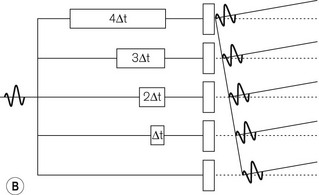
The beam may be steered through different angles by inserting time delays in front of individual elements (Fig. 31.6B). Because the pulse then arrives at adjacent elements at successively later times, the wavefronts of the soundwave propagating away from the elements add up along a line at an angle to the face of the probe. In other words, the transmitted pulse is steered away from a line perpendicular to the probe face. When echoes return to the transducer, the received echoes are again delayed and then added together. Those echoes coming from the steering angle will give a strong signal, as all their wave crests will add together. But for those echoes arriving from other angles, the peaks and troughs will tend to cancel each other out and a signal will not be detected. By switching the time delays electronically, each successive pulse can be steered at a different angle to produce a sector-shaped image. This is the basis for the function of phased array probes, commonly used for cardiac studies and for some intra cavitary applications.
The ultrasound journey
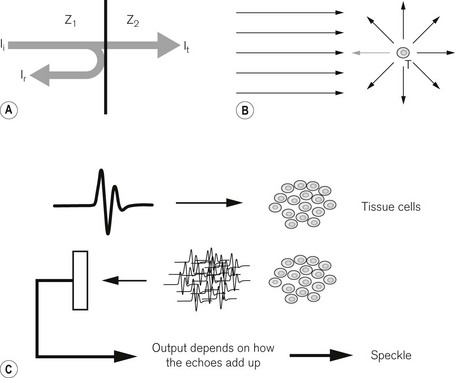
As the ultrasound pulse travels through the body it interacts with the tissue in various ways (Fig. 31.7). At large smooth interfaces, such as are found between one organ and another, muscle–liver for example, some of the energy in the pulse is reflected back towards the transducer as an echo (Fig. 31.7A). This type of reflection from a large smooth interface is known as specular reflection from the Latin speculum meaning a mirror. The strength of the echo will depend on the speed of sound (c) and density (ρ) of the tissues on either side of the interface through a property known as characteristic acoustic impedance (z0). Ii is the incident intensity and Ir is the reflected intensity of ultrasound (Table 31.2).
| Soft tissue–soft tissue | ~1% |
| Soft tissue–air | 99.9% |
| Soft tissue–bone | ~50% |
Stay updated, free articles. Join our Telegram channel

Full access? Get Clinical Tree


