Chapter 79 Pharmacokinetics, pharmacodynamics and drug monitoring in critical illness
Pharmacokinetics (PK) is the study of the absorption, distribution, metabolism and elimination (ADME) of drugs, usually by measurement of drug concentrations in blood or plasma. Pharmacodynamics (PD) is the study of the effects of a drug on the body. The pharmacokinetics of a drug is one determinant of its pharmacodynamics. Pharmacokinetic-pharmacodynamic (PK-PD) analysis seeks to summarise the behaviour of a drug in the body, to understand the sources of variability in this behaviour, and to use this knowledge to design rational, and ideally individualised, dosing regimens. The aim of this chapter is to review some basic PK and PD principles, to introduce the concepts that an intensive care physician may encounter when reading a contemporary PK-PD paper, and to consider the influence of critical illness on the pharmacokinetics and pharmacodynamics of drugs used in intensive care.
DOSE–RESPONSE RELATIONSHIPS
Most drugs exert their effects by binding to receptors1 such as an enzyme or membrane ion channel. The binding to the receptor directly or indirectly triggers a chain of biological events leading to the observable effects of the drug. The magnitude of effect is a function of:
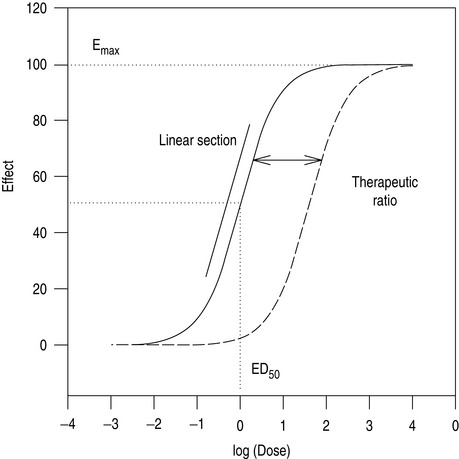
As the number of receptors present is finite, drugs have a maximum achievable effect. Classically, a plot of drug effect versus the logarithm of a wide range of doses will be described by a sigmoid-shaped dose–response curve (Figure 79.1). In practice, the range of doses used in patients is often narrower, and is confined to a smaller section of the dose–response curve.
TITRATION
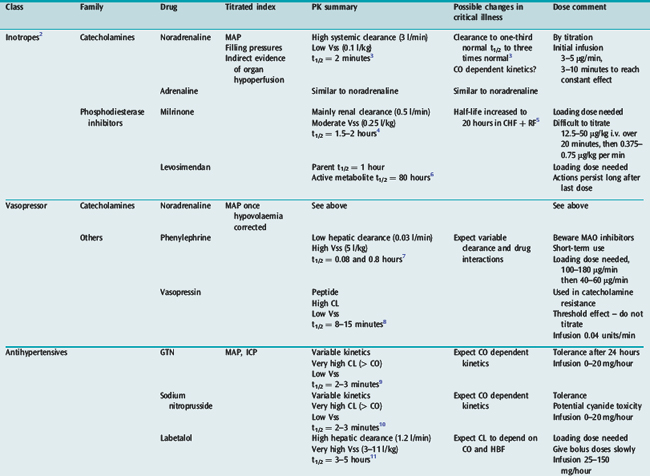
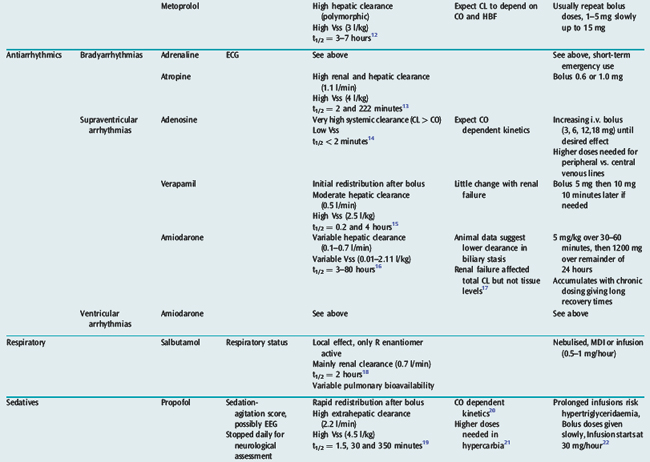
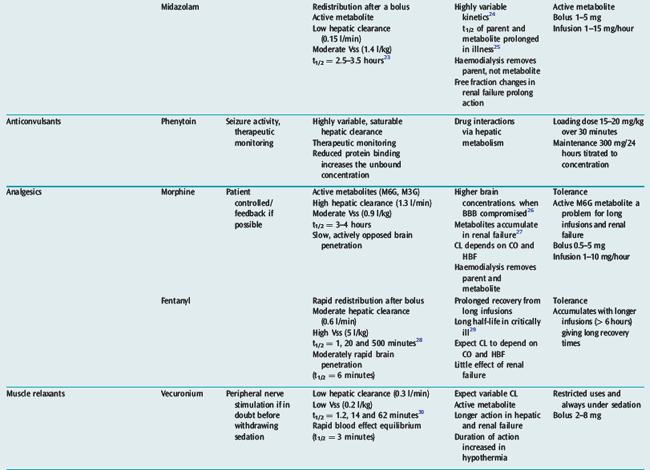
Many drugs used in intensive care have a relatively rapid onset of a directly measurable physiological effect (Table 79.1). They can therefore be used by a process of titration of dose versus effect to achieve the desired therapeutic outcome. While titration can be an empirical process, efficient titration strategies are guided by an understanding of the kinetics and dynamics of a drug. Important issues include an understanding of:
PHARMACOKINETICS
VOLUME OF DISTRIBUTION IN AN ORGAN
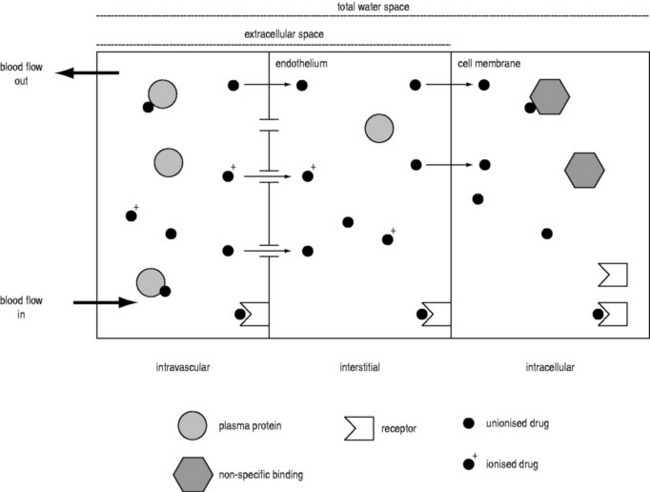
A drug administered to a patient will directly or indirectly enter the blood and be distributed by the blood circulation around the body. Drug enters the organs of the body via the afferent arterial blood supply. Any given molecule can then either diffuse into the organ or leave via the efferent venous blood (Figure 79.2). At steady state (when the arterial concentrations are constant and the net rates of diffusion into and out of the organ are equal), the total amount of drug in the organ (A) will often be a fixed ratio of the afferent arterial concentration (C). This ratio is known as an apparent volume of distribution (V):
A given organ is characterised by the size of defined ‘physiological’ spaces and its relative proportions of water, lipids and drug-binding sites (Figure 79.2). The important physiological spaces are:
A drug may act on receptors in any of these spaces. The physicochemical properties of a drug dictate which physiological spaces are accessible to the drug. A drug can exist in blood in several forms: ionised or unionised (governed by the local pH and the pKa of the drug), and bound or unbound to plasma proteins.
Consequently, drugs that are highly bound or highly ionised in blood generally have smaller distribution volumes in an organ. For example, the distribution volume of propofol in the brain is less than expected based on its high lipophilicity because it is highly bound in plasma. Paradoxically, highly lipophilic drugs in general do not penetrate tissues as extensively as moderately lipophilic compounds, as high lipophilicity is correlated with high binding in plasma.33
When the diffusion rate across the endothelium and cell membranes is significantly less than organ blood flow (Q), the uptake into the organ is ‘membrane-limited’ and less affected by changes in organ blood flow. Morphine shows membrane-limited uptake into the brain.34
THE SPECIAL CASE OF THE BRAIN
Drug penetration into the brain is further restricted compared to that of other organs because of passive and active defence mechanisms collectively known as the blood–brain barrier (BBB). The passive component is the tight junctions of endothelial cells in the brain, which means that passage across the endothelium is solely by the transcellular route, and therefore restricted to lipophilic compounds. The active component is a range of transmembrane transporters. Some of these allow the uptake of endogenous compounds (e.g. amino acids and glucose). Of more pharmacological importance are a range of efflux transporters that actively pump drugs from the brain to the blood.35 The clinical significance of these transporters is currently being defined, but may be particularly important for some drugs. For example, loperamide is a potent opioid, but has no central effects at normal doses because it is excluded from the brain by P-glycoprotein.36 Similarly, the concentration of morphine in the brain is kept low by active transport. When the BBB is damaged, morphine concentrations in the brain are found to be higher.26
CLEARANCE IN AN ORGAN
HEPATIC DRUG CLEARANCE
HALF-LIFE IN THE BODY
For a given drug, each organ of the body has characteristic rates of distribution (equilibration half-life) or clearance (extraction). When these complex processes are summed together, however, the sum appears to reduce to changes in blood concentrations that can be described by one, two or three exponential functions, each with an associated half-life term. Half-lives can describe the rate of decline of the blood drug concentration following a dose, or the rate of increase in concentration during an infusion. Half-life is defined as the time taken for the drug concentration in the blood to decrease (or increase) by 50%, and when only one half-life is evident it is related to distribution volume and clearance as follows:
The distribution volume can sometimes provide information about the location of a drug in the body:38 a drug that distributes only in the intravascular space (e.g. one that is tightly bound to plasma proteins, such as indocyanine green) will have a distribution volume of about 0.075 l/kg; a drug that distributes into the extracellular space (e.g. one that is charged and cannot cross cell membrane, such as furosemide) will have a distribution volume of about 0.21 l/kg; and a drug that distributes into the total water space (e.g. one that is uncharged, lipophilic but does not bind to proteins, such as antipyrine) will have a distribution volume of about 0.6 l/kg. Drugs with higher distribution volumes can be assumed to be bound in blood and/or tissues.
< div class='tao-gold-member'>
Stay updated, free articles. Join our Telegram channel

Full access? Get Clinical Tree


