Neurologic and Intracranial Pressure Monitoring
Eric A. Bedell
Donald S. Prough
Options for evaluating and monitoring neurologic function have increased steadily in the past 10 years and provide the clinician a wide array of tools for the evaluation of the critically ill patient with neurologic diseases such as traumatic brain injury (TBI), subarachnoid hemorrhage (SAH), stroke, and encephalopathy. These include intracranial pressure (ICP) monitoring, electrophysiologic monitoring, and brain oxygenation monitoring.
The basic requirements and limitations of physiologic monitoring—both neurologic and nonneurologic—are unchanged and require the end-user to balance the risks of a monitoring technique against any benefits (whether proven or inferred) that are conferred by the information gathered. Important characteristics of monitoring devices include the ability to detect important abnormalities (sensitivity), to differentiate between dissimilar disease states (specificity), and to prompt changes in care that alter long-term prognosis (Table 30-1). Limitations of techniques include risks to patients (during placement, use, and removal), variability errors in generation of data (e.g., calibration and drift), and inherent trade-offs between specificity and sensitivity. Monitors with high specificity—values fall outside of threshold levels only when a disease state is unequivocally present—are unlikely to detect less profound levels of disease, while monitors with high sensitivity (will detect any value outside of the normal range) are likely to demonstrate small deviations from normal that may be trivial in individual patients. Therefore, clinicians who rely on monitoring devices must understand those devices, with their potential value and limitations, and correctly apply and interpret the monitored data within the context of individual patients. In addition, clinicians must understand integration of multiple techniques to improve sensitivity and specificity of monitoring brain function—this is the concept of “multimodal monitoring.” The theoretical importance of brain monitoring is based on the high vulnerability of the brain to hypoxic and ischemic injuries. The brain uses more oxygen and glucose per weight of tissue than any large organ, yet has no appreciable reserves of oxygen or glucose. The brain is thus completely dependent on uninterrupted cerebral blood flow (CBF) to supply metabolic substrates that are required for continued function and survival and to remove toxic by-products. Even transient interruptions in CBF, whether local or global, can injure or kill neural cells. These perturbations may not result in immediate cell death, but can initiate metabolic or cellular processes (e.g., gene transcription) that may lead to cell death days, months, or years after the insult. Therefore, clinical monitoring of neuronal well-being should emphasize early detection and reversal of potentially harmful conditions. Although there is limited conclusive data to demonstrate that morbidity and mortality are reduced by the information gathered from current neurologic monitoring techniques, most clinicians caring for patients with critical neurologic illness have confidence that their use improves management. In this chapter, we will review currently available techniques with emphasis on current scientific literature and indications for utilization.
Goals of Brain Monitoring
Monitoring devices cannot independently improve outcome. Instead, they contribute physiologic data that can be integrated into a care plan that, while frequently adding risks (associated with placement, use, and removal), may lead to an overall decrease in morbidity and mortality. The risks inherent in the monitoring technique cannot be overemphasized and must be individualized to the patients’ conditions and acuity. Neurologic monitoring falls into two general categories: qualitative measurements (e.g., Glasgow Coma Scale [GCS] scoring, cranial nerve testing, electroencephalographic [EEG], and evoked-potential [EP] monitoring) and quantitative/semiquantitative monitors (e.g., ICP, transcranial Doppler ultrasonography, jugular bulb venous oxygen saturation [SjvO2], brain tissue oxygen tension [PbtO2], and brain microdialysis). Qualitative monitoring provides information as to the integrated functioning of the brain/nervous system, whereas quantitative monitoring provides specific measurements that may be useful in directing specific therapeutic interventions and gauging therapeutic effectiveness.
Nonneurologic examples of qualitative and quantitative monitors include, respectively, peripheral nerve stimulation for assessing neuromuscular blockade and continuous electrocardiography (ECG). Peripheral nerve stimulation assesses the qualitative function of the neuromuscular junction by depolarizing a peripheral nerve and evaluating the muscle response. It provides information about overall function, but does not uniquely identify or quantify the nature of abnormalities. Continuous ECG provides specific and quantitative information about heart rate and rhythm and facilitates evaluation of interventions, such as beta-blocker administration for the treatment of sinus tachycardia, but does not provide information about the adequacy of
cardiac function with respect to systemic needs. For each example, the limitations of the devices are well known and information should only be interpreted within that context. Failure to appreciate these limitations can interfere with patient management. Indeed, few clinicians would assess cardiac well-being based only on the ECG. In the same way, care must be taken when applying information gathered from neurologic monitoring.
cardiac function with respect to systemic needs. For each example, the limitations of the devices are well known and information should only be interpreted within that context. Failure to appreciate these limitations can interfere with patient management. Indeed, few clinicians would assess cardiac well-being based only on the ECG. In the same way, care must be taken when applying information gathered from neurologic monitoring.
TABLE 30-1. Glossary of Neurologic Monitor Characteristics | ||||||||||||||||||
|---|---|---|---|---|---|---|---|---|---|---|---|---|---|---|---|---|---|---|
|
Cerebral Ischemia
Virtually all neurologic monitors detect actual or possible cerebral hypoxia/ischemia, defined as cerebral delivery of oxygen (CDO2) insufficient to meet metabolic needs. Cerebral ischemia is traditionally characterized as global or focal, and complete or incomplete (Table 30-2). Systemic monitors readily detect most global cerebral insults, such as hypotension, hypoxemia, or cardiac arrest. Therefore, brain-specific monitors can provide additional information primarily in situations, such as stroke, SAH with vasospasm, and TBI, in which systemic oxygenation and perfusion appear to be adequate but focal cerebral oxygenation may be impaired.
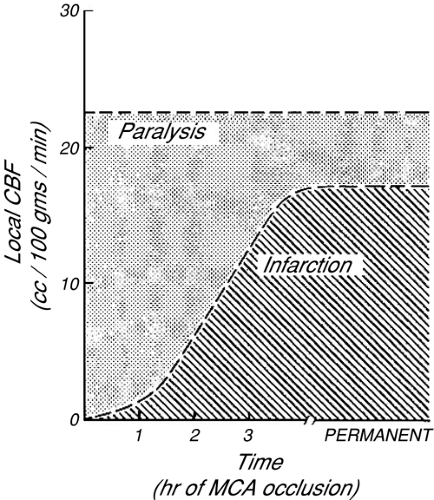 FIGURE 30-1. Schematic representation of ischemic thresholds in awake monkeys. The threshold for reversible paralysis occurs at local cerebral blood flow (Local CBF) of approximately 23 mL per 100 m per minute. Irreversible injury (infarction) is a function of the magnitude of blood flow reduction and the duration of that reduction. Relatively severe ischemia is potentially reversible if the duration is sufficiently short. [From Jones TH, Morawetz RB, Crowell RM, et al: Thresholds of focal cerebral ischemia in awake monkeys. J Neurosurg 54:773-782, 1981, with permission.] |
TABLE 30-2. Characteristics of Types of Cerebral Ischemic Insults | ||||||||
|---|---|---|---|---|---|---|---|---|
|
The severity of ischemic brain damage has traditionally been thought to be proportional to the magnitude and duration of reduced CDO2. For monitoring to influence long-term patient morbidity and mortality, prompt recognition of reversible cerebral hypoxia/ischemia is essential. In monkeys, potentially reversible paralysis develops if regional CBF declines below about 23 mL per 100 g per minute; whereas infarction of brain tissue generally requires that CBF remain below 18 mL per 100 g per minute [1]. More recently, similar results were demonstrated in humans with TBI [2]. The tolerable duration of more profound ischemia is inversely proportional to the severity of CBF reduction (Fig. 30-1). More recent studies have demonstrated the importance of protein synthesis, enzymatic function, and gene expression resulting from hypoxia/ischemia, and the development of cellular dysfunction or death from different types and levels of cellular stress. Alterations in gene expression occur following periods of neurologic stress and may influence long-term neurologic function [3], for instance, the production of inflammatory mediators in response to stress [4] may contribute to neuronal injury and death. Other proteins synthesized in response to altered oxygen delivery, such as hypoxia inducible factors (HIF), have been identified as adaptive mechanisms that respond to variations in oxygen partial pressure [5] and may be protective. This interaction between protein synthesis/gene expression, inducible protective mechanisms, and long-term outcome after hypoxia/ischemia is an area of potential monitoring and therapeutic intervention. When a cerebral monitor detects ischemia, the results must be carefully interpreted. Often, all that is known is that cerebral oxygenation in the region of brain that is assessed by that monitor has fallen below a critical threshold. Such information does not specifically imply that ischemia will necessarily progress to infarction, nor does it clearly define what biochemical or genetic transcriptional changes may subsequently occur. Also, because more severe ischemia produces neurologic injury more quickly
than less severe ischemia, time and dose effects must be considered. Therefore, it is impossible to use a threshold monitor (i.e., one that becomes abnormal with mild cerebral ischemia) to predict with certainty whether changes in neurologic function will be followed by irreversible cerebral injury. More important, if regional ischemia involves structures that are not components of the monitored variable, then infarction could develop without warning.
than less severe ischemia, time and dose effects must be considered. Therefore, it is impossible to use a threshold monitor (i.e., one that becomes abnormal with mild cerebral ischemia) to predict with certainty whether changes in neurologic function will be followed by irreversible cerebral injury. More important, if regional ischemia involves structures that are not components of the monitored variable, then infarction could develop without warning.
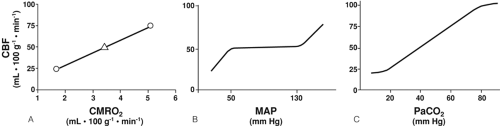 FIGURE 30-2. A: The normal relationship between the cerebral metabolic rate of oxygen consumption (CMRO2) and cerebral blood flow (CBF) is characterized by closely couple changes in both variables. Normally, CBF is 50 mL per 100 g per minute in adults (open triangle). As CMRO2 increases of decreases, CBF changes in a parallel fashion (solid line). B: Effect of mean arterial pressure (MAP) on CBF. Note that changes in MAP produce little change in CBF over a broad range of pressures. If intracranial pressure (ICP) exceeds normal limits, substitute cerebral perfusion pressure on the horizontal axis. C: Effect of PaCO2 on CBF. Changes in PaCO2 exert powerful effects on cerebral vascular resistance across the entire clinically applicable range of values. |
In healthy persons, CBF is tightly regulated through multiple pathways such that CDO2 is adjusted to meet the metabolic requirements of the brain. In the normal, “coupled” relationship, CBF is dependent on the cerebral metabolic rate for oxygen (CMRO2), which varies directly with body temperature and with the level of brain activation (Fig. 30-2A). As CMRO2 increases or decreases, CBF increases or decreases to match oxygen requirements with oxygen delivery. Pressure autoregulation maintains CBF at a constant rate (assuming unchanged metabolic needs) over a wide range of systemic blood pressures (Fig. 30-2B). If pressure autoregulation is intact, changes of cerebral perfusion pressure (CPP) do not alter CBF over a range of pressures of 50 to 130 mm Hg [6]. CPP can be described by the equation CPP = MAP – ICP, where MAP equals mean arterial pressure. After neurologic insults (e.g., TBI), autoregulation of the cerebral vasculature may be impaired such that CBF may not increase sufficiently in response to decreasing CPP [7, 8 and 9]. This failure to maintain adequate CDO2 can lead to ischemia and add to preexisting brain injury, a process termed secondary injury, at blood pressures that would not normally be associated with cerebral ischemia/injury. Normally, arterial partial pressure of carbon dioxide, (PaCO2) significantly regulates cerebral vascular resistance over a range of PaCO2 of 20 to 80 mm Hg (Fig. 30-2C). CBF is acutely halved if PaCO2 is halved, and doubled if PaCO2 is doubled. This reduction in CBF (via arteriolar vasoconstriction) results in a decrease in cerebral blood volume and a decrease in ICP. Conceptually, decreasing PaCO2 to decrease ICP may appear to be desirable. Hyperventilation as a clinical tool was described by Lundberg et al. [10] in 1959 as a treatment for increased ICP, and was a mainstay of treatment for over 40 years. However, in healthy brain, there are limits to maximal cerebral vasoconstriction with falling PaCO2 (as well as vasodilation with increasing PaCO2), such that, as CBF decreases to the point of producing inadequate CDO2, local vasodilatory mechanisms tend restore CBF and CDO2. As a consequence, in healthy brain, hyperventilation does not produce severe cerebral ischemia; however, after TBI, hypocapnia can generate cerebral ischemia as reflected in decreased PbtO2 and SjvO2 [11, 12, 13 and 14]. Thus, one indication for cerebral oxygenation monitoring includes the decision to use therapeutic hyperventilation in treatment of TBI, in which case monitoring data can be used to determine the endpoint of hyperventilation [15, 16]. If hyperventilation is required to acutely reduce ICP, administration of an increased inspired oxygen concentration can markedly increase SjvO2 (Fig. 30-3) [16]. In response to decreasing arterial oxygen content (CaO2), whether the reduction is secondary to a decrease of hemoglobin (Hgb) concentration or of arterial oxygen saturation (SaO2), CBF normally increases, although injured brain tissue has impaired ability to increase CBF [17, 18].
Techniques of Neurologic Monitoring
Neurologic Examination
Frequent and accurately recorded neurologic examinations remain an important aspect of medical care, but are of limited utility in patients with moderate to severe neurologic compromise. Neurologic examination quantifies three key characteristics: level of consciousness, focal brain dysfunction, and trends in neurologic function. Recognition of changing consciousness may warn of a variety of treatable conditions, such as progression of intracranial hypertension, and systemic complications of intracranial pathology, such as hyponatremia.
The GCS score, originally developed as a tool for the assessment of impaired consciousness [19], has also been used as a prognostic tool for patients with TBI [20]. The GCS score at the time of initial hospitalization is used to characterize the severity of TBI, with severe TBI defined as a GCS score less than or equal to 8, moderate TBI as a GCS score of 9 to 12, and mild TBI as that associated with a GCS score greater than 12 [21]. Lower GCS scores are generally associated with poorer long-term outcomes
[11], although correlation to individual patients with TBI is difficult because of the significant variations in mortality rates and functional outcome [22], and some have recommended that its use as a prognostic tool is no longer warranted in TBI [23]. The GCS score is popular as a quick, reproducible estimate of level of consciousness (Table 30-3), has become a common tool for the serial monitoring of consciousness, and has been incorporated into various outcome models, such as the Trauma score, APACHE II, and the Trauma-Injury Severity score. The GCS score, which includes eye opening, motor responses in the best functioning limb, and verbal responses, should be supplemented by recording pupillary size and reactivity and the presence of other abnormal neurologic findings. Even so, the use of serial GCS determinations remains a common tool in the management of patients with neurologic dysfunction.
[11], although correlation to individual patients with TBI is difficult because of the significant variations in mortality rates and functional outcome [22], and some have recommended that its use as a prognostic tool is no longer warranted in TBI [23]. The GCS score is popular as a quick, reproducible estimate of level of consciousness (Table 30-3), has become a common tool for the serial monitoring of consciousness, and has been incorporated into various outcome models, such as the Trauma score, APACHE II, and the Trauma-Injury Severity score. The GCS score, which includes eye opening, motor responses in the best functioning limb, and verbal responses, should be supplemented by recording pupillary size and reactivity and the presence of other abnormal neurologic findings. Even so, the use of serial GCS determinations remains a common tool in the management of patients with neurologic dysfunction.
TABLE 30-3. Glasgow Coma Scale | ||||||||||||
|---|---|---|---|---|---|---|---|---|---|---|---|---|
|
Systemic Monitoring
Although not specific to neurologic monitoring, systemic parameters, including blood pressure, arterial oxygen saturation (SaO2), PaCO2, serum glucose concentration, and temperature, have clinical relevance in the management of patients with neurologic dysfunction or injury. The relationships between these systemic variables and long-term outcome after neurologic insults are closely linked and are subject to continuing research.
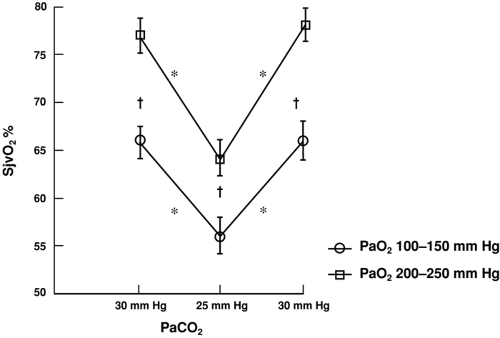 FIGURE 30-3. The effect of hyperoxia on percentage of oxygen saturation of jugular venous blood (SjvO2) at two levels of PaCO2. *P <0.001 for SjvO2 at PaCO2 25-30 mm Hg at each PaO2. †P <0.001 for SjvO2 between PaO2 at each PaCO2 level. [From Thiagarajan A, Goverdhan PD, Chari P, et al: The effect of hyperventilation and hyperoxia on cerebral venous oxygen saturation in patients with traumatic brain injury. Anesth Analg 87:850-853, 1998, with permission.] |
Perhaps the most important systemic monitor is blood pressure, as CBF is dependent on the relationship between CPP and cerebral vascular resistance (CVR), and can be modeled generally by the equation: CBF = CPP/CVR. As previously discussed, CBF is maintained relatively constant over a wide range of blood pressures (pressure autoregulation) through arteriolar changes in resistance (assuming no change in brain metabolism) in healthy individuals. After brain injury, autoregulation may become impaired, especially in traumatically brain-injured patients. Chesnut et al. [24, 25] reported that even brief periods of hypotension (systolic blood pressure less than 90 mm Hg) worsened outcome after TBI, and recommended that systolic blood pressure be maintained greater than 90 mm Hg (with possible benefit from higher pressures). These recommendations have also been promoted by the Brain Trauma Foundation for patients with severe TBI [26]. To achieve this goal, the use of vasoactive substances, such as norepinephrine, may be required [27]. Nevertheless, optimal blood pressure management for patients with TBI has yet to be defined. Some clinical data suggest that the influence of hypotension on outcome after TBI is equivalent to the influence of hypotension on outcome after nonneurologic trauma [28]. Proposed treatment protocols include CPP greater than 70 mm Hg [29,30], greater than
60 mm Hg [31, 32], or greater than 50 mm Hg [33]. The augmentation of CPP above 70 mm Hg with fluids and vasosuppressors has, however, been associated with increased risk of acute respiratory distress syndrome and is not universally recommended [32].
60 mm Hg [31, 32], or greater than 50 mm Hg [33]. The augmentation of CPP above 70 mm Hg with fluids and vasosuppressors has, however, been associated with increased risk of acute respiratory distress syndrome and is not universally recommended [32].
Another essential step in insuring adequate CDO2 is the maintenance of adequate CaO2, which in turn is dependent on Hgb and SaO2; therefore, anemia and hypoxemia can reduce CDO2, which would normally result in compensatory increases in CBF. However, these compensatory mechanisms are limited. As SaO2 (or PaO2) decreases below the compensatory threshold, SjvO2 and jugular venous oxygen content (CjvO2), which reflect the ability of CDO2 to supply CMRO2, also decrease (Fig. 30-4A) [34]. The correlation is most evident below a PaO2 of approximately 60 mm Hg, the PaO2 at which SaO2 is 90% and below which SaO2 rapidly decreases. In contrast, as Hgb is reduced by normo-volemic hemodilution, SjvO2 remains relatively constant unless severe anemia is produced (Fig 30-4B) [34].
The management of arterial CO2 in patients with neurologic injury has changed dramatically in the past 10 years. Although hyperventilation as a management strategy for increased ICP was routine in the 1990s, it is now reserved for acute or life-threatening increases in the intensive care unit (ICU) and is no longer recommended for routine use. Having been associated with cerebral ischemia in children [12] and adults [13, 14] with severe TBI, hyperventilation is least likely to be harmful when combined with monitoring, such as SjvO2 or PbtO2, that can identify cerebral ischemia.
Hyperglycemia increased injury in experimental TBI [35, 36] and was associated with worse outcome in clinical TBI [37, 38], although it is difficult to distinguish between elevated glucose causing worsened outcome versus increased severity of TBI inducing more elevated glucose levels [39]. In critically ill patients requiring mechanical ventilation, elevated glucose levels were associated with worsened outcomes [40], and current recommendations are to tightly control serum glucose in all critically ill patients [41], although more evidence is necessary to support this recommendation and to clarify the importance of glucose control in various subgroups.
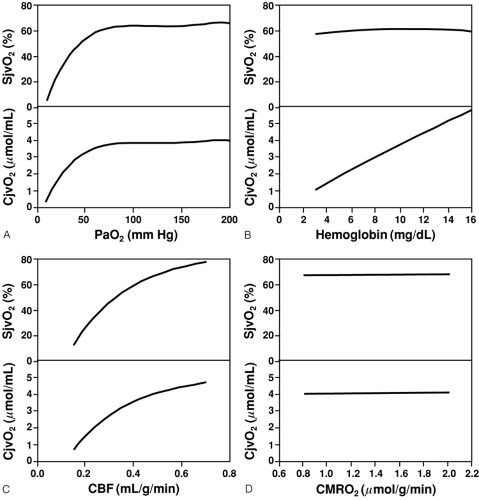 FIGURE 30-4. Changes in jugular venous saturation (SjvO2) and jugular venous oxygen content (CjvO2) in a normal subject in response to (A) hypoxia; (B) normovolemic anemia; (C) reduced cerebral blood flow (CBF); and (D) increased cerebral metabolic rate of oxygen (CMRO2). [From Feldman Z, Robertson CS: Monitoring of cerebral hemodynamics with jugular bulb catheters. Crit Care Clin 13:51-77, 1997, with permission.] |
The monitoring and management of body temperature remains an important aspect of care for critically ill patients. Hypothermia and hyperthermia should be considered separately in this context. The use of hypothermia as a treatment for brain injury, while demonstrating benefit in animals [42, 43 and 44] and in some phase II human studies [45], has not shown consistent benefit in larger studies [46] and is not recommended for general use in TBI [47, 48]. In contrast, induced hypothermia
after resuscitation from cardiac arrest (secondary to ventricular tachycardia or fibrillation) has improved outcome in some trials [49, 50] and may be indicated for clinical use. Research into this complex area is ongoing, and clinical practice is likely to undergo further refinement.
after resuscitation from cardiac arrest (secondary to ventricular tachycardia or fibrillation) has improved outcome in some trials [49, 50] and may be indicated for clinical use. Research into this complex area is ongoing, and clinical practice is likely to undergo further refinement.
Hyperthermia is common in critically ill patients, occurring in up to 90% of patients with neurologic disease, related both to diagnosis and length of stay [51, 52 and 53]. Hyperthermia is generally associated with poorer outcome when associated with neurologic injury in adults and children [54, 55], but a causal link with adverse outcome (as with serum glucose levels) is lacking. It is unclear whether increased temperatures result in worsened long-term neurologic outcome, or whether a greater severity of brain injury is associated with more frequent or severe increases in systemic temperature.
The method of temperature monitoring is important. Thermal gradients exist throughout the body, and the site of measurement influences the diagnosis of hypothermia, normothermia, or hyperthermia. Measurements of systemic temperature may underestimate brain temperature. In studies of temperature monitoring by site, variations of up to 3°C have been identified between the brain and other routinely used monitoring sites [56, 57 and 58], emphasizing the importance of monitoring site selection in patients with neurologic injury and the need to appreciate the difference between brain temperature and the active site of measurement used clinically for a given patient. Electroencephalographic (EEG) monitoring has long been used in neurology for diagnosis, but has less frequently been used as a neurologic monitoring technique in critically ill patients. Rather, EEG is indicated in response to suspicion of a new or progressive abnormality such as cerebral ischemia or new onset of seizures. The cortical EEG, which is altered by mild cerebral ischemia and abolished by profound cerebral ischemia, can be used to indicate potentially damaging cerebral hypoperfusion. Likewise, the EEG can document seizures, either convulsive or nonconvulsive, and provide information as to the efficacy of antiseizure therapy. Other functions include defining the depth or type of coma, documenting focal or lateralizing intracranial abnormalities, and the diagnosis of brain death.
If the EEG is to be used for monitoring, care must be taken and weaknesses of the technique appreciated [59]. In the ICU, electrical noise from other equipment may interfere with technically adequate tracings. Continuous EEG recording is cumbersome owing to the sheer volume of data (300 pages per hour of hard copy on as many as 16 channels), although techniques for networking direct computer recording of EEG data are now available given adequate computer power and storage. Scalp fixation has also been a significant limiting factor, although newer fixation techniques are easier to apply and more stable. Techniques of mathematical data analysis, such as rapid Fourier analysis, can be used to determine the relative amplitude in each frequency band (delta—less than 4 Hz, theta—4 to 8 Hz, alpha—8 to 13 Hz, beta—greater than 13 Hz), which can then be displayed graphically in formats such as the compressed spectral array or density spectral array [60, 61]. Analytic software has been developed that processes the raw EEG signal to provide single number interpretation of the “depth of sedation.” These devices have been recommended for use during general anesthesia as a means to reduce the risk of awareness [62], although the scientific justification for this claim is not conclusive. The American Society of Anesthesiologists has developed a practice advisory on this issue [63]. Use of this type of monitoring has also been implemented by some for use in the ICU for monitoring sedation levels in the critically ill, the utility of which has yet to be proven [64, 65]. All devices use proprietary analysis of an EEG signal (either spontaneous or evoked, with or without electromyogram monitoring), which is converted to a single number that is intended to correspond to an awareness level based on an arbitrary scale. The future role and evidence of improved patient outcomes with this monitoring modality are unknown. Technical information on EEG processing can be found in a recent review [66].
Related posts:


Stay updated, free articles. Join our Telegram channel

Full access? Get Clinical Tree


