KEY POINTS
1. For cardiac anesthesia, a five-electrode surface ECG monitor should be used in the diagnostic mode, with a frequency response of 0.05 to 100 Hz.
2. After a rapid pressure change (performed by flushing the pressure line and known as the “pop test”), an underdamped system will continue to oscillate for a prolonged time. In terms of pressure monitoring, this translates to an overestimation of systolic BP and an underestimation of diastolic BP. An overdamped system will not oscillate at all but will settle to baseline slowly, thus underestimating systolic and overestimating diastolic pressures. A critically damped system will settle to baseline after only one or two oscillations and will reproduce systolic pressures accurately.
3. Air within a catheter or transducer causes most pressure monitoring errors.
4. The radial artery pressure may be significantly lower than the aortic pressure at the completion of cardiopulmonary bypass (CPB) and for 5 to 30 min following CPB.
5. Standards in the United States and the United Kingdom suggest that ultrasound guidance is the preferred technique for internal jugular catheter placement.
6. If subclavian vein cannulation is unsuccessful on one side, an attempt on the contralateral side is contraindicated without first obtaining a chest x-ray film. Bilateral pneumothoraces can be lethal.
7. The current consensus is that pulmonary artery catheter (PAC) placement may have benefit in high-risk patients, or those with special indications. However, in routine coronary artery bypass patients, the PAC has little, if any, benefit.
8. In cardiac surgical patients with ascending aortic atheroma identified by epiaortic scanning, modification of the surgical technique and neuroprotective strategies have been reported to reduce the incidence of neurologic complications from ~60% to 0%.
9. Monitoring temperature at one core site and one shell site is recommended. Nasal temperature is recommended for core temperature, and bladder or rectal temperature for shell temperature.
10. Though low serum calcium may affect myocardial pumping function, administration of calcium during potential neural ischemia or reperfusion may likely worsen the outcome and should be avoided.

PATIENTS PRESENTING FOR CARDIAC SURGERY require extensive monitoring because of (a) severe, often unstable cardiovascular disease and hemodynamics, (b) coexisting multisystemic diseases, (c) the abnormal physiologic conditions associated with CPB, and (d) special considerations for minimally invasive cardiac surgery. Monitoring techniques have been developed to provide early warning of conditions that may lead to potentially life-threatening complications. Current trends in monitoring include size reduction, minimally invasive device development, and advanced display technology [1].
I. Cardiovascular monitors
A. Electrocardiogram. The intraoperative use of the electrocardiogram (ECG) facilitates the intraoperative diagnosis of dysrhythmias, myocardial ischemia, and cardiac electrical silence during cardioplegic arrest. A five-lead system, including a V5 lead, is preferable for cardiac surgical patients. Use of five electrodes (one lead on each extremity and one precordial lead) allows the simultaneous recording of the six standard frontal limb leads as well as one precordial unipolar lead.
1. Indications
a. Diagnosis of dysrhythmias
b. Diagnosis of ischemia (see Chapter 11 “Anesthetic Management of Myocardial Revascularization”). In the anesthetized patient, the detection of ischemia by ECG becomes more important because the usual symptom, angina, cannot be elicited.
c. Diagnosis of conduction defects
d. Diagnosis of electrolyte disturbances
e. Monitor effect of cardioplegia during aortic cross-clamp
2. Techniques
a. The three-electrode system. This system utilizes electrodes only on the right arm, left arm, and left leg. The potential difference between two of the electrodes is recorded, whereas the third electrode serves as a ground. Three ECG leads (I, II, III) can be examined.
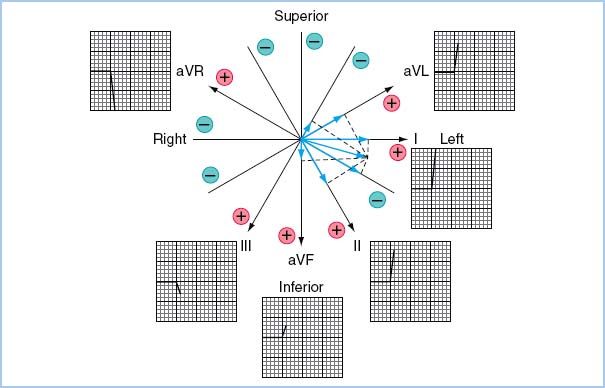
The three-lead system has been expanded to include the augmented leads. It identifies one of the three leads as the exploring electrode and couples the remaining two at a central terminal with zero potential. This creates leads in three more axes (aVR, aVL, aVF) in the frontal plane (Fig. 4.1). Leads II, III, and aVF are most useful for monitoring the inferior wall, and leads I and aVL for the lateral wall. Several additional leads have been developed for specific indications (Table 4.1).
Table 4.1 Bipolar and augmented leads for use with three electrodes
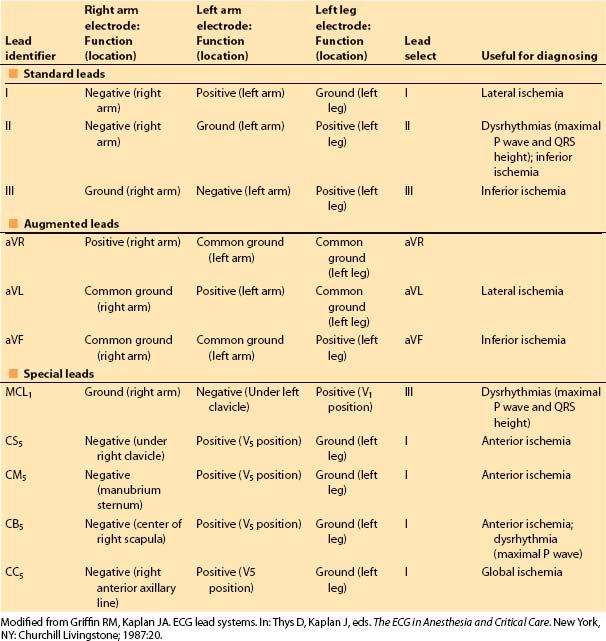
Figure 4.1 The six frontal plane axes that are available from three leads (right arm, left arm, and left leg) are shown. I, II, and III are bipolar leads, meaning that the potential between two electrodes (one positive, one negative) is monitored. The augmented leads (aVR, aVL, and aVF) are unipolar leads; one lead is the exploring electrode (the positive terminal), and the other two are connected and set at zero potential (indifferent, or neutral). The potential difference is then the absolute difference between the exploring and zero terminals. Connecting the two indifferent leads together produces the augmented lead axes that are between the bipolar lead axes. A sample electrical vector is shown (heavy arrow), with its projections to the six frontal axes. The direction of the electrical vector, then, is dictated by the direction of the deflection seen on the axis of each particular lead of the surface ECG. (From Thys DM, Kaplan JA. The ECG in Anesthesia and Critical Care. New York, NY: Churchill Livingstone; 1987:5, with permission.)
b. The five-electrode system. All limb leads act as a common ground for the precordial unipolar lead. The unipolar lead usually is placed in the V5 position, along the anterior axillary line in the fifth intercostal space, to best monitor the left ventricle (LV). The precordial lead can also be placed on the right precordium to monitor the right ventricle (RV; V4R lead).
(1) Advantages. With the addition of only two electrodes to the ECG system, seven different leads can be monitored simultaneously. More important, all but the posterior wall of the myocardium can be monitored for ischemia. In patients with coronary artery disease, the unipolar V5 lead is the best single lead in diagnosing myocardial ischemia [2]; moreover, 90% of ischemic episodes will be detected by ECG if leads II and V5 are analyzed simultaneously. Therefore, a correctly placed V5 lead in conjunction with limb leads should enhance the diagnosis of the vast majority of intraoperative ischemic events. Multiple ECG leads are also useful in the diagnosis of atrial and ventricular dysrhythmias.
(2) Disadvantage. The V5 electrode does not interfere with the operative field for a median sternotomy, although it will interfere with a left thoracotomy incision. All leads should be protected with waterproof tape, as surgical preparation solutions will loosen electrode patches and interfere with the electrical signal.
c. Semi-Invasive ECG. Semi-invasive leads are not routinely used but specific application may provide valuable information.
(1) Esophageal. Esophageal leads can be incorporated into the esophageal stethoscope. The esophageal lead is sensitive for the detection of posterior wall ischemia and the diagnosis of atrial dysrhythmias.
(2) Endotracheal. ECG leads have been incorporated into the endotracheal tube and may be useful in pediatric cardiac patients for the diagnosis of atrial dysrhythmias.
(3) Epicardial electrodes. Cardiac surgeons routinely place ventricular and/or atrial epicardial pacing wires at the conclusion of CPB prior to sternal closure. In addition to AV pacing, these pacing wires can be utilized to record atrial and/or ventricular epicardial ECGs. These leads are most useful in the postoperative diagnosis of complex conduction problems and dysrhythmias.
3. Computer-assisted ECG interpretation. Computer programs for online analysis of dysrhythmias and ischemia are currently widely available with a 60% to 78% sensitivity in detecting ischemia compared with the Holter monitor [3]. Typically, the current ECG signal is displayed along with a graph showing the trend (e.g., ST depression) over a recent time period, usually the past 30 min.
1
4. Recommendations for ECG monitoring. It is recommended that for cardiac anesthesia, a five-electrode surface ECG monitor be used in the diagnostic mode, with a frequency response of 0.05 to 100 Hz. Ideally, this monitor should display at least two leads simultaneously evaluating dysrhythmias and ischemia of two different areas of myocardium supplied by two different coronary arteries. Typically, leads V5 and II are monitored. None of the standard ECG leads can detect posterior wall ischemia or RV ischemia.
B. Noninvasive blood pressure monitors
1. Indications in the cardiac patient. Noninvasive methods for measuring blood pressure (BP) are not adequate for monitoring hemodynamic parameters during a cardiac surgical procedure and should only be used until an arterial catheter is placed. Noninvasive devices will not function when pulsatile flow is absent including during cardiopulmonary bypass or when continuous-flow left ventricular assist devices (LVAD) are used.
C. Intravascular pressure measurements. Invasive monitors via intravascular catheters are required to safely administer a cardiac anesthetic. Arterial pressure can be measured by placing a catheter in a peripheral artery or femoral artery. Central venous access is obtained to measure the central venous pressure (CVP) and serve as conduit for PAC placement to measure intracardiac pressures. The components of a system of intravascular pressure measurement are the intravascular catheter, fluid-filled connector tubing, a transducer, and an electronic analyzer and display system.
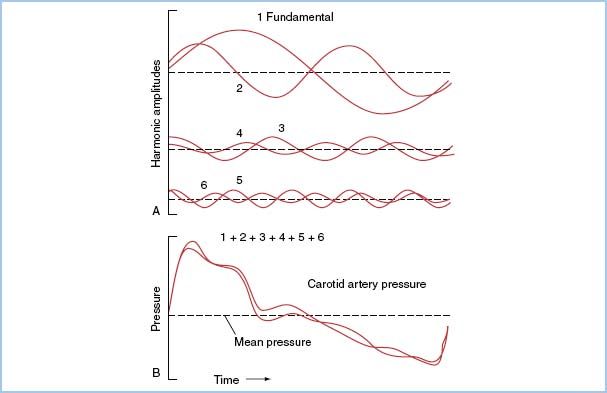
1. Characteristics of a pressure waveform. Pressure waves in the cardiovascular system can be characterized as complex periodic sine waves. These complex waves are a summation of a series of simple sine waves of differing amplitudes and frequencies, which represent the natural harmonics of a fundamental frequency. The first harmonic, or fundamental frequency, is equal to the heart rate (Fig. 4.2), and the first 10 harmonics of the fundamental frequency will contribute significantly to the waveform.
Figure 4.2 A: Generation of the harmonic waveforms from the fundamental frequency (heart rate) by Fourier analysis. B: The first six harmonics are shown. The addition of the six harmonics reproduces an actual BP wave. The first six harmonics are superimposed, showing a likeness to, but not a faithful reproduction of, the original wave. The first 10 harmonics of a pressure wave must be sensed by a catheter–transducer system, if that system is to provide an accurate reproduction of the wave. (From Welch JP, D’Ambra MN. Hemodynamic monitoring. In: Kofke WA, Levy JH, eds. Postoperative Critical Care Procedures of the Massachusetts General Hospital. Boston, MA: Little, Brown and Company; 1986:146, with permission.)
2. Properties of a monitoring system
a. Frequency response (or amplitude ratio) is the ratio of the measured amplitude versus the input amplitude of a signal at a specific frequency. The frequency response should be constant over the desired range of input frequencies—that is, the signal is not distorted (amplified or attenuated). The ideal amplitude ratio is close to 1. The signal frequency range of an intravascular pressure wave response is determined by the heart rate. For example, if a patient’s heart rate is 120 beats/min, the fundamental frequency is 2 Hz. Because the first 10 harmonics contribute to the arterial waveform, frequencies up to 20 Hz will contribute to the morphology of an arterial waveform at this heart rate.
b. Natural frequency (or resonant frequency), a property of all matter, refers to the frequency at which a monitoring system itself resonates and amplifies the signal. The natural frequency ( fn) of a monitoring system is directly proportional to the catheter lumen diameter (D), inversely proportional to the square root of three parameters: The tubing connection length (L), the system compliance (∆V/∆P), and the density of fluid contained in the system (δ ). This is expressed as follows:

To increase fn and thereby reduce distortion, it is imperative that a pressure-sensing system be composed of short, low-compliance tubing of reasonable diameter, filled with a low-density fluid (such as normal saline).
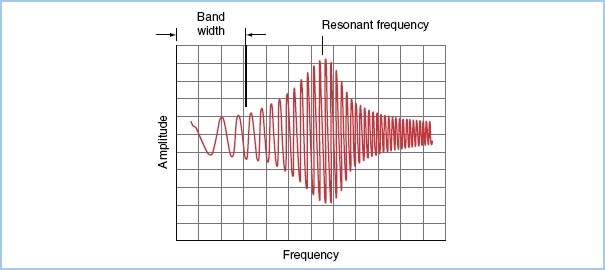
Ideally, the natural frequency of the measuring system should be at least 10 times the fundamental frequency to reproduce the first 10 harmonics of the pressure wave without distortion. In clinical practice, the natural frequency of most measuring systems is in the range from 10 to 20 Hz. If the input frequency is close to the system’s natural frequency (which is usually the case in clinical situations), the system’s response will be amplified (Fig. 4.3). Therefore, these systems require the correct amount of damping to minimize distortion.
Figure 4.3 Pressure recording from a pressure generator simulator, which emits a sine wave at increasing frequencies (horizontal axis). The frequency response (ratio of signal amplitudeOUT to signal amplitudeIN) is plotted on the vertical axis for a typical catheter–transducer system. The useful band width (range of frequency producing a “flat” response) and the amplification of the signal in the frequency range near the natural frequency of the system are shown. (From Welch JP, D’Ambra MN. Hemodynamic monitoring. In: Kofke WA, Levy JH, eds. Postoperative Critical Care Procedures of the Massachusetts General Hospital. Boston, MA: Little, Brown and Company; 1986:148, with permission.)
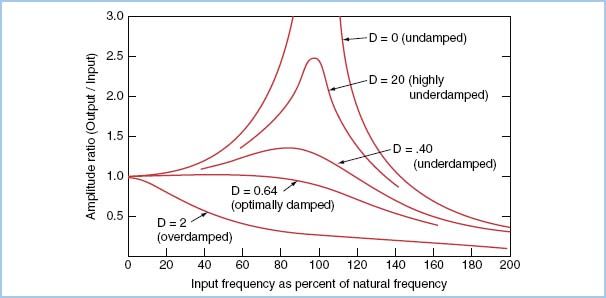
c. The damping coefficient reflects the rate of dissipation of the energy of a pressure wave. Figure 4.4 shows the relationship among frequency response, natural frequency, and damping coefficient.
Figure 4.4 Amplitude ratio (or frequency response) on the vertical axis is plotted as a function of the input frequency as a percentage of the natural frequency (rather than as absolute values). In the undamped or underdamped system, the signal output is amplified in the region of the natural frequency of the transducer system; in the overdamped system, a reduction in amplitude ratio for most input frequencies is seen. This plot exhibits several important points: (i) If a catheter–transducer system has a high natural frequency, less damping will be required to produce a flat response in the clinically relevant range of input frequencies (10 to 30 Hz). (ii) For systems with a natural frequency in the clinically relevant range (usual case), a level of “critical” (optimal) damping exists that will maintain a flat frequency response. D, damping coefficient (From Grossman W. Cardiac Catheterization. 3rd ed. Philadelphia, PA: Lea & Febiger; 1985:122, with permission.)
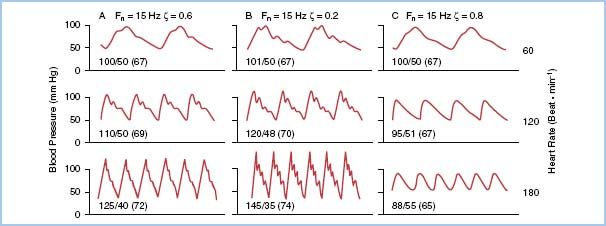
When a pressure-monitoring system with a certain natural frequency duplicates a complex waveform with any one of the first 10 harmonics close to the natural frequency of the system, amplification will result if correct damping of the catheter–transducer unit is not performed. The problem is compounded when the heart rate is fast (as in a child or a patient with a rapid atrial rhythm), which increases the demands of the system by increasing the input frequency (Fig. 4.5). Correct damping of a pressure-monitoring system should not affect the natural frequency of the system.
Figure 4.5 Comparison of three catheter–transducer systems with the same natural frequency (15 Hz) under different conditions of heart rate. Pressures are displayed as systolic–diastolic (mean). The reference BP for all panels is 100/50. A: A critically damped system (ζ = 0.6) provides an accurate reproduction until higher heart rates (greater than 150) are reached. B: An underdamped system (ζ = 0.2) shows distortion at lower rates, leading to overestimation of systolic and underestimation of diastolic pressures. C: An overdamped system (ζ = 0.8) demonstrates underestimation of systolic pressure and overestimation of diastolic pressure. Also note that diastolic and mean pressures are affected less by the inadequate monitoring systems. fn, natural frequency; ζ, damping coefficient.
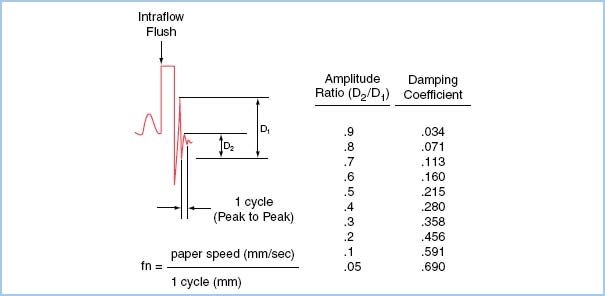
Both the natural frequency and the damping coefficient of a system can be estimated using an adaptation of the square wave method known as the “pop” test. The natural frequency is estimated by measuring the time period of one oscillation as the system settles to baseline after a high-pressure flush. The damping coefficient is calculated by measuring the amplitude ratio of two successive peaks (Fig. 4.6).
Figure 4.6 The “pop” test allows one to derive fn and ζ of a catheter–transducer system. The test should be done with the catheter in the artery in order to test the system in its entirety, as all components contribute to the harmonics of the system. The test involves a rapid flush (with the high-pressure flush system used commonly), followed by a sudden release. This produces a rapid decrease from the flush bag pressure and, owing to the inertia of the system, an overshoot of the baseline. The subsequent oscillations about the baseline are used to calculate fn and ζ. For example, the arterial pulse at the far left of the figure is followed by a fast flush and sudden release. The resulting oscillations have a definite period, or cycle, measured in millimeters. The natural frequency fn is the paper speed divided by this period, expressed in cycles per second, or Hertz. If the period were 2 mm and the paper speed 25 mm/s, fn = 12.5 Hz. For determining fn, a faster paper speed will give better reliability. The ratio of the amplitude of one induced resonant wave to the next, D2/D1, is used to calculate damping coefficients (right column). A damping coefficient of 0.2 to 0.4 describes an underdamped system, 0.4 to 0.6 an optimally damped system, and 0.6 to 0.8 an overdamped system. (From Bedford RF. Invasive blood pressure monitoring. In: Blitt CD, ed. Monitoring in Anesthesia and Critical Care Medicine. New York, NY: Churchill Livingstone; 1985:59, with permission.)
2
After a rapid pressure change (performed by flushing the pressure line), an underdamped system will continue to oscillate for a prolonged time. In terms of pressure monitoring, this translates to an overestimation of systolic BP and an underestimation of diastolic BP. An overdamped system will not oscillate at all but will settle to baseline slowly, thus underestimating systolic and overestimating diastolic pressures. A critically damped system will settle to baseline after only one or two oscillations and will reproduce systolic pressures accurately. An optimally or critically damped system will exhibit a constant (or flat) frequency response in the range of frequencies up to the fn of the system (Fig. 4.4). If a given system does not meet this criterion, components should be checked, especially for air, or the system replaced. Even an optimally damped system will begin to distort the waveform at higher heart rates because the 10th harmonic exceeds the system’s natural frequency (Fig. 4.5).
3. Strain gauges. The pressure-monitoring transducer can be described as a variable-resistance transducer. A critical part of the transducer is the diaphragm, which acts to link the fluid wave to the electrical input. When the diaphragm of a transducer is distorted by a change in pressure, voltages are altered across the variable resistor of a Wheatstone bridge contained in the transducer. This in turn produces a change in current, which is electronically converted and displayed.
4. Sources of error in intravascular pressure measurement
a. Low-frequency transducer response. Low-frequency response refers to a low- frequency range over which the ratio of output-to-input amplitude is constant (i.e., no distortion). If the natural frequency of the system is low, its frequency response will also be low. Most transducer systems used in clinical anesthesia can be described as underdamped systems with a low natural frequency. Thus, any condition that further decreases fn response should be avoided. Air within a catheter–transducer system causes most monitoring errors. Because of its compressibility, air not only decreases the response of the system but also leads to overdamping of the system. Therefore, the myth that an air bubble placed in the pressure tubing decreases artifact by increasing the damping coefficient is incorrect. A second common cause of diminution of frequency response is the formation of a partially obstructing clot in the catheter.
3
b. Catheter whip. Catheter “whip” is a phenomenon in which the motion of the catheter tip itself produces a noticeable pressure swing. This artifact usually is not observed with peripheral arterial catheters but is more common with PAC or LV catheters.
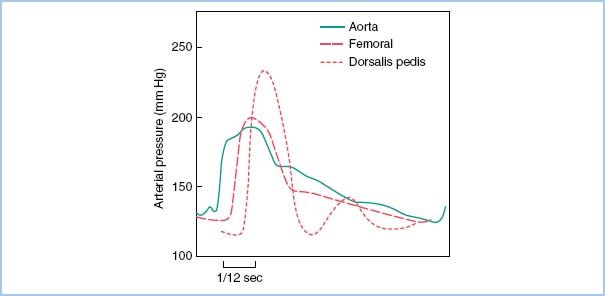
c. Resonance in peripheral vessels. The systolic pressure measured in a radial arterial catheter may be up to 20 to 50 mm Hg higher than the aortic pressure due to decreased peripheral arterial elastance and wave summation (Fig. 4.7).
Figure 4.7 Change of pulse pressure in different arteries. The central aortic waveform is more rounded and has a definite dicrotic notch. The dorsalis pedis and, to a lesser extent, the femoral artery show a delay in pulse transmission, sharper initial upstrokes (and thus higher systolic pressure), and slurring (femoral) and loss (dorsalis) of the dicrotic notch. The dicrotic notch is better maintained in the upper-extremity pressure wave (not shown). The small second “hump” in the dorsalis wave probably is due to a reflected wave from the arterial–arteriolar impedance mismatching. (From Welch JP, D’Ambra MN. Hemodynamic monitoring. In: Kofke WA, Levy JH, eds. Postoperative Critical Care Procedures of the Massachusetts General Hospital. Boston, MA: Little, Brown and Company; 1986:144, with permission.)
d. Changes in electrical properties of the transducer. Electrical balance, or electrical zero, refers to the adjustment of the Wheatstone bridge within the transducer so that zero current flows to the detector at zero pressure. Transducers should be electronically balanced periodically during a procedure because the zero point may drift, for instance, if the room temperature changes. The pressure waveform morphology may not change with baseline drift of a transducer.
e. Transducer position errors. By convention, the reference position for hemodynamic monitoring during cardiac surgery is the right atrium (RA). With the patient supine, the RA lies at the level of the midaxillary line. Once its zero level has been established, the transducer must be maintained at the same level as the RA. If the transducer position changes, falsely high or low-pressure values will result. This can be significant especially when monitoring CVP, PA pressure, or pulmonary capillary wedge pressure (PCWP) where the observed change is a greater percentage of the measured value. For example, if a patient has a mean arterial pressure of 100 mm Hg and a of 10 mm Hg, a 5 mm Hg offset due to transducer position would be displayed as a 5% or 50% change in the arterial or CVP pressures, respectively.
D. Arterial catheterization
1. Indications. Arterial catheterization (“art line”) has become the standard in the monitoring of the cardiac surgical patient. Indications for arterial pressure monitoring are as follows:
a. Small or rapid changes in arterial perfusion pressure may increase patient risk requiring beat-to-beat assessment. Cardiac surgical patients frequently have critical coronary artery disease and/or valvular heart disease. Cardiac surgical patients are at high risk of becoming hemodynamically unstable in the perioperative period.
b. Wide variation in BP or intravascular volume is anticipated.
c. Frequent blood sampling, especially arterial blood gas (ABG) analysis, is required.
d. Assessment of BP cannot be performed by other methods. CPB and continuous flow LVAD (nonpulsatile flow), dysrhythmia, or marked obesity require arterial pressure catheters.
2. Sites of cannulation. Several sites can be used for cannulation of the arterial tree:
a. Radial artery. The radial artery is the most commonly utilized site because catheter insertion is convenient and the radial artery provides a reasonably accurate estimation of the true aortic pressure.
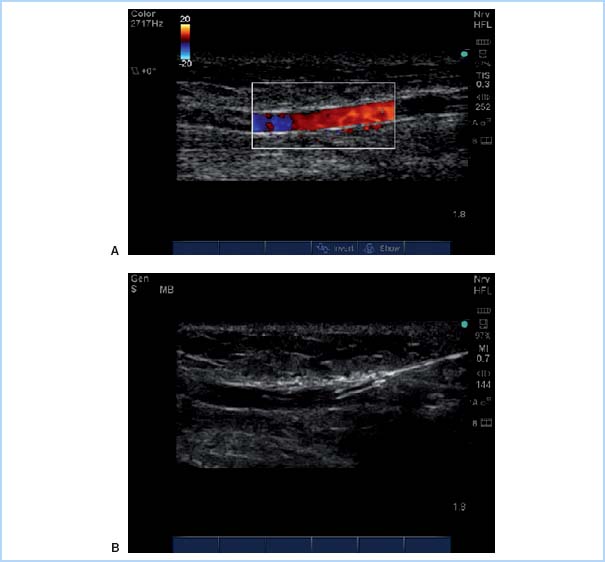
(1) Technique. Table 4.2 summarizes the steps used for radial arterial cannulation. One technique, transfixing the radial artery for catheter insertion, is shown in Figure 4.8. Ultrasound-guided radial artery cannulation [4] can be especially beneficial when difficulty placing the catheter via the traditional method is encountered. Table 4.3 and Figure 4.9 describe ultrasound guidance for arterial cannulation. Ultrasound guidance may be the method of choice with improved first-pass success when difficulty such as low flow states (shock), or nonpulsatile flow (extracorporeal membrane oxygenation [ECMO], LVAD, cardiac arrest), or nonpalpable pulses (secondary to peripheral edema, hematoma, arterial vasospasm) are encountered.
Table 4.2 Steps for arterial catheter placement
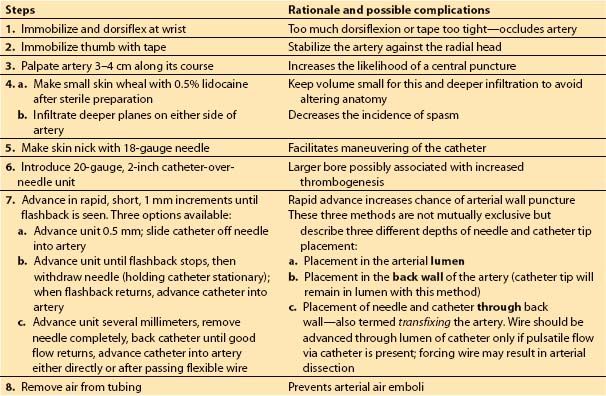
Table 4.3 Steps for ultrasound-guided arterial catheterization
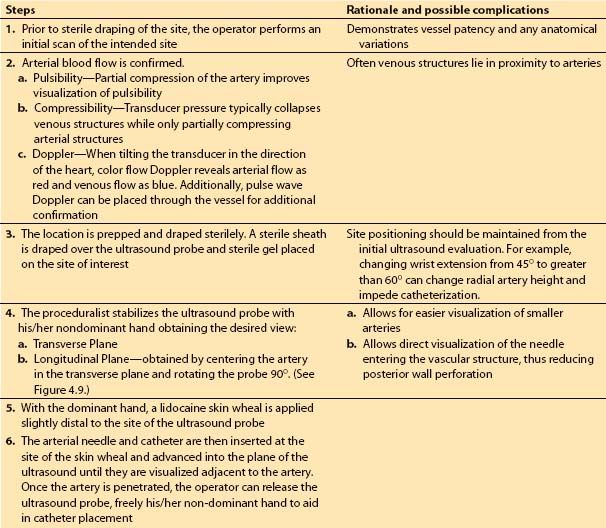
Figure 4.8 One technique used for radial artery cannulation. The needle–catheter unit is advanced through the artery, as shown in the upper drawing. The lower drawing shows the needle removed and the catheter withdrawn until pulsatile flow is obtained (indicating that the catheter tip is in the lumen). The catheter then is advanced into the artery. (Redrawn from Freis ES. Vascular cannulation. In: Kofke WA, Levy JH, eds. Postoperative Critical Care Procedures of the Massachusetts General Hospital. Boston, MA: Little, Brown and Company; 1986:137, with permission.)
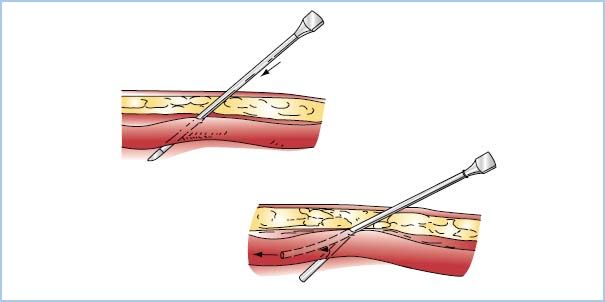
Figure 4.9 Ultrasound-guided radial artery cannulation. A: Color flow Doppler demonstrates patent flow in the radial artery. B: After flow is confirmed, a catheter is advanced with ultrasound guidance into the radial artery. (From Mikhael R. Radial Artery Cannulation (In-Plane Approach). 2010. Graphic. MSH Obstetric Anesthesia Ultrasound Group. http://oba.mikhaels.org/currentconcepts/ultrasound/module.php?section = vascular&name = multimedia)
(2) Contraindications. Inadequate collateral flow to the hand is a relative contraindication to the use of a radial artery catheter. Very few ischemic complications have been reported from arterial catheterization even in patients with a positive Allen’s test indicating limited collateral ulnar artery flow [5].
(3) Radial artery harvest. If a coronary bypass that will utilize the radial artery as a free graft is planned, an alternative site must be used. Usually the radial artery to be harvested is known preoperatively, and the contralateral radial artery can be used.
b. Femoral artery. The femoral artery offers two advantages over the radial site: Assessment of central arterial pressure and appropriate access should placement of an intra-aortic balloon pump become necessary during the surgical procedure. Placement of a femoral artery catheter as an additional catheter site should be considered in any patient in whom difficulty in weaning from CPB is expected (e.g., those with markedly depressed ejection fraction, severe wall-motion abnormalities, or significant coronary disease).
(1) Technique. The femoral artery is entered most easily using a Seldinger technique after sterile preparation and draping. The femoral artery typically lies at the midpoint between the pubic tubercle and the anterior superior iliac spine. These bone landmarks can be used to guide identification of the femoral pulse in difficult cases.
(2) Contraindications. Cannulation of the femoral artery should be avoided in patients with prior vascular surgery involving the femoral arteries or a skin infection of the groin.
c. Aortic root. Aortic root cannulation is an option when the chest is open and difficulties are encountered in obtaining a reliable BP. Pressure tubing can be handed to the anesthesiologist from the sterile field after a needle or catheter is inserted in the aortic root by the surgeon.
d. Axillary artery. The axillary artery, like the femoral artery, provides the anesthesiologist with a superficial, large artery that has good access to the central arterial tree.
(1) Technique. The axillary artery is most easily entered using a Seldinger technique.
(2) Contraindications. The increased risk of cerebral embolus of air or debris must be recognized. Flushing the arterial line must be performed with caution and low pressure.
e. Brachial artery. The brachial artery is an easily accessible artery located medially in the antecubital fossa.
(1) Brachial artery cannulation is similar to that described for the radial artery. The elbow must be immobilized with a long arm board for stability.
(2) Contraindications. Concern about compromised flow distal to catheter placement has limited its use at many institutions. Brachial catheterization is a secondary option or is not utilized in non-heparinized surgical procedures. A purported benefit has been the elimination of the pressure discrepancy seen occasionally with radial arterial lines in the immediate postbypass period (see Section I.D.4.e).
f. Ulnar artery. The ulnar artery can be used in those rare circumstances when the radial artery cannot be entered easily.
g. Dorsalis pedis and posterior tibialis arteries. In general, the distal location increases distortion of the arterial wave (Fig. 4.7). The dorsalis pedis artery is technically easier to cannulate.
3. Interpretation of arterial tracings. The arterial pressure waveform contains a great deal of hemodynamic information.
a. Heart rate and rhythm. The heart rate can be determined from the arterial pressure wave. This is especially helpful if the patient is being paced or if electrocautery is being used. In the presence of numerous atrial or ventricular ectopic beats, the arterial trace can provide useful information on the hemodynamic consequences of these dysrhythmias (i.e., if an ectopic beat is perfusing).
b. Pulse pressure. The difference between the systolic and diastolic pressures provides useful information about fluid status and valvular competence. Pericardial tamponade and hypovolemia are accompanied by a narrow pulse pressure on the arterial waveform. An increase in pulse pressure may be a sign of worsening aortic valvular insufficiency or hypovolemia.
c. Respiratory variation and volume status. Hypovolemia is suggested by a decrease in arterial systolic pressure with positive-pressure ventilation (pulsus paradox). Positive intrathoracic pressure impedes venous return to the heart with a more pronounced effect in the hypovolemic patient. Because this finding is not uniformly seen in patients with hypovolemia, correlation with other findings can help make the diagnosis.
d. Qualitative estimates of hemodynamic indices. Inferences can be made regarding contractility, stroke volume, and vascular resistance from the arterial waveform. Contractility can be grossly judged by the rate of pressure rise during systole, keeping in mind that heart rate, preload, and afterload can affect this parameter. Stroke volume can be estimated from the area under the aortic pressure wave from the onset of systole to the dicrotic notch. Finally, the position of the dicrotic notch correlates with the systemic resistance. A notch appearing high on the downslope of the pressure trace suggests a high vascular resistance, whereas a low resistance tends to cause a dicrotic notch that is lower on the diastolic portion of the pressure trace. These elements are incorporated into the algorithms of pulse pressure analysis monitors for non-invasive cardiac output (CO).
4. Complications of arterial catheterization
a. Ischemia. The incidence of ischemic complications after radial artery cannulation is low. A classic study demonstrated that although abnormal flow patterns were present in up to 25% of patients between 1 and 7 days after radial artery catheterization, there were no adverse signs of ischemia with these findings [5].
b. Thrombosis. Although the incidence of thrombosis from radial artery catheterization is high, studies have not demonstrated adverse sequelae. Recanalization of the radial artery occurs in a majority of cases. Patients with increased risk include those with diabetes or severe peripheral vascular disease.
c. Infection. With proper sterile technique, the risk of infection from cannulation of the radial artery should be minimal. In a series of 1,700 cases, no catheter site was overtly infected [5].
d. Bleeding. Although transfixing the artery will put a hole in the posterior wall, the layers of the muscular media will seal the puncture. In the patient with a bleeding diathesis, however, there is a greater tendency to bleed. Unlike central venous catheters, arterial catheters are not heparin bonded and thus have increased risk of thrombus development.
4
e. False lowering of radial artery pressure immediately after CPB. The radial artery pressure may be significantly lower than the aortic pressure at the completion of CPB. Forearm vasodilation secondary to rewarming may lead to arteriovenous AV shunting, resulting in a steal phenomenon 5 to 30 min or longer in duration. Alternatively, the inaccuracy of radial pressure may be due to hypovolemia and vasoconstriction. If suspicion arises that a peripheral arterial trace is dampened following CPB, a direct pressure measurement should be obtained from a central site.
5. Recommendations for BP monitoring. In high-risk patients, invasive arterial pressure monitoring should commence prior to induction. Under most circumstances, the radial artery pressure measurement will be sufficient and accurate before and after CPB. In the patient with poor LV function, addition of a femoral arterial catheter before CPB may be warranted. Certain surgical procedures, for example, a thoracoabdominal aortic aneurysm repaired with left heart partial bypass, require both an upper and lower extremity arterial catheters. If an internal mammary artery (IMA) is dissected, retraction of the chest wall and compression of the subclavian artery can dampen or obliterate the radial artery traces. The surgeon should be informed for possible change in retractor position. A dampened radial pressure during IMA harvest may also be associated with a brachial plexus injury.
E. Central venous pressure. CVP measures RA pressure and is affected by circulating blood volume, venous tone, and RV function.
1. Indications
a. Monitoring. Monitoring of CVP is indicated for all cardiac surgical patients.
b. Fluid and drug therapy. CVP can be used to infuse fluid or blood products; as a port for administering vasoactive drugs; and for postoperative hyperalimentation.
c. Special uses. One may elect to place a CVP catheter, with delayed PAC placement in selected patients. Placement of a PAC can be difficult in patients with numerous congenital cardiac disorders, in those with anatomic distortion of the right-sided venous circulation, or in those requiring surgical procedures of the right heart or implantation of a right heart mechanical assist device.
2. Techniques. There are numerous routes by which a catheter can be placed in the central circulation.
a. Internal jugular. The internal jugular vein (IJV) is the most common access route for the cardiac anesthesiologist.
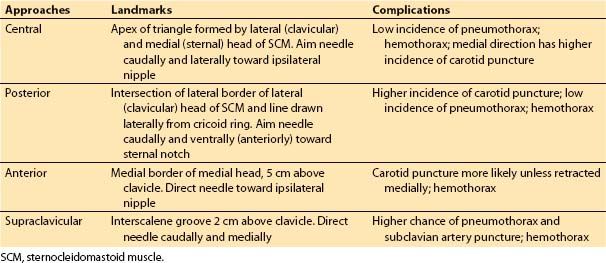
(1) Techniques. Cannulation of the IJV is relatively safe and convenient and various approaches exist for its cannulation (Table 4.4, Fig. 4.10). The process of cannulation, regardless of the approach, involves the steps outlined in Table 4.5.
Table 4.4 Sites for internal jugular cannulation
Related posts:
 Devices for Cardiac Support and Replacement
 Alternative Approaches to Cardiac Surgery with and without Cardiopulmonary Bypass
 Anesthetic Considerations for Patients with Pericardial Disease
 Anesthetic Management for Patients with Congenital Heart Disease: The Pediatric Population
 Anesthetic Management during Cardiopulmonary Bypass
 Anesthetic Management of Myocardial Revascularization
Stay updated, free articles. Join our Telegram channel

Full access? Get Clinical Tree


