INTRODUCTION
Hemodynamic monitoring can identify cardiovascular insufficiency and ensure optimal treatment of the critically ill. Advanced techniques help identify and prioritize various causes of hemodynamic instability and can enable tailored interventions.
Hemodynamic monitoring changes therapeutic decisions in more than 50% of patients and can detect cryptic cardiovascular compromise. We will focus on techniques applicable to the ED: blood pressure monitoring, central venous pressure (CVP) monitoring, cardiac output (CO) monitoring, and blood oxygenation and organ perfusion monitoring (Table 32-1). Use of any technology must be associated with a therapy and a response to therapy—functional hemodynamic monitoring. Applying a technology without a therapeutic strategy limits any potential benefit. In practice, it is best to use more than one approach and monitor therapeutic responses (Table 32-2).1
| Hemodynamic Variable | Method of Measurement |
|---|---|
| Hemoglobin oxygen saturation, % | Pulse oximetry, arterial blood gas analysis |
| Heart rate, beats/min | Physical examination, pulse oximetry, electrocardiography |
| Blood pressure, mm Hg | Sphygmomanometry, oscillometry, intra-arterial catheterization |
| Central venous pressure, mm Hg | Jugular venous pulsation, US, central venous catheterization |
| Cardiac output, L/min | Thoracic bioimpedance or bioreactance, esophageal Doppler US, transcutaneous Doppler US, pulse contour analysis, lithium dilution, transpulmonary (arterial) thermodilution, pulmonary artery thermodilution |
| Central venous oxygen saturation, % | Central venous catheterization for intermittent venous blood sampling or continuous measurement |
| Lactate, mmol/L | Arterial, venous, or capillary sampling |
| Tissue oxygen saturation, % | Near-infrared spectroscopy |
No hemodynamic monitoring technique can improve outcome by itself. Monitoring requirements may vary over time and can depend on local equipment availability and training. There are no optimal hemodynamic values that are applicable to all patients. We need to combine and integrate hemodynamic variables. Measurements of SvO2 can be helpful. A high cardiac output and a high SvO2 are not always best. Cardiac output is estimated, not measured. Monitoring hemodynamic changes over short periods of time is important. Continuous measurement of all hemodynamic variables is preferable. Noninvasiveness is not the only issue. |
ARTERIAL BLOOD PRESSURE
Blood pressure is the force exerted by the circulating blood through a blood vessel. Assessing arterial pressure is very important, as hypotension implies tissue hypoperfusion; shock is a state of organ hypoperfusion but is not always associated with hypotension. Hypotension is always pathologic and reflects a failure of normal circulatory homeostatic mechanisms, whereas normotension does not necessarily indicate cardiovascular stability. Normal blood pressure can occur in the setting of profound circulatory shock in the face of significant vasoconstriction or in a patient with antecedent high arterial pressure. For example, a patient in cardiogenic or hypovolemic shock may remain normotensive because of a marked increase in vascular resistance.
Arterial pressure is the input pressure for organ perfusion and is a function of peripheral vascular resistance and blood flow. There is no absolute level of normal CO in the unstable, metabolically active patient because CO is proportional to metabolic demand. However, organ perfusion pressure becomes compromised as mean arterial pressure (MAP) decreases below 60 mm Hg and/or cardiac index (CO/body surface area) decreases below 2.0 L/min/m2.
Optimal MAP varies depending on the underlying cause of hemodynamic instability. In distributive shock, such as refractory septic shock, increasing MAP >65 mm Hg with fluids and vasopressors increases oxygen delivery but does not improve outcome, indices of organ perfusion, or survival.2
The American College of Cardiology/American Heart Association guidelines in 2004 recommend targeting a systolic pressure of at least 80 mm Hg in patients with acute myocardial infarction. In traumatic brain injury, a systolic pressure <90 mm Hg is an independent predictor for increased morbidity and mortality. A higher blood pressure may be required to maintain optimal cerebral perfusion pressure of 50 to 70 mm Hg (cerebral perfusion pressure = MAP – intracranial pressure), such that MAP <80 mm Hg may be an independent predictor of worse outcome.3 In patients with hemorrhagic shock, delayed fluid resuscitation and toleration of a MAP of 40 mm Hg until definitive surgical intervention may improve survival.4 The International Consensus Conference recommends a target MAP of 40 mm Hg in uncontrolled hemorrhage due to trauma, a MAP of 90 mm Hg for traumatic brain injury, and a MAP >65 mm Hg for other forms of shock.5
NONINVASIVE BLOOD PRESSURE MEASUREMENT
Blood pressure varies with each heartbeat. The systolic pressure is the maximum pressure during ventricular ejection, and the diastolic pressure is the lowest pressure in the blood vessels between heartbeats during ventricular filling. Because the vascular circuit is elastic, both systolic and diastolic pressures vary throughout the vascular system. Systolic pressure can increase by up to 20 mm Hg, while the diastolic pressure similarly decreases as the pressure wave moves peripherally from the aorta. However, MAP (Formula 1) varies by only 1 to 2 mm Hg, whether measured centrally or peripherally; in practice, estimate MAP using the sum of the diastolic pressure and one third of the pulse pressure (Formula 1).6

Ability to palpate the radial, femoral, or carotid pulse in an emergency situation is traditionally thought to represent a minimum systolic pressure of 80, 70, or 60 mm Hg, respectively. However, confirmatory data are lacking, and these estimates may overestimate systolic pressure when compared to invasive measurements in patients with hypovolemic shock.
Auscultation for blood pressure began with the invention of the sphygmomanometer by Scipione Riva-Rocci in 1896 and was later refined by Nicolai Korotkoff in 1905. To auscultate for blood pressure, place a cuff around the upper arm. Hold the bell of the stethoscope over the brachial artery as the cuff is gradually inflated to at least 30 mm Hg above the point at which the radial pulse disappears. Next, deflate the cuff at a rate of 2 to 3 mm Hg per second. The appearance of tapping sounds (Korotkoff sounds) corresponds to the systolic pressure. The diastolic pressure corresponds to the disappearance of Korotkoff sounds. Appropriate cuff size, cuff placement, proper placement of the stethoscope bell, appropriate cuff deflation rate, auscultation of Korotkoff sounds, dysrhythmia, observer bias, and faulty equipment all contribute to variability in the auscultatory method. Ideal cuff sizes are noted in Table 32-3.
An inappropriately small cuff for the size of the arm results in falsely elevated blood pressure measurements. A cuff too large for the size of the arm results in falsely low measurements.
Sphygmomanometric measurements of blood pressure often report slightly higher systolic pressure and lower diastolic pressure than those reported from simultaneous direct measurement using an intra-arterial catheter. This is because the reflected pressure waves summate with cuff inflation and increase systolic pressure, whereas the ischemic vasodilation downstream from the occluded cuff decreases cuff opening diastolic pressure.
Most clinical blood pressure monitors use oscillometry. The amplitude of the fluctuations (or oscillations) in blood pressure in a sphygmomanometer cuff is analyzed and converted to pressure measurements by a computer device without the need for auscultation with the stethoscope. With gradual deflation of the cuff, oscillations begin above systolic pressure. The point of maximum oscillation corresponds to MAP. The systolic and diastolic pressures are estimated by an empiric algorithm. Despite widespread use, controversy exists regarding the accuracy of oscillometric blood pressure monitors. When in doubt, use manual sphygmomanometric measurement of blood pressure.
To measure the beat-to-beat blood pressure and thus provide continuous blood pressure monitoring, Penaz developed a technique with a small finger cuff containing a photoplethysmograph.7 This device estimates blood volume in the finger with a light source on one side of the cuff and an infrared detector on the opposite side. The pressure in the blood vessels is proportional to the pressure in the cuff required to keep the blood volume constant. Special proprietary algorithms adjust for potential measurement errors caused by cold temperature or vasoactive agents.
INVASIVE BLOOD PRESSURE MEASUREMENT
In the vasoconstricted patient, noninvasive blood pressure measurements can underestimate systolic pressure by more than 30 mm Hg. MAP, however, is generally similar, whether measured noninvasively or invasively.8
The arterial catheter can be used for measuring MAP and pulse pressure, for estimating CO, and for repeated blood sampling. The International Consensus Conference for Hemodynamic Monitoring in Shock recommends invasive blood pressure monitoring for patients with refractory shock receiving vasoactive agents.5 Uses for arterial catheterization are described in Table 32-4.
Uses for arterial catheterization in the ED Guides management of vasodilator or vasopressor drug to maintain target mean arterial pressure and avoid hypotension Provides access port for the repetitive sampling of arterial blood in patients Allows monitoring of cardiovascular deterioration in patients at risk for cardiovascular instability Allows calculation of pulse pressure variation and cardiac output via pulse contour analysis Useful applications of arterial catheterization in the diagnosis of cardiovascular insufficiency Differentiate cardiac tamponade (pulsus paradoxus) from respiration-induced swings in systolic pressure Tamponade reduces the pulse pressure but keeps diastolic pressure constant. Respiration reduces systolic and diastolic pressure equally, such that the pulse pressure is constant. Differentiate hypovolemia from cardiac dysfunction as the cause of hemodynamic instability Systolic pressure decreases after a positive-pressure breath as compared to an apneic baseline during hypovolemia. Systolic pressure increases during positive-pressure inspiration when left ventricular contractility is reduced. |
The radial artery is used most frequently for arterial catheterization. The femoral artery is an alternative in emergent situations, and often easier to access than the radial artery, especially in hypotensive patients. Other potential sites include the axillary, brachial, dorsalis pedis, ulnar, tibialis posterior, and temporal arteries, although these sites are rarely used (see chapter 31, “Vascular Access.”)
In the presence of vasoconstriction, femoral arterial blood pressure measurements are more accurate than radial artery measurements. The risk for infection and limb ischemia is similar between radial and femoral artery cannulation (Table 32-5).9 The primary risk of emergent femoral arterial catheterization is trauma to the artery during catheter insertion, with potential development of a pseudoaneurysm or retroperitoneal hematoma.
Placement of an intra-arterial catheter requires knowledge of the anatomic landmarks of the selected site. US guidance may be used.
The catheter can be inserted directly over a needle or by using the Seldinger technique over a guidewire. The Allen test, used to confirm collateral blood flow before radial artery catheterization, is inaccurate in predicting postcatheterization hand ischemia. In patients with profound hypotension, a cutdown may be required to cannulate the artery. After successful arterial catheterization, connection of the catheter to the pressure transducer should reveal an arterial waveform. The square wave flush test is applied to determine if artifacts in the tubing and recording system are damping the pressure measurements. See Figure 32-1 for the square wave flush test with intra-arterial blood pressure measurement.
FIGURE 32-1.
Square wave flush test with intra-arterial blood pressure measurement. During a flush bolus of the catheter tubing, a square wave is observed. The number of oscillations after the square wave at the end of the bolus and prior to returning of the blood pressure tracing may result in an overestimated or underestimated blood pressure.
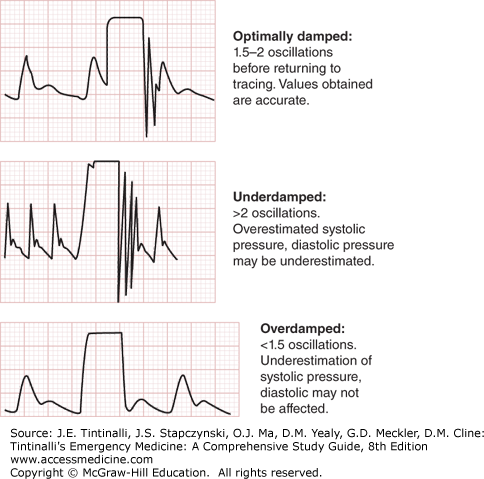
An overdamped system suggests that trapped air bubbles in the tubing are falsely lowering pressure measurements. An underdamped system will overestimate systolic pressure and underestimate diastolic pressure. Of note, in both situations, MAP is the most accurate measure. Flushing the system should remove the air bubbles. If this does not fix the problem, replace the tubing.
CENTRAL VENOUS PRESSURE MONITORING
By definition, CVP is the back pressure to systemic venous return, with high values indicating larger than normal volume returning to the heart from the systemic circulation. A number of factors contribute to the CVP value (Table 32-6). The use of CVP monitoring as a guide to resuscitation in critically ill patients is a subject of debate.
Central venous blood volume Venous return Cardiac output Total blood volume Compliance of the central compartment Vascular tone Right ventricular compliance Myocardial disease Pericardial disease Tamponade Tricuspid valve disease Stenosis Regurgitation Dysrhythmia Junctional rhythm Atrial fibrillation Atrioventricular dissociation Reference level of transducer Positioning of patient Intrathoracic pressure Respiratory changes Intermittent positive pressure ventilation Positive end-expiratory pressure Tension pneumothorax |
Related posts:


Stay updated, free articles. Join our Telegram channel

Full access? Get Clinical Tree


