(1)
Division of Pulmonary and Critical Care Medicine, Eastern Virginia Medical School, Norfolk, VA, USA
Keywords
Fluid resuscitationIntravascular volumeFluid responsivenessSalineStroke volumeFrank-Starling CurveRingers lactateAlbuminVolume assessmentPassive leg raisingCentral venous pressureThe illiterate of the 21st Century will not be those who cannot read and write, but those who cannot learn, unlearn and relearn
Alvin Toffler, Writer and futurist (1928–)
THIS IS THE MOST IMPORTANT CHAPTER OF THIS BOOK. IT IS COMPULSORY READING.
Current “wisdom” suggests that aggressive fluid resuscitation is the best initial approach to the patient with hemodynamic instability. The source of this wisdom is difficult to discern, however, “Early Goal Directed therapy” (EGDT) as championed by River’s et al. [1] appears to have established this as the irrefutable truth. However, over the last decade it has become clear that aggressive fluid resuscitation is associated with increased morbidity and mortality across a diverse group of patients, including patients with severe sepsis (see Chap. 12), ARDS [2], as well as surgical and trauma patients and those with pancreatitis.
Alert
Excess fluid leads to iatrogenic salt water drowning.
Multiple RCT’s and cohort studies have demonstrated that a conservative fluid strategy in patients undergoing elective non-cardiac surgery is associated with significantly fewer complications with a lower mortality (in the high risk patients) than patients managed with the traditional liberal fluid strategy in which fluids are administered to fill the non-existent “third space” [3–5]. For patients with traumatic injuries, high volume fluid resuscitation as promoted by the early Advanced Trauma Life Support (ATLS) strategy [6], has given way to a “damage control” resuscitation strategy [7]. This approach has seen a fall in the volume of crystalloid delivered in the emergency department and an associated fall in mortality. In a prospective analysis of 3,137 trauma patients’ treated in the Emergency Department, fluid volumes of 1.5 l or more were significantly associated with mortality [8]. This observation is supported by a meta-analysis which demonstrated in both RCT’s and cohort studies that a conservative fluid strategy was associated with a lower mortality in trauma patients [9]. Similarly, an aggressive fluid strategy in the resuscitation of patients with acute pancreatitis has been associated with an increased risk of complications [10]. The results of multiple studies across diverse patient populations have clearly demonstrated that aggressive fluid “loading” is associated with an increased risk of complications and death. The only published study conducted in humans that has demonstrated that early aggressive fluid resuscitation “improves” outcome is the EGDT study by Rivers et al. [1]. However the results of this study are implausible and likely not true. These observations have resulted in a major paradigm shift in the techniques used to assess volume status and the approach to fluid resuscitation; fluid resuscitation serves as the prime example of the “less is more” paradigm. While hypovolemia will result in decreased cardiac output (and blood pressure) with inadequate organ perfusion leading to organ dysfunction, overzealous fluid resuscitation and hypervolemia induces a cascade of events that similarly results in organ dysfunction. From an evolutionary point of view we have evolved to deal with hypovolemia and not hypervolemia. The argument is no longer “wet or dry” but “just the right amount of fluid”. This is not an easy determination and requires an evaluation of the patient’s hemodynamics, organ perfusion, cardiac function and an assessment of “fluid responsiveness” in addition to understanding the patients’ clinical condition. It is no longer acceptable to pour in liters of fluid and “see what happens”. In addition to understanding that we need to precisely titrate fluid volumes we have also gained much better insight into which fluid to give. It is also import to note that at 3 h only 15 % of a crystalloid bolus remains intravascular in normal health volunteers, while in experimental sepsis models almost 100 % of the fluid bolus filters into the interstitium [11–13]. This can’t be a good thing. It would therefore appear that clinicians are required to unlearn the traditional methods of fluid resuscitation and embrace the new approach.


The first step in the hemodynamic management of critically ill patients is to determine the adequacy of tissue/organ perfusion. While the signs of shock may be obvious, those of sub-clinical hypoperfusion may be more subtle. The signs of hypoperfusion include:
Mean arterial pressure (MAP) < 65 mmHg
Tachycardia with narrow pulse pressure
Decreased urine output
Altered mentation
Poor capillary refill
Skin perfusion/mottling
Cold extremities (and cold knees)
It should be noted that hypotension and tachycardia reflect significant volume depletion. A blood loss of about 1 l is required before a patient develops a tachycardia and about 1.5 l before the blood pressure begins to drop. In those patients with hypotension or evidence inadequate tissue perfusion, fluid resuscitation is generally regarded as the first step in resuscitation. Clinical studies have, however, demonstrated that only about 50 % of hemodynamically unstable critically ill patients (In ER, ICU or OR) are volume responsive [14].
Alert
Fluid responsiveness is generally defined as a significant increase (> 10–15 %) in stroke volume in response to a fluid challenge (usually 500 cm3). Fluid responsiveness occurs only in patients with biventricular preload responsiveness.
Fundamentally, the only reason to give a patient a fluid challenge is to increase stroke volume (volume responsiveness). If the fluid challenge does not increase stroke volume, volume loading serves the patient no useful benefit (and is likely harmful). According to the Frank-Starling principle as the preload increases left ventricular (LV) stroke volume increases until the optimal preload is achieved at which point the stroke volume remains relatively constant (Fig. 9.1). This optimal preload is related to the maximal overlap of the actin-myosin myofibrils. It is important to note that in an intact heart the actin-myosin links cannot be disengaged and hence there is no descending limb of the Frank-Starling curve. Once the left ventricle is functioning near the “flat” part of the Frank-Starling curve fluid loading has little effect on the stroke volume. In normal physiologic conditions, both ventricles operate on the ascending portion of the Frank-Starling curve [15]. This mechanism provides a functional reserve to the heart in situations of acute stress. In normal individuals, an increase in preload (with volume challenge) results in a significant increase in stroke volume [16].
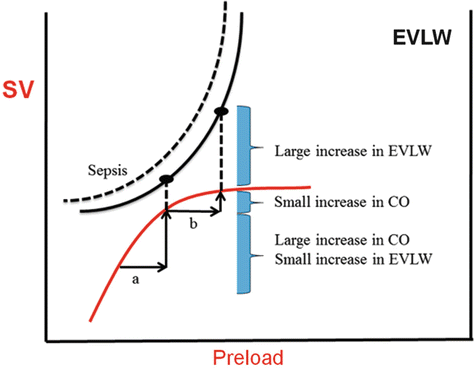

Fig. 9.1
Superimposition of the Frank-Starling and Marik-Phillips curves demonstrating the effects of increasing preload on stroke volume and lung water in a patient who is pre-load responsive (a) and non-responsive (b). With sepsis the EVLW curve is shifted to the left. EVLW extra-vascular lung water, CO cardiac output, SV stroke volume
An analysis of the overlapping Frank-Starling and extra-vascular lung water (EVLW) curves demonstrate that as patients’ become less fluid responsive EVLW (and tissue edema) increase markedly (see Fig. 9.1) due to increased cardiac filling pressures and transmitted hydrostatic pressures [17]. This process is accentuated in patients with endothelial damage (sepsis, ARDS, pancreatitis, burns) [18]. It should be noted that as “one” climbs up the Frank-Starling Curve “one” get diminishing returns; a smaller increase in SV with greater propensity to develop tissue edema. Increased cardiac filling pressures trigger the release of natriuretic peptides, presumably to assist in fluid removal. What is most disturbing about this sequence of events is that natriuretic peptides cleave membrane-bound proteoglycans and glycoproteins (most notably syndecan-1 and hyaluronic acid) off the endothelial glycocalyx (see below) [19, 20]. The endothelial glycocalyx plays a major role in regulating endothelial permeability [21]. Therefore, excessive volume expansion increases the release of natriuretic peptides which in turn damages the endothelial glycocalyx and this is followed by a rapid shift of intravascular fluid into the interstitial space leading to a marked increase in EVLW and tissue edema [19, 20]. To make matters even worse, natriuretic peptides inhibit the lymphatic propulsive mechanism and the return of lymph into the vascular system further aggravating tissue edema [22, 23].
The Endothelial Glycocalyx
The vascular endothelium is coated on the luminal side by the endothelial glycocalyx [25–27]. The glycocalyx is a web of membrane-bound glycoproteins and proteoglycans associated with various glycosaminoglycans which contribute to the volume of the layer (see Fig. 9.2). These membrane-bound proteoglycans and glycoproteins, together with bound plasma constituents, build up to the physiologically active endothelial surface layer with a functional thickness of over 1 mm. The glycocalyx has a major role in the vascular barrier function and in preventing large macromolecules moving across the endothelium, preventing leucocyte adhesion and platelet aggregation, mitigating inflammation and limiting tissue edema (see Fig. 9.3a, b). A non-circulating part of plasma volume of about 700–1,000 ml in humans is fixed within the endothelial glycocalyx but in dynamic equilibrium with the circulating plasma. A certain plasma concentration of albumin seems to be a required to maintain the functional integrity of the endothelial surface layer. The glycocalyx is semi-permeable with respect to anionic macromolecules such as albumin and other plasma proteins, whose size and structure appear to determine their ability to penetrate the layer. Red blood cells are excluded from the glycocalyx. The glycocalyx is compromised in systemic inflammatory states such as diabetes, hyperglycemia, surgery, trauma, and sepsis. Inflammatory mediators which have been implicated so far include C-reactive protein, A3 adenosine receptor stimulation, tumour necrosis factor, bradykinin, and mast cell tryptase. In addition, hypervolemia, through the release of natriuretic peptides damages the glycocalyx.

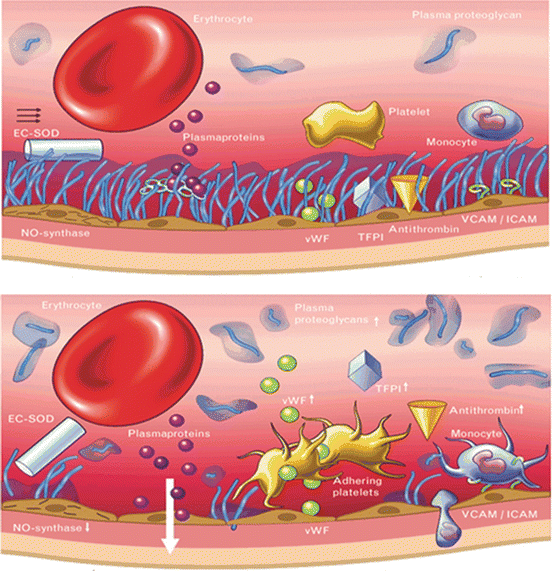


Fig. 9.3
(a) Normal glycocalyx [24]. (b) Damaged glycocalyx with loss of barrier function, Reproduced with permission from Lippincott Williams and Wilkins/Wolters Kluwer Health, Current Opinion in Lipidology 2005;16:507-511
In clear contrast to the traditional assumption, transcapillary fluid loss actually seems to be limited by an oncotic pressure gradient across the endothelial glycocalyx, a structure that was unknown to Ernest Starling (see Fig. 9.2) [5]. Therefore, his classical principle needs to be updated, taking into consideration the current knowledge indicating a strong dependency of vascular integrity on the integrity of the endothelial glycocalyx. An intact endothelial glycocalyx is obviously a prerequisite of a functioning vascular barrier. Furthermore, fluid moves in a unidirectional manner, from the vasculature (leaking from the capillaries or post-capillary venules) into the interstitium and then retuning into the vascular system via the lymphatics. The Starling concept that fluids moves into the interstitium at the arterial side of the vasculature and is then absorbed by oncotic forces on the venous end, does not occur. Interstitial fluid does not move directly back into the vasculature. Therefore, the concept of giving a colloid to “suck” fluid back into the vasculature is a MYTH. However, unlike crystalloids and hetastarch, albumin increases the ESL (glycocalyx) thereby limiting but not preventing the transcapillary fluid flux.
Only patients who are likely to show a significant increase in SV with a fluid challenge and in whom the increased SV is considered to be beneficial should be given a fluid challenge. Furthermore, all attempts should be made to limit the volume of fluid administered. This begets the question of how to predict fluid responsiveness? After Hughes and Magovern described the technique of central venous pressure (CVP) monitoring in 1959 this method became a standard tool for guiding fluid therapy [28]. It has now been clearly established that there is a poor relationship between the CVP and intravascular volume status and no relationship between the CVP and fluid responsiveness [29]. In 1970 the flow-directed pulmonary artery catheter (PAC) was developed by Swan and Ganz allowing measurement of the pulmonary artery occlusion pressure (PAOP). However, the PAOP suffers from the same limitation as the CVP and multiple studies have demonstrated that, like the CVP, the PAOP is unable to predict fluid responsiveness [30, 31].
Alert
The central venous pressure (CVP) and pulmonary artery occlusion pressure (PAOP) SHOULD NEVER be used to make decisions regarding fluid management.
The CVP and PAOP are a measure of right and left atrial pressure respectively. These pressure measurements have NO relationship with a patient’s intravascular volume status nor are they indicators of fluid responsiveness.
The PAC may be useful when performing tribal rituals.
While there is a poor relationship between blood volume and CVP and while there is no relationship between fluid responsiveness and the CVP (or change in CVP following a fluid bolus) in any individual patient the CVP tends to increase with fluid loading. In some patients however, the CVP may fall with fluid loading due to decreased sympathetic tone and decreased venoconstriction. The change in the CVP following a fluid challenge is frequently used to guide further fluid management. This strategy was described several decades ago by Weil and Henning who proposed the 2–5 CVP Rule [32]. According to this scheme, the CVP is measured at 10 min intervals. If the change in CVP was < 2 mmHg, the infusion was continued, if it was in the 2–5 mmHg the infusion was interrupted and reevaluated after a 10 min wait. If the change was > 5 mmHg the infusion was stopped [32, 33]. However the 2–5 CVP rule is unable to predict fluid responsiveness in patients with both a low CVP (< 12 mmHg) or a high (> 12 mmHg) CVP. EGDT and the Surviving Sepsis Campaign recommend targeting a CVP > 8 mmHg (8–12 mmHg on mechanical ventilation [1, 34]. This is likely a very bad idea. It is important to recall that a normal CVP is close to ZERO. Furthermore, a rapid fluid bolus is likely to distend the cardiac chambers with the release of BNP; also a very bad thing. Apart from resulting in gross fluid overload a high CVP in itself is a very bad thing.
Following the “widespread” recognition that the CVP/PAOP had no utility in guiding fluid resuscitation [30], the idea that heart-lung interactions during mechanical ventilation could be used to predict fluid responsiveness gained some popularity [38, 39]. The principles underlying this technique are based on simple physiology (see Fig. 9.4) [17, 40]. Intermittent positive-pressure ventilation induces cyclic changes in the loading conditions of the left and right ventricles. Mechanical insufflation decreases preload and increases afterload of the right ventricle (RV). The reduction in RV preload and increase in RV afterload both lead to a decrease in RV stroke volume, which is at a minimum at the end of the inspiratory period. The inspiratory reduction in RV ejection leads to a decrease in left ventricular (LV) filling after a phase lag of two or three heart beats. The cyclic changes in RV and LV stroke volume are greater when the ventricles operate on the steep rather than the flat portion of the Frank-Starling curve [17, 40]. A pulse pressure variation (PPV) or stoke volume variation (SVV) of greater than 13 % were shown to be predictive of fluid responsiveness (see Fig. 9.5) [38, 39]. In a meta-analysis published in 2009 it was demonstrated that the PPV was highly predictive of fluid responsiveness (ROC of 0.94) [14]. Due to its sound physiological basis, good predictive ability and apparent simplicity this technique was met with great enthusiasm and algorithms based on this principle were developed for use in the OR and ICU [42, 43]. However, what was not fully appreciated when the meta-analysis was published was that almost all the studies were performed in a highly controlled environment (usually the OR) in a highly select group of patients [14]. It soon became apparent that a large number of clinical factors interacted to limit the accuracy of the PPV/SVV in predicting fluid responsiveness [44, 45].
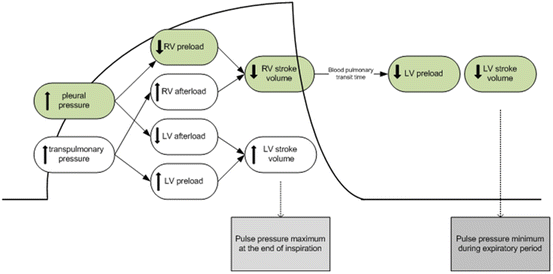
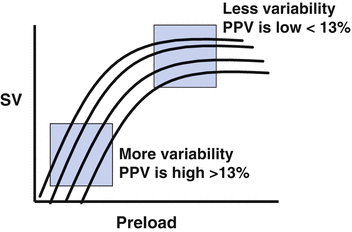

Fig. 9.4
Heart lung interaction during mechanical ventilation [41]. Reproduced with permission from Biomed Central. Crit Care 200; 4:282

Fig. 9.5
PPV and position on Frank-Starling Curve
Conditions which need to be met (ALL) to ensure accuracy of PPV/SVV:
Sinus Rhythm
Volume cycled ventilation with Vt of at least 8 ml/kg IBW
No ventilator-patient dyssynchrony
Heart rate/respiratory rate ratio >3.6
Normal chest wall compliance (Δ intra-pleural pressure)
No evidence of cor pulmonale- pulmonary hypertension
Normal intra-abdominal pressure
Normal pulmonary compliance
In a cohort of cardiac surgical patients Lansdorp and colleagues demonstrated that PPV/SVV did not predict volume responsiveness in routine clinical practice [46]. Multiple studies have now confirmed these findings [47, 48]. In the largest study to date, Canneson and colleagues demonstrated that despite a strong predictive value, the PPV was inconclusive in predicting fluid responsiveness in 25 % of patients during general anesthesia [49]. The utility of the PPV/SVV in the ICU appears significantly worse [47, 48]. In a multicenter, point prevalence study Mahjoub and colleagues demonstrate that only 2 % of ICU patients met the validity criteria for using the PPV to assess fluid responsiveness [50]. Furthermore, only 3 % of patients with an arterial line in place satisfied all the validly criteria. These data suggest that due to the frequency of confounding factors the PPV/SVV should not be used as the primary technique for directing fluid management in the OR and ICU. Nevertheless intravascular volume depletion should be suspected in patients who demonstrate marked PPV evident on either an arterial pressure waveform or pulse oximetric waveform. However, in these situations other tests should be performed to confirm fluid responsiveness (see below).
Echocardiographic Assessment of Fluid Responsiveness
Bed-side echocardiography allows for the rapid determination of LV and RV function, as well the detection of cardiac tamponade and major valvular disease. This evaluation plays a major role in the initial and ongoing assessment of patients with hemodynamic instability [51–54]. While echocardiography can usually support a diagnosis of severe volume depletion, it is less useful in assessing fluid responsiveness.
Static Echocardiographic Parameters
The CVP and PAOP (left atrial pressure) can be approximated by echocardiography. In spontaneously breathing patients there is a fairly good correlation between the size of the IVC and the CVP. However, as the CVP is unrelated to volume status or fluid responsiveness this becomes a meaningless exercise. Feissel et al. demonstrated that the absolute IVC size failed to predict fluid responsiveness in patients with septic shock [55]. A completely collapsed IVC is suggestive of hypovolemia, however, this assessment is usually obvious by clinical examination alone.
The RV and LV diastolic diameter or area have been used as a measure of preload. However, Tavernier et al. and Feissel et al. have demonstrated that LV size (left ventricular end diastolic area-LVEDA) is not a useful predictor of fluid, unless LV is very small and hyperkinetic [39, 56]. A meta-analysis by Marik et al demonstrated the failure of the LVEDA to predict volume responsiveness in mechanically ventilated patients [14].
Dynamic Echocardiographic Parameters
The degree of respiratory variation in venal caval cross-sectional area during both spontaneous breathing and mechanical ventilation has been proposed to be predictor of fluid responsiveness. However the respiratory variation in vena caval diameter is just an indirect measurement of the CVP, which as we well know is unable to predict fluid responsiveness. The respiratory variation of the IVC during spontaneous breathing appears to have become quite popular in the Emergency Department setting. This technique has been poorly validated and likely to lack sufficient accuracy to be clinically useful [57, 58].
Analysis of the respiratory changes of LV stroke volume during mechanical ventilation provides a dynamic, biventricular evaluation of preload dependence. The respiratory changes of stroke volume can be estimated by Doppler analysis of velocity-time integral (VTI) during TTE or TEE.
This technique has the same limitation as those for PPV/SVV. Furthermore, this technique is very operator dependent and can only be performed by clinicians with advanced training in echocardiography.
Ultimately only two techniques are currently available which can be used to determine fluid responsiveness with a high degree of accuracy, namely the passive leg raising maneuver (PLR) and the fluid challenge [17, 40, 59, 60]. These techniques are best coupled with minimally invasive cardiac output monitors (see Chap. 10) which can track changes in SV and cardiac output dynamically and in real time [17, 40]. Changes in carotid artery flow measured by Doppler is another method to assess the response to either a fluid challenge of PLR maneuver [48, 61]. For obvious technical reasons the fluid challenge technique is preferred during anesthesia while the PLR is preferred in the ICU and post-operatively. The various methods to assess fluid responsiveness, grouped by diagnostic accuracy are listed in Table 9.1.
Table 9.1
Techniques for assessing fluid responsiveness
Static pressure and volume parameters (ROC ~ 0.5–0.6) |
Central venous pressure (CVP) |
Pulmonary artery occlusion pressure (PAOP) |
Inferior vena cava (IVC)/superior vena caval (SVC) diameter |
Flow corrected time (FTc) |
Right ventricular end-diastolic volume (RVEDV) |
Left ventricular end-diastolic volume (LVEDV) |
SVC/IVC variation during mechanical ventilation |
Dynamic techniques based on heart–lung interactions (ROC ~ 0.7–0.8) |
Pulse pressure variation (PPV) |
Stroke volume variation (SVV) |
Pleth variability index (PVI) |
Aortic blood flow (Doppler or echocardiography) |
Techniques based on real or virtual fluid challenge (ROC ~ 0.9) |
Passive leg raising (PLR) |
Rapid fluid challenge (200–300 cm3) |
Passive Leg Raising (PLR)
In the initial stages of resuscitation in the emergency department, ward or ICU most patients are not intubated and are breathing spontaneously. In addition, with the reduced use of sedative agents in the ICU many critically ill patients are ventilated with modes of ventilation that allow spontaneous breathing activity. These factors limit the use of heart-lung interactions to determine fluid responsiveness.
Lifting the legs passively from the horizontal position induces a gravitational transfer of blood from the lower limbs toward the intrathoracic compartment (see Fig. 9.6) [62, 63]. Beyond its ease of use, this method has the advantage of reversing its effects once the legs are tilted down [64, 65]. Therefore, PLR may be considered a reversible “auto-transfusion”. The ability of PLR to serve as a test of preload responsiveness has been confirmed in multiple studies performed in critically ill patients [59, 65–72]. The change in aortic blood flow (measured by esophageal Doppler) during a 45° leg elevation was shown to predict the changes in aortic blood flow produced by a 500 ml fluid challenge even in patients with cardiac arrhythmias and/or spontaneous ventilator triggering, situations where PPV lost its predictive ability [65]. A meta-analysis, which pooled the results of eight studies, confirmed the excellent value of PLR to predict fluid responsiveness in critically ill patients with a global area under the ROC curve of 0.95 [59]. The best way to perform a PLR maneuver to predict volume responsiveness is to elevate the lower limbs to 45° (automatic bed elevation or wedge pillow) while at the same time placing the patient in the supine from a 45° semi-recumbent position (see Fig. 9.6). Starting the PLR maneuver from a total horizontal position may induce an insufficient venous blood shift to significantly elevate cardiac preload [73]. By contrast, starting PLR from a semi-recumbent position induces a larger increase in cardiac preload as it induces the shift of venous blood not only from both the legs but also from the abdominal compartment [74]. In should be noted that intra-abdominal hypertension (an intra-abdominal pressure of >16 mmHg) impairs venous return and reduces the ability of PLR to detect fluid responsiveness [75].
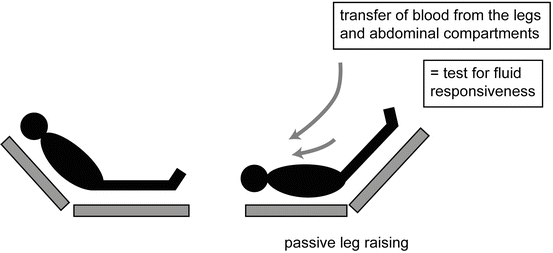

Fig. 9.6
Passive leg raising (PLR) maneuver
Since the maximal hemodynamic effects of PLR occur within the first minute of leg elevation [65], it is important to assess these effects with a method able to track changes in cardiac output or stroke volume on a real-time basis. In this regard, the response of ascending (measured by suprasternal Doppler) [76, 77] or descending (measured by esophageal Doppler) aortic blood flow [65, 66] or velocity-time integral (measured by transthoracic echocardiography) [67, 68] following a PLR has been demonstrated to be helpful in predicting the response to volume administration. Echocardiographic/Doppler techniques require significant expertise are operator dependent and not conducive to continuous real-time monitoring. Until recently, continuous real-time cardiac output monitoring required a thermodilution pulmonary artery catheter. During the past decade, several less invasive methods have been developed. These techniques include transpulmonary thermodilution, pulse-contour analysis and bioreactance which are ideally suited to track the change in SV following a PLR maneuver (see Chap. 10). In patients in whom the SV decreases with the PLR maneuver cor-pulmonale with displacement of the interventricular septum should be suspected. An ECHO should be performed in this circumstance (see Chap. 10).
In approximately 5 % of patients the PLR will give a false negative result. This may occur due to incorrect performance of the technique. In addition, it is likely that thin/emaciated patients have a reduced venous reservoir in their legs due to loss of muscle mass, resulting in an inadequate “bolus” effect with leg raising. In patients with a borderline PLR response or in those patients who are clinically suspected to have intravascular volume depletion despite a negative PLR, a fluid challenge should be performed (see Table 9.2).
Table 9.2
72 year old emaciated male patient with chronic lymphatic leukemia
Time | CI | SVI | Challenge/PLR | Post CI | Post SVI | ∆SVI % |
|---|---|---|---|---|---|---|
9:20 | 2.5 | 20 | PLR | 2.6 | 23 | 9.8 |
10:10 | 2.9 | 24 | Challenge | 3.9 | 33 | 35.4 |
The Fluid Challenge
The gold standard to determine fluid responsiveness is the change in SV following a fluid challenge. The disadvantage of this technique is that a bolus of fluid is given to a patient who may not benefit. However, the non-responder should receive no more fluid; and the small volume given should “hopefully” do little harm. While hetastarch was previously used for fluid challenges this can no longer be recommended (5 % albumin is okay). As crystalloids redistribute very quickly the fluid bolus should be given as quickly as possible. A bolus of between 200 and 300 cm3 is given, the volume determined in part by the rate of infusion. Muller et al reported that a “mini-fluid” challenge with 100 ml colloid over 1 min was highly predictive of fluid responsiveness [60].
Alert
A change in blood pressure following a PLR or fluid challenge is a poor guide to fluid responsiveness. SV may increase without a significant change in blood pressure [78].
The Patient is fluid responsive. So What Next!
Nothing
Do not need to increase CO
Increased lung water
Fluid bolus of 250–500 cm3 LR (see below)
Give vasoconstrictor
increase venous return secondary to α-agonist mediated venoconstriction (sepsis and anesthesia)
NOT all patients who are fluid responsive require a fluid bolus. Normal healthy people are fluid responsive (have preload reserve). In patients who are fluid responsive and are hypotensive or have signs of poor organ perfusion a fluid bolus (500 cm3) should be strongly considered. However, this decision should be based on the patient’s clinical status, overall fluid balance and oxygenation. Repeat fluid boluses in fluid responsive patients should be based on the same ongoing assessment. Low dose norepinephrine should be considered in hypotensive patients who are fluid-non responders (or poor responders), those with acute lung injury and those with severe sepsis (see Chap. 12). Fluid boluses should not be given to patients who are non-responders. The CXR is a poor indicator of pulmonary edema (lung water) and the measurement of extra-vascular lung water (EVLW) by transpulmonary thermodilution is recommended in those patients in whom the management of fluids and pressors is particularly troublesome (see Chap. 10)… and when all else fails consult Dr. Harry Potter.
Fluid Boluses in Volume Responsive Patients
The first description of the use of intravenous fluid in a human is attributed to Dr. Thomas Latta during the Cholera epidemic in London in 1831–1832. Dr. Latta described his experience in a letter to the editor of the Lancet [79].


Dr. Latta first attempted to replace the lost fluid and salts ‘by injecting copiously into the larger intestine warm water, holding in solution the requisite salts, and also administered quantities from time to time by mouth…’ [80, 81]. He found there to be no permanent benefit and indeed he considered that the unfortunate sufferers’ vomiting and purging were aggravated. Latta wrote ‘finding thus, that such, in common with all the ordinary means in use, was either useless or hurtful, I at length resolved to throw the fluid immediately into the circulation.’ The injected solution was made up of ‘two to three drachms of muriate of soda and two scruples of the subcarbonate of soda in six pints of water’ (equivalent to approximately ½ Ringers lactate). He described how ‘having no precedent to guide me I proceeded with much caution.’ His first patient was an elderly woman who had been given ‘all the usual remedies’ and who had ‘apparently reached the last moments of her earthly existence, and now nothing could injure her.’ Latta inserted a tube into the basilic vein and injected ounce (30 ml) after ounce of fluid closely observing the patient—at first with no visible effect—but then she began to breathe less laboriously and ‘soon the sharpened features, and sunken eye, and fallen jaw, pale and cold, bearing the manifest imprint of death’s signet, began to glow with returning animation; the pulse returned to the wrist…’ after six pints (2.8 l) of fluid had been injected, the woman announced in a strong voice that she was now ‘free from all uneasiness’; her extremities were warm, and Latta, thinking that his patient was now safe, left her in the charge of the hospital surgeon who described this experience (the patient ultimately died in the hands of the surgeon!!).
having no precedence to guide me I injected ounce after ounce of fluid closely observing the patient —Thomas Latta, Physician, (1798–1833)Stay updated, free articles. Join our Telegram channel

Full access? Get Clinical Tree


