Fig. 70.1 A normal FVL
Questions
- 1.
Draw a normal flow volume loop. Label the x- and y-axes. Where is the residual volume and total lung capacity located? Show where expiration and inspiration are represented.
- 2.
Regarding patient effort, what is required from the patient for a flow volume loop to be accurate? What type of patients might have difficulty with a FVL?
- 3.
Where is the peak expiratory flow rate (PEFR) located on the FVL? What are the normal values for PEFR for adult females and males? Besides a respiratory problem, what are major influences on the PEFR?
- 4.
Where does an FVL start? What direction does the FVL follow?
- 5.
Draw an FVL for a patient with mild COPD. Describe some key characteristics. Explain what happens to the FVL whenever there is severe COPD.
- 6.
Draw an FVL for a patient with vocal cord paralysis.
- 7.
Explain what an FVL for a patient with a fixed obstruction such as a goiter looks like.
- 8.
What does an FVL typically look like for restrictive lung disease?
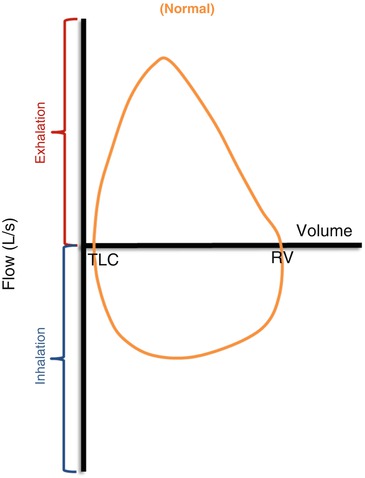
Fig. 70.1a Normal flow volume loop with labels
Answers
- 1.
Refer to Fig. 70.1a. The y-axis represents the flow rate. On this same axis exhalation is found in the area above the x-axis, and inhalation is represented below the x-axis. The lung volume is plotted on the x-axis and the value decreases from left to right. In other words, the x-axis starts at total lung capacity at the left end, and the volume decreases progressively until residual volume is reached at the far right.Related posts:

Stay updated, free articles. Join our Telegram channel

Full access? Get Clinical Tree


