Fig. 11.1
Standard 10–20 system for location of EEG scalp electrode placement (i.e., montage). The number 10 indicates distance in percentage (10 %) from nasion and inion to adjacent frontal and occipital electrodes, respectively. The number 20 indicates distance in percentage (20 %) among remaining electrodes. Leads on the left side have odd numbers, and leads on the right side have even numbers. F indicates frontal; T temporal, C central, P parietal, O occipital. Midline (vertex) electrodes are denoted with the letter z, which indicates zero

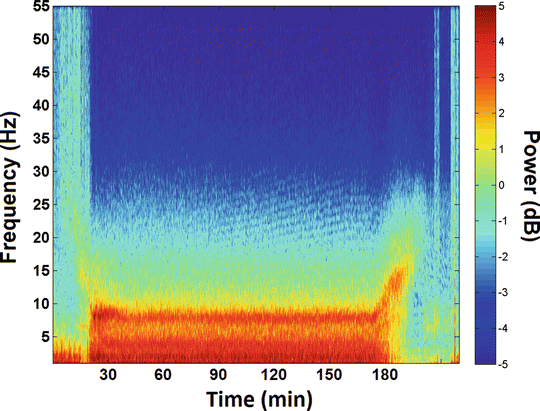
Fig. 11.2
Example spectrogram is depicted, with time (min) on the x-axis, EEG frequency (Hz) on the y-axis, and power (dB) on the z-axis
At depths consistent with general anesthesia , propofol predominantly displays alpha, delta, and slow oscillations on the raw EEG (Fig. 11.3a). On the corresponding spectrogram, high power is demonstrated in these corresponding frequency bandwidths (Fig. 11.3b). Ether-based volatile anesthetics (e.g., isoflurane, sevoflurane, desflurane) demonstrate a similar pattern on the raw EEG, which is characterized by alpha, theta, delta, and slow oscillations (Fig. 11.3a). On the spectrogram, high power is demonstrated in these bandwidths, often with more theta power compared to the propofol spectrogram (Fig. 11.3b). Halogenated ethers and propofol share similar neurophysiologic traits with non-rapid eye movement (NREM) sleep. For example, coherent oscillatory spindle activity is present with both propofol sedation and NREM sleep, which is believed to reflect a breakdown of thalamocortical processing [11–13]. Asynchronous slow-wave oscillations are also noted during both sleep and propofol anesthesia, which may represent fragmented cortical connectivity [11, 14].


Fig. 11.3
Comparison of raw EEG and spectrogram patterns among different anesthetic classes. (a) Raw EEG patterns are displayed for each anesthetic class represented. Faster frequencies are appreciated with ketamine compared to other anesthetics. (b) Each anesthetic drug class corresponds to a specific spectrogram signature, which may reflect nuances in molecular and circuital properties in each class (Reproduced from Purdon et al. [56]; with permission)
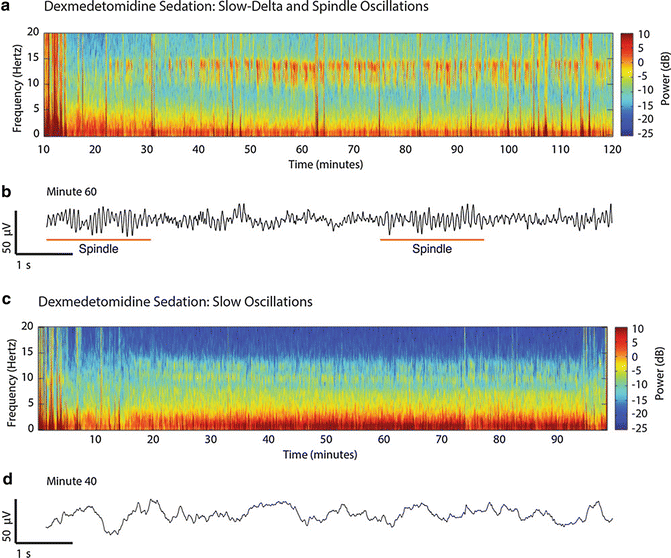
Uniquely, ketamine anesthesia is associated with increased beta and gamma oscillatory activity on the raw EEG (Fig. 11.3a). This stands in contrast with the lower frequency patterns of propofol and ether-based volatile agents. During general anesthesia with ketamine, increased power is noted in the gamma range, particularly near 30 Hz (Fig. 11.3b). Lastly, dexmedetomidine induces characteristic EEG changes that vary depending on the depth of sedation. For example, during periods of light sedation, increased power is noted in the low-beta range on the spectrogram (Fig. 11.4a), which likely reflects the presence of spindle patterns on the raw EEG also similar to those observed during NREM sleep (Fig. 11.4b). With deeper levels of dexmedetomidine sedation, increased power is noted in the slow-delta bandwidths (Fig. 11.4c), and slow-delta oscillations are noted on the corresponding raw EEG (Fig. 11.4d). This presents a similar pattern to that observed with propofol and ether-based volatile agents but without the alpha oscillation (see Fig. 11.3).


Fig. 11.4
EEG characteristics with light dexmedetomidine sedation . (a) Increased power is noted as a red streak in the low-beta range (~13 Hz) under light sedation, likely corresponding to spindle activity. (b) Coherent spindle activity is noted during light sedation on the raw EEG, similar to spindle activity appreciated during NREM sleep. (c) With increasing doses of dexmedetomidine, increased power is noted in the slow-delta bandwidths. (d) Slow-delta oscillations are appreciated on the corresponding raw EEG tracing with higher doses of dexmedetomidine (Reproduced from Purdon et al. [56]; with permission)
Though these EEG patterns reflect neurophysiologic differences among anesthetic classes, they do not necessarily provide insights into the mechanisms behind anesthetic-induced loss of consciousness. For example, propofol-mediated loss of consciousness has been linked with alpha rhythm anteriorization, which may be mediated by γ-aminobutyric acid (GABA) potentiation [12]. This alpha rhythm anteriorization does not appear in the very young or very old [15, 16], and it has not been consistently demonstrated with sevoflurane- and ketamine-induced loss of consciousness, which involve agents that have known molecular targets other than GABA receptors [17–19]. Despite these molecular and neurophysiologic differences, all three drug classes have the ability to consistently induce loss of consciousness. An emerging explanation for this common functional outcome may be the shared ability of these anesthetics to inhibit communication between anterior and posterior brain regions [17–19]. Specifically, loss of consciousness with propofol, sevoflurane, and ketamine is correlated with reduced EEG measures of frontal-to-parietal directed connectivity [17–19], which is believed to be a surrogate of information transfer involved in conscious experience [20].
Processed EEG
The Bispectral Index (BIS ) and SEDLine monitors are two of the most commonly used portable EEG systems for intraoperative EEG monitoring, although many systems are available (Table 11.1). Each system has a set of corresponding electrode channels—or montages—that are applied to the forehead of patients for EEG data acquisition. Both raw and processed EEG data are captured and displayed. In this context, processed EEG refers to the acquisition, integration, analysis, and conversion of raw EEG data—by a proprietary multivariable algorithm—to a dimensionless number meant to reflect anesthetic depth (Table 11.2). With the BIS system, for example, values ranging from 40 to 60 reflect depth consistent with general anesthesia [21], and values ranging from 25 to 50 reflect this same depth with the SEDLine monitor [22]. Processed EEG values have specific limitations, however, which will be discussed further in the next section.
Table 11.1
Commercially available processed EEG systemsa
Monitor | Data and display features | Index target rangeb |
|---|---|---|
Bispectral Index (BIS) | Raw EEG, processed values | 40–60 |
– BIS index | ||
– Spectral analysis | ||
SEDLine | Raw EEG, processed values | 25–50 |
– Patient State Index (PSI) | ||
– Spectral analysis | ||
Narcotrend | Raw EEG, processed values | D, E |
– EEG stage (A-F) | 40–60 | |
– Narcotrend Index | ||
– Spectral analysis | ||
Entropy module | State entropy (EEG-based) | 40–60 |
Response entropy (EMG-based) | ||
IoC-View | Raw EEG, processed values | 40–60 |
– IoC Index | ||
– EEG suppression ratio | ||
SNAP II | High-frequency (80–240 Hz) and low-frequency (0–18 Hz) EEG analysis, processed SNAP Index | 50–65 |
NeuroSENSE | Raw EEG, processed values | 40–60 |
– Wavelet-based (WAVCNS) index | ||
– Spectral analysis |
Table 11.2
Processed EEG steps
Signal sampling |
Bandpass filtering |
Artifact detection |
Suppression ratio calculation |
Fourier analysis (γ, β, α, θ, δ bandwidths) |
Total power calculation |
→Coherence and power analysis |
→Multivariate analysis |
Index value calculated |
Clinical Utility of Raw and Processed EEG
Processed EEG has largely been studied with the aim of preventing AWR . Comparative trials have not demonstrated a reduced risk of AWR with processed EEG monitoring compared to end-tidal anesthetic concentration (ETAC ) monitoring protocols [23, 24], but processed EEG monitoring does reduce the incidence of AWR compared to routine care and monitoring [24, 25]. Furthermore, this may be particularly helpful during total intravenous anesthesia (TIVA ), where ETAC monitoring is not available, and the risk of awareness may be increased [26]. There are several reasons why processed EEG might not be effective in reducing AWR beyond simple ETAC monitoring . For example, anesthetists in these studies used the processed EEG value, rather than raw EEG data interpretation, to gauge anesthetic depth . As such, assessment of anesthetic depth came from a processed algorithm, rather than from direct neurophysiologic assessment. This approach may be problematic, as index values do not take into account the different neurophysiologic properties of various anesthetics. For example, ketamine and nitrous oxide lead to an increased EEG oscillation frequency [27, 28], which may in turn render a higher processed EEG value. Additionally, precise neural correlates of consciousness remain under active investigation. Although certain EEG-based markers such as frontal-parietal disconnection [19, 29] and disruption of thalamocortical connectivity [12, 30] provide insights into causally sufficient mechanisms to induce unconsciousness, the neuroscientific framework that defines consciousness remains incompletely understood. Thus, attempts to distill a patient’s level of consciousness to a single number are not yet rooted in complete scientific understanding. A deeper neurophysiologic understanding of consciousness and anesthetic action is likely to be helpful in determining levels of consciousness.
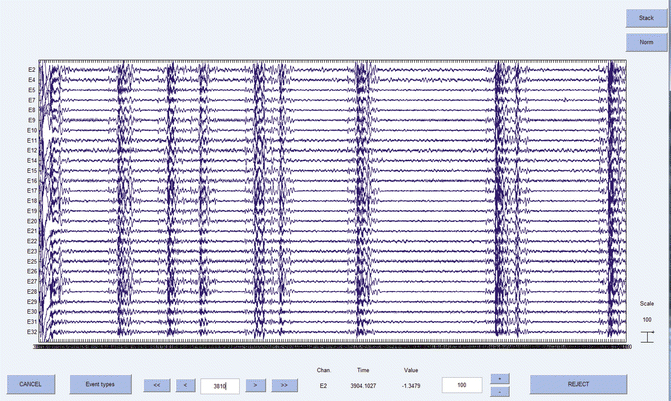
Though intraoperative EEG monitoring has been long examined for the prevention of AWR , EEG may also be useful for appropriately titrating anesthetic depth. For example, EEG allows practitioners to detect burst suppression, a pattern of electrical bursts interspersed with electrical silence (Fig. 11.5). This pattern represents a profound depth of general anesthesia that is not observed during sleep. Longer periods of intraoperative and postoperative burst suppression have correlated with postoperative delirium [31, 32], and a recent meta-analysis of prospective trials has demonstrated a reduced risk of postoperative delirium with BIS-guided protocols [33]. Alternatively, titrating anesthetic depth to achieve burst suppression can be useful in certain circumstances, such as cerebral aneurysm clipping , where burst suppression may reduce the risk of ischemic injury by reducing cerebral metabolism [34]. Thus, EEG-titrated anesthetic depth may be useful in certain clinical scenarios, which would be valuable to anesthesiologists for improving perioperative neurologic outcomes .


Fig. 11.5
Burst suppression illustrated with continuous EEG data
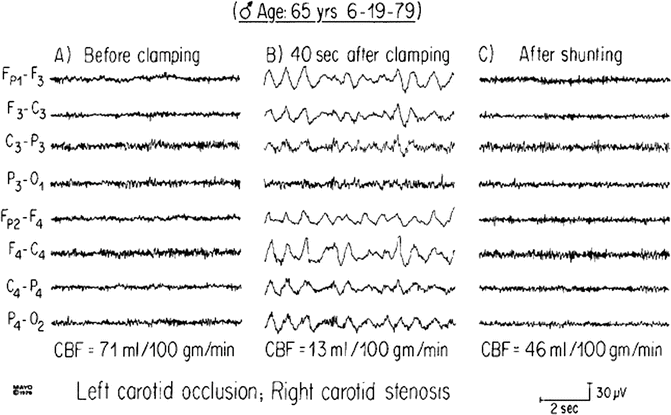
Lastly, both raw continuous (cEEG ) and quantitative EEG (qEEG ) findings may be useful for the detection of cerebral ischemia in high-risk settings. Cortical voltage oscillations begin to decrease in frequency once cerebral blood flow (CBF) decreases below specific ischemic thresholds [35, 36]. This slowing results from ischemic damage to neurons, which have high oxygen and glucose requirements to maintain electrochemical gradients across cellular membranes [37]. Frequency slowing is manifested by specific EEG patterns. Intraoperatively, for example, asymmetric oscillatory slowing has been demonstrated during carotid endarterectomy (CEA), marked particularly by irregular delta waveforms [35, 38] (Fig. 11.6). Also during CEA, spectral edge frequencies and relative delta band power are qEEG markers that have helped objectively identify ischemia during carotid clamping [39]. Postoperatively, both cEEG and qEEG have been shown to successfully predict cerebral ischemia in certain pathologic settings. For example, certain features of cEEG and qEEG predict cerebral ischemia from vasospasm after subarachnoid hemorrhage. For cEEG, pathologic delta patterns [40] and regional attenuation of faster frequencies—especially without delta waves present—can help acutely diagnose cerebral ischemia [41]. Reduced total power [42] and decreased relative alpha frequency variability [43] are qEEG markers that have demonstrated utility predicting cerebral ischemia due to vasospasm. These quantitative markers of the EEG may be particularly useful, as they are easier to interpret and do not require continuous EEG surveillance and expertise to interpret the data.


Fig. 11.6
Frequency slowing noted after clamping of the right carotid artery during endarterectomy. Irregular, delta-wave activity is appreciated with attenuation of faster frequencies. Changes are more pronounced on the right, which is the side of clamping. EEG waveforms return to baseline after shunt is placed. Reproduced with permission from Dr. Don Schomer and Dr. Fernando Lopes da Silva, Niedermeyer’s Electroencephalography: Basic Principles, Clinical Applications, and Related Fields, Fifth Edition [57]
Future Directions of EEG Monitoring
Although significant progress has been made since the first suggestion in 1937 that EEG may be used as an intraoperative monitoring modality [44], the current approach to assessing anesthetic depth is still fairly rudimentary. First, it is important to note that the most commonly used metrics of anesthetic depth —hemodynamics and MAC—are flawed. In the case of hemodynamics, there is no consistent relationship between hypertension and insufficient anesthetic depth or, perhaps more importantly, hypotension and supratherapeutic anesthetic depth. There are numerous determinants of blood pressure and heart rate (e.g., hypovolemia) that are independent of anesthetic dosing or neural activity. In support of this, numerous cases of intraoperative awareness have been identified in the absence of frank hemodynamic changes [45]. In the case of MAC , we have known since the 1990s that the functional endpoint of MAC—movement—is suppressed primarily through anesthetic effects on the spinal cord [46–48]. Thus, MAC is not intrinsically linked to the anesthetic effects on the brain.
In order to advance the field, we need a more sophisticated knowledge of either anesthetic mechanisms in the brain or the neurobiology of consciousness (or both). Current approaches to the EEG are attempting to focus on these two domains of knowledge. Currently available processed EEG monitors display indices that were, primarily, empirically derived through a comparison of the awake EEG and the anesthetized, without necessarily considering whether the differences between the two were related to anesthetic mechanisms or the neural substrate of consciousness. Currently, there are more principled approaches to the EEG. One focuses on linking the systems neuroscience effects of anesthetics to network-level oscillations , searching for drug-specific signatures on the EEG [15]. For example, in healthy adults anesthetized with propofol, a strong alpha oscillation can be seen in the frontal spectrogram, which has been hypothesized to result from a GABAergic effect in the nucleus reticularis of the thalamus that sets up a highly coherent thalamocortical oscillation [49]. Ketamine, on the other hand, does not have strong GABAergic properties and does not result in increased alpha. Rather, slow oscillations and high-frequency gamma activity are observed [19], the latter possibly due to the NMDA antagonist effects on GABAergic interneurons. These entrained oscillations can restrict the normally flexible repertoire of connectivity and communication across the cortex. The other principled approach to the EEG and intraoperative monitoring focuses on the neural correlates of consciousness in the normal state of wakefulness and how these correlate change with anesthetic exposure. It is generally believed that the integration of neural information is a prerequisite for conscious experience [50]; if interrupted, disrupted, or eliminated, conscious processing would not occur. There are various surrogates for connectivity and communication that can be assessed with EEG. Techniques to assess functional connectivity (statistical interdependence between two brain areas) include coherence and phase synchronization [51]. Techniques to assess directed connectivity (a statistical interdependence that unfolds over time) include transfer entropy and Granger causality [52]. Techniques to assess effective connectivity (the identification of a causal influence of one brain region on another) include dynamic causal modeling [53]. All of these techniques have been examined during general anesthesia. Although a complicated literature, it has been generally found that long-range functional connections and surrogates of communication are broken down during general anesthesia, which presumably reflects the interrupted information synthesis that leads to the breakdown of consciousness. This has been found consistently across all major classes of anesthetics [19]. Thus, while the attempt to link underlying anesthetic mechanisms to EEG features seeks to identify drug-specific signatures, the approach to understanding the neural correlates of consciousness seeks to identify state-specific signatures that are invariant with respect to drug type. The latter approach has many stages of development before real-time monitoring can be attempted. However, there is the promise of a drug-invariant approach that might accurately identify the breakdown or return of consciousness in the operating room and perhaps even disruptions of consciousness in the postoperative period (such as delirium). Furthermore, we must recognize that all of these techniques aim to monitor the sedative-hypnotic effects of general anesthetics. The potent and clinically important amnesic effects are mediated by structures in the medial temporal lobe and may be less amenable to monitoring.
Stay updated, free articles. Join our Telegram channel

Full access? Get Clinical Tree


