Fig. 30.1
This MRI angiogram is from a patient with left carotid artery stenosis just above the level of the carotid artery bifurcation (arrowhead)
The neurologist discussed the two possible treatment options of CEA, and carotid artery angioplasty/stenting with the patient. The patient elected to have CEA due to the decreased risk of periprocedural stroke.
Preoperative: Anesthetic and Neuromonitoring Considerations
Specific Goals in the Anesthetic Management of a Carotid Endarterectomy
Patients presenting for CEA typically have diffuse vascular disease, involving the heart and peripheral vascular circulation [18]. Because of significant stenosis of one or more major vessels supplying blood flow to the brain, maintaining normal arterial blood pressure, and avoiding hypotension are particularly critical to ensure adequate blood flow to the brain. These patients have more recently had blood pressures of 200/120 rather than 120/60. Therefore, a higher blood pressure is much more clinically typical of the patient’s baseline physiology than a low one. Although avoidance of hypotension is a fundamental anesthetic goal during general surgery, the maintenance of adequate cerebral perfusion despite anesthetic pharmacological effects and surgical manipulation is especially critical during CEA. The rule of “high is good, low is bad” becomes particularly applicable for these patients having CEA.
Different Possible Monitoring Techniques to Assess Cerebral Blood Flow
There are four methods to monitor the brain for adequate cerebral perfusion : two are functional and two relate to cerebral blood flow. The two functional methods are (1) clinical intraoperative examination of an awake patient (see Chap. 18, “Anesthesia for Awake Neurosurgery”); (2) electrophysiological examination by evoked potential monitoring (see Chap. 1, “Somatosensory Evoked Potentials”) or monitoring of spontaneous electrical activity from the cortex (see Chap. 10, “EEG Monitoring”). Monitoring spontaneous electric activity by electroencephalography (EEG) monitors activity that arises from the cortex (see Chap. 19, “General Anesthesia for Monitoring”). Evoked potential monitoring such as somatosensory evoked potentials (SSEP ) evaluates both subcortical and cortical regions. Motor evoked potential monitoring (MEPs) can also monitor for blood flow to subcortical areas of the motor tract. The two blood flow-related methods are (1) cortical cerebral blood flow measurements, and (2) oxygen saturation of the cortex. Cortical cerebral blood flow measurements can be determined directly with techniques utilizing xenon, but this technique has the associated technical difficulty of environmental removal. More commonly, a surrogate measure of cerebral blood flow is used such as transcranial Doppler (TCD) ultrasonography, which evaluates cerebral blood flow velocity in major cerebral arteries that are subcortical (see Chap. 13, “Transcranial Doppler”). Oxygen saturation of the cortex is based on the adequacy of cerebral blood flow and uses near-infrared spectroscopy (NIRS) to measure oxygen saturation of the cortex (see Chap. 12, “Near-Infrared Spectroscopy”).
The clinical intraoperative examination requires that the patient be fully awake in order to perform an accurate examination of mental status including language, as well as motor and sensory functions. The other techniques can be performed with patients under general anesthesia. Commonly, awake patients require the surgical area to be anesthetized using a regional technique with either a superficial or deep cervical block. The patient has to understand and agree with the expectation that they will be awake during their surgery, subject to the sounds of the operating rooms, and be able to participate upon request with neurological testing. In addition, the possibility of sudden airway compromise must be considered. A major advantage to awake neurological testing is the lack of needed equipment and expertise in using it to perform testing.
Although at our institution, EEG and TCD monitoring is considered the standard, at other institutions, SSEP and MEP monitoring are performed. Changes in median nerve SSEPs during carotid clamping is a sensitive marker of ischemia of the middle cerebral artery (MCA) territory. A limitation of this monitoring technique is false-negative SSEP results, reported in up to 3.5 % of patients [19]. However, to identify ischemia of the anterior cerebral artery and subcortical territories, tibial nerve SSEPs and MEPs should be used and decreases this false-negative rate [20]. It may be possible that triple monitoring (monitoring EEG, SSEP, and MEP) could improve sensitivity and specificity in finding ischemia during carotid clamping; however, studies addressing this question are limited and there is no evidence in the literature to support doing so as of yet [21, 22]. NIRS is also an assessment of cerebral flood flow by measuring oxygen saturation of the cortex. Although this measurement correlated with changes on EEG and awake testing, the positive predictive value of this modality of measurement is low [23, 24].
Agents used for achieving general anesthesia affect the various monitoring techniques differently. For example, SSEPs are significantly reduced when nitrous oxide is administered, whereas spontaneous electrophysiological activity from the cortex measured with EEG is enhanced with nitrous oxide due to its sympathomimetic properties [25].
Intraoperative Course
In the operating room, routine monitors were placed in addition to a preinduction left radial arterial line. The time during general anesthesia when intraoperative hypotension most commonly occurs is with and immediately after induction; therefore, a preinduction arterial line allows for rapid blood pressure monitoring and control during this interval. Two neuromonitors were placed: a transcranial Doppler ultrasound was placed on the left temporal area insonating on the left MCA (Fig. 30.1), and an EEG cap (Electro-cap International Inc., Eaton, OH) was applied with 16 electrodes placed according to the International 10–20 electrode placement system (Fig. 30.2). The EEG montage was a bipolar “double-banana” montage (Fig. 30.3).
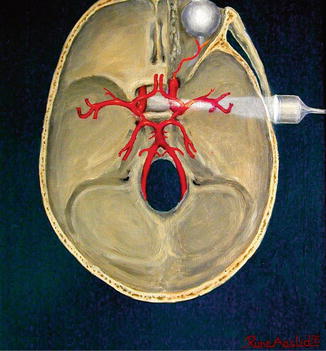
Fig. 30.2
Electroencephalography . Top panel depicts the International 10–20 System from (a) left and (b) above the head. This is a standard way of placing and naming electrode positions based on landmarks and distances between them on the patient’s head: the anterior to posterior distance is from nasion to inion, and the lateral distances from preaurical point on the left to preaurical point on the right. The “10–20” refers to percentages of these distances where electrodes are placed. All even-numbered electrodes are on the right and odd-numbered electrodes are on the left. “F”, “C”, “T”, “P”, “O”, and “A” are frontal, central, temporal, parietal, occipital, and ear lobe, respectively. The subscripts refer to FP, and “Z” is midline. The “double banana” montage is a bipolar montage where two strings of electrodes are arranged anterior to posterior parallel to the midline and parallel to the circumference. Viewed from above, the electrodes form a shape that looks like two bananas. Bottom panel depicts Montage: Bipolar and Referential. All electrical potentials are potential differences. These differences are generated from differential amplifiers by comparing pairs of neighboring electrodes called a bipolar montage, shown on the left, or by comparing pairs of electrodes all referred to the same reference electrode, called a referential configuration, shown on the right. This figure was made available at http://www.bem.fi/book/13/13.htm#03 under the terms of GNU Free Documentation License, Version 1.3
Fig. 30.3
Transcranial Doppler ultrasonography . This figure is a horizontal view of the head with the TCD probe on the left temporal area insonating on the ipsilateral middle and anterior cerebral arteries. It demonstrates where our TCD was placed on the patient to obtain the tracings shown below. This figure was made available at http://en.wikipedia.org/wiki/File:Transcranial_doppler.jpg under the terms of GNU Free Documentation License, Version 1.3 by Rune Aaslid
The patient was sedated with fentanyl, 100 μg, and midazolam, 3 mg. He was pre-curarized with rocuronium, 10 mg, 3 min prior to induction. He was induced with etomidate, 20 mg, and succinylcholine, 140 mg. Intubation was with a Macintosh size 3 blade and the vocal cords were seen. A #8.0 endotracheal tube passed without difficulty. Anesthetic maintenance for the patient was with 0.7 % isoflurane and 50 % N2O. Since his blood pressure decreased after induction, a phenylephrine drip (40 μg/mL) was started at 30 mL/h to maintain his blood pressure at 150/90 mmHg. Five minutes before clamping the carotid artery, 6500 mg of heparin was administered (0.08 μg/kg) intravenously and the resultant activated clotting time (ACT ) was 254 s. The phenylephrine drip rate was increased to 60 mL/h and the arterial blood pressure increased to 185/100 mmHg during this pre-cross clamp interval.
Clamps were applied sequentially to the superior thyroid artery, the common carotid artery, internal carotid artery, and the external carotid artery.
Transcranial Doppler Ultrasonography
TCD was monitored throughout the procedure . In addition to temperature, blood pressure, and end-tidal carbon dioxide (PeCO2), TCD measurements (peak and mean MCA flow velocities), pulsatility index (PI), and delta %, which is the change in mean cerebral blood flow velocity compared to baseline, were obtained at specific times during surgery as part of our research protocol. These times are:
baseline (before induction)
pre-clamp (at heparin injection)
clamping, shunt insertion (if required)
post-clamping (15 min after clamping)
clamp release
5-min post-release
10-min post-release
At each event, the surgeons were informed of relevant TCD information.
To measure the MCA flow velocity, a 2-MHz Doppler probe was placed over the temporal bone ipsilateral to the operative side (left); the MCA at a depth of 50 mm was the main detected target. Prior to surgical draping, a headframe (Model 600, Spencer Technologies, Seattle, WA) was placed around the patient’s head to hold the Doppler probe transducer firmly in position throughout the procedure.
At baseline, the patient’s MCA velocity and PI were within normal range, varying from 57 to 63 cm/s (normal, 35–100 cm/s) and 0.90 to 1.05, respectively (Fig. 30.4a, Table 30.1). This broad velocity range can be explained by decreasing blood flow to the brain with age, the dependence of cerebral blood flow on the partial pressure of CO2 and the level of cerebral metabolism [17]. Right after clamping, MCA velocities quickly dropped by 64 % from the pre-clamp value, resulting in timed average mean velocity (TAMV) of 21 cm/s and PI of 0.5 (Fig. 30.4b, c). In comparison to TAMV, PI is usually more sensitive measurement for detecting changes in cerebrovascular resistance due to clamping. This significant decrease in MCA velocity demonstrated the patient’s poor collateral blood flow. No shunt was used despite the fact that there was more than 50 % decline in flow velocity from the baseline. Cerebral tolerance to carotid clamping was assessed by an equation by mean velocity MCA% (mv MCA%):
 Generally, a shunt is placed when mv MCA % is less than or equal to 15 % [13]. In this case, the calculated mv MCA% was 33 % and therefore a shunt was not placed.
Fig. 30.4
Transcranial Doppler ultrasound tracings . Patient 1: TCD tracings at four different time points relative to cross-clamping the carotid artery: (a) before, (b) immediately at, (c) during, and (d) after unclamping the carotid artery. Each tracing consists of two frames, “1” and “2”. “1” is the Power M-mode tracing (analogous to the ultrasound mode) on the “y-axis” in mm and visualizes flow from 30 to 80 mm from the surface of the scalp. “2” is the Doppler velocity in cm/s on the “y-axis” at a distance indicated by the yellow line in the Power M-mode. The “x-axis” is in seconds between the time markers. The boxed numbers to the left of each tracing show the depth in mm, power, and sample volume. The boxed numbers on the right of each tracing show the peak, mean, diastolic velocities, pulsatility index (PI), and the percentage change from baseline of the mean cerebral blood flow velocity. Patient 2: TCD tracings at four different time points relative to cross-clamping the carotid artery: (e) before, (f) immediately at, (g) after shunt insertion, and (h) after shunt removal and unclamping the carotid artery. Each tracing consists of two Fig. 30.4 (continued) frames, “1” and “2”. “1” is the Power M-mode tracing (analogous to the ultrasound mode) on the “y-axis” in mm and visualizes flow from 30 to 80 mm from the surface of the scalp. “2” is the Doppler velocity in cm/s on the “y-axis” at a distance indicated by the yellow line in the Power M-mode. The “x-axis” is in seconds between the time markers. The boxed numbers to the left of each tracing show the depth in mm, power, and sample volume. The boxed numbers on the right of each tracing show the peak, mean, diastolic velocities, and pulsatility index (PI)
Table 30.1
TCD monitoring data from patient 1, who did not have a shunt placeda
Peak velocity (cm/s) | Mean velocity (cm/s) | Pulsatility index | |
|---|---|---|---|
Baseline | 86 | 60 | 0.90 |
Clamp on | 28 | 21 | 0.50 |
Post-shunt | N/A | N/A | N/A |
Post-clamp | 33 | 25 | 0.54 |
Clamp off | 113 | 60 | 1.32 |
5 min post-release | 74 | 44 | 1.39 |
10 min post-release | 96 | 56 | 1.17 |
After release of the clamps, MCA velocities rapidly increased above pre-clamp value (TAMV, 60 cm/s; PI, 1.32) and then decreased toward the pre-clamp value (TAMV, 44 cm/s; PI, 1.39 at 5 min after clamp release; TAMV, 56 cm/s; PI, 1.17 at 15 min after the release) (Fig. 30.4d).
Case 2
We also present another patient, with an 80 % stenosis of the left internal carotid artery demonstrated by magnetic resonance angiography. Overall, the TCD monitoring during the procedure demonstrated a similar trend of changes in MCA velocity and PI to that seen with the first patient. In comparison to the first patient, his baseline peak and mean MCA velocities were lower (peak, 52 cm/s; mean, 34 cm/s) (Fig 30.4e, Table 30.2). After clamping, these velocities instantaneously and drastically went down to 19 and 30 cm/s, respectively (Fig 30.4f). Although mv MCA% calculated using the formula provided above indicated 35 % decrease (which is above the suggested cutoff number; 15 %), a shunt was still placed in order to add sufficient blood flow that had not been reached previously due to inadequate collateral flow. The problem was quickly fixed by shunt placement, and the velocities were raised closer to his baseline values (Fig. 30.4g). Once the clamps were released, MCA velocity increased above pre-clamp value (TAMV, 52 cm/s) and then dropped toward the baseline value (TAMV, 40 cm/s; PI, 1.01 at 5 min after clamp release; TAMV, 41 cm/s; PI, 0.98 at 15 min after clamp release) (Fig. 30.4h), similar to what we saw in the first patient.
Table 30.2
TCD data on patient 2, who underwent shuntinga
Peak velocity (cm/s) | Mean velocity (cm/s) | Pulsatility index | |
|---|---|---|---|
Baseline | 52 | 34 | 0.90 |
Clamp on | 19 | 12 | 0.52 |
Post-shunt | 42 | 30 | 0.72 |
Post-clamp | N/A | N/A | N/A |
Clamp off | 80 | 52 | 0.84 |
5 min post-release | 67 | 40 | 1.01 |
10 min post-release | 66 | 41 | 0.98 |
EEG Monitoring
EEG monitoring for a CEA can be performed with either needle electrodes placed subcutaneously on a patient’s scalp, or with surface EEG electrodes—either using an EEG cap with electrodes sown into a standard configuration that is then applied to the patient’s head like a swim-cap, or with surface electrodes placed on the scalp and held on with collodion adhesive. Needle electrodes have an advantage of having very low resistance, which improves the recording. The disadvantages of needle electrodes include pain upon insertion, which necessitates a post-induction placement, needle-stick safety hazard, and minor bleeding at the insertion sites. Likewise, the major advantage of the EEG cap is a comfortable application, which can be done pre-induction. The major disadvantage is the potential of having high resistance due to the fact that the electrodes sit on top of the scalp and are connected to the scalp EEG via conductive gel (Electro-Gel, Electro-Cap International, Inc., Eaton, Ohio). Another disadvantage is getting the collodion out of the patient’s hair after surgery.
Related posts:
 Deep Brain Stimulation
 Intraoperative Neurophysiologic Monitoring During Surgery for Supratentorial Mass Lesions
 Surgery for Chiari Type I Malformation
 Intraoperative Neurophysiological Monitoring for Intracranial Aneurysm Surgery
 Intraoperative Monitoring in Tethered Cord Surgery
 IOM Instrumentation Layout and Electrical Interference
Stay updated, free articles. Join our Telegram channel

Full access? Get Clinical Tree


