Fig. 17.1
Layers of the heart (Reprinted under Creative Commons Attribution 3.0 Unported from Blausen.com staff (2014). “Medical gallery of Blausen Medical 2014”. WikiJournal of Medicine 1 (2). https://doi.org/10.15347/wjm/2014.010. ISSN 2002-4436)
Similar to constructing a house, a backbone or scaffolding is required in the heart to attach components and provide a weight bearing infrastructure. This function is provided by the “skeleton” of the heart.
The “skeleton” is formed by flexible cartilaginous and dense connective tissue. This “backbone” typically consists of annuli of the cardiac valves, the trigones, the roots of the great vessels, and the central fibrous body. It forms an anchor for the valves and cardiac muscle bundles, allowing development of high intracavitary pressures without compromising the heart’s structural integrity. Importantly it electrically insulates the atria from the ventricles, allowing electrical impulses between both the structures to flow through the AV node only.
While the atria consist of two thin bands of myocardium, the ventricles contain deep and superficial spiral muscles. The organization of muscle bundles allow the ventricles to “twist and squeeze” as opposed to just squeezing, thereby enhancing their force. For example, if you take a wet piece of cloth, you can express more water out when you wring it as compared to just squeezing it. In congestive heart failure (CHF), this ability to “wring” is diminished, leading to a decrease in contractility. During diastole, unwinding of the twisted ventricle contributes to pulling in blood from the atrial chambers and is known as diastolic suction.
Functionally, the heart has two parts connected in series: (1) a right heart, which receives and pumps out deoxygenated blood, and (2) a left heart, which receives and pumps oxygenated blood. Although both the LV and RV are efficient pumps, they differ in their organization, shape, and muscle content. The ellipsoid LV displays temporally uniform contraction and is thicker. The thinner RV is crescent shaped, has embryologically distinct inflow and outflow tracts, and contracts in a peristaltic manner. The IVS couples RV and LV function and allows the RV to contract against it to generate force. The thinner RV, being compliant, adjusts easily to volume overload by dilating, but tends to fail when presented with an acute increase in afterload or pulmonary vascular resistance (PVR). For example, in response to a pulmonary embolus, the RV dilates and its function decreases. Its apex tends to function better than its walls. This can be seen on echocardiography and is called the McConnell’s sign. The thicker LV, on the other hand, can withstand acute and chronic afterload increases better compared to the RV.
The heart utilizes electrical input and converts it into a mechanical output. The electrical part of the heart is represented by a specialized conduction system that is responsible for generating the “spark” for a heartbeat. It also ensures that this spark travels to all parts of the heart in a timely and orderly fashion. On a cellular level, the conduction system is made up of excitatory and conductive cardiac muscle cells or cardiomyocytes. Anatomically it is made up of sinoatrial node (SA), interatrial nodal pathways, atrioventricular node (AV), the bundle of His, and the Purkinje system. Broadly, the mechanical system consists of contractile myocytes and connective tissue.
Like skeletal muscle, cardiac muscle contracts and relaxes. This contraction and relaxation is preceded by precise electrical events. The interplay between the electrical and mechanical events, leading to generation of a single heartbeat, constitutes the cardiac cycle (CC). It can be broadly divided into systole (contraction phase) and diastole (relaxation phase). Electrical systole precedes mechanical systole and leads to sequential contraction of atria and ventricles with ejection of blood into vessels. Similarly electrical diastole precedes mechanical diastole and leads to relaxation of atria and ventricles, allowing filling of relatively empty chambers [3, 4].
17.2.1 Electrical Components and Activity of the Heart
Different parts of the conduction system are capable of spontaneously discharging and generating action potentials. The part that discharges most frequently, however, determines the rate at which the heart beats and is termed the cardiac pacemaker. The atrial conduction system consists of the:
- 1.
SA node: Located at the junction of the superior vena cava (SVC) and RA. Normally, it acts as the cardiac pacemaker. It develops from the right side of the embryo and is predominantly innervated by the right vagus nerve. Sympathetic innervation comes from the stellate ganglion.
- 2.
Internodal atrial fibers: These are arranged in three tracts: (1) anterior, which gives rise to the Bachmann bundle; (2) middle, or tract of Wenckebach; and (3) posterior, or tract of Thorel. These transmit impulses from SA node to AV node in about 30 milliseconds (ms). The Bachmann bundle is responsible for left atrial depolarization. Conduction via atrial fibers is fast, leading to atrial depolarization in about 100 ms.
- 3.
AV node: Located in the right posterior portion of the interatrial septum. It develops from the left side of the embryo and is predominantly innervated by the left vagus. Sympathetic innervation comes from the stellate ganglion. Conduction is slow in the AV node and this leads to an AV nodal delay of about 100 ms before ventricular excitation takes place. This delay is lengthened by stimulation of the vagus nerve and shortened by stimulation of sympathetic nerves.
The ventricular conduction system consists of the bundle of His (BOH) and Purkinje system (◘ Fig. 17.2). The impulses after traversing the AV node travel to the BOH, which divides into a left bundle branch (LBB) and a right bundle branch (RBB) at the top of the interventricular septum. Anatomically, the AV node and BOH reside in the triangle of Koch, which is bordered by the coronary sinus, tendon of Todaro, and the TV septal leaflet. The LBB further divides into anterior and posterior fascicles, which extend to the base of the left papillary muscles. Fibers from the LBB and RBB then merge with the Purkinje system supplying all of the ventricular myocardium and this enables depolarization of ventricles in about 100 ms. Depolarization in the ventricles typically commences at the left side of the IVS, then moves across to the right side, followed by spread down the septum to the apex and culminates by returning along the ventricular walls to the AV groove.
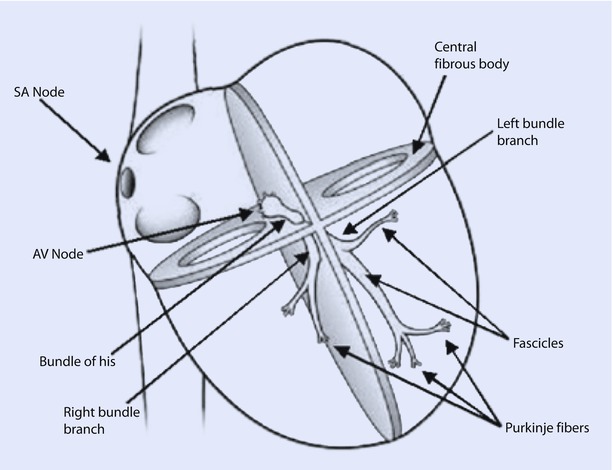
Fig. 17.2
The conduction system of the heart. Normal excitation originates in the sinoatrial node then propagates through bothatria. The atrial depolarization spreads to the atrioventricular node and passes through the bundle of His to the bundle branches/Purkinje fibers. AV atrioventricular, SA sinoatrial (Reprinted with permission from Iaizzo [5])
The discharging cells that act as dominant pacemakers determine two things: the heart rate and the heart rhythm. The rate is usually determined by the rate of discharge while the rhythm is determined by which group of cells is acting as the dominant pacemaker. The SA node discharges at about 60–100 times/min in adults. As this is higher than what other cells discharge at, the SA node acts as the dominant pacemaker. This phenomenon is called cardiac overdrive suppression, wherein other cells fail to discharge in the presence of a more rapidly discharging focus. Tonic vagal discharge influences the SA node leading to a resting heart rate of about 75 beats/min. Fluctuations in parasympathetic output during respiration, especially deep breathing, lead to acceleration of heart rate during inspiration and deceleration during exhalation. This sinus arrhythmia is a normal phenomenon. If for some reason the SA node stops discharging, other cells in the conduction system, such as AV nodal cells and cells of the His Purkinje system, can take over the pacemaker function. However, these cells discharge at lower rates of 30–50 beats/min. AV nodal rhythm is generated by AV nodal cells, and ventricular escape rhythms are generated by the His Purkinje system. Myocardial cells can also act as pacemakers, but they discharge sporadically and usually lead to ectopic or extra beats. This mechanism allows the heart to have multiple fallback options in case the SA node fails due to disease or degeneration [1, 2, 5].
17.2.2 The Cardiac Action Potential in Ventricular Muscle and Pacemaker Tissue
Ventricular myocardial cells and pacemaker cells have somewhat different electrical properties. Although both generate action potentials, the former group of cells produces a fast response action potential while the latter group demonstrates a slow response action potential. Myocardial cells have a resting membrane potential (RMP) of about −90 millivolts (mv), which is determined mainly by ion fluxes across the plasma membrane. Although K+ equilibrium potential predominantly determines the RMP, other ions such as Na+, Ca 2+, and Cl- play an important role in generation of the action potential. Cells are mechanically connected via intercalated discs and electrically connected through gap junctions. This allows them to act as a syncytium and ensures rapid spread of electrical impulses. Fast response action potentials have 5 phases that are generated as follows:
- 1.
Phase 0: Rapid depolarization due to Na + influx. Once the RMP is shifted to −60 to −70 mv (critical threshold), there is a rapid influx of Na + leading to a rapid upstroke.
- 2.
Phase 1: This is followed by rapid repolarization due to a transient outward K+ current, ito.
- 3.
Phase 2: The plateau phase occurs because of inward influx of Ca 2+ through L type channels and efflux of K+ via different channels: inward rectifier ik, delayed rectifier ik1 and ito.
- 4.
Phase 3: Slow repolarization phase is characterized by predominance of K+ efflux
- 5.
Phase 4: Return to RMP or −90 mV occurs in this phase. Ionic flow is minimal.
In contrast to the fast response action potential, the slow response action potential of pacemaker cells is characterized by a less steep Phase 0, absent Phase 1, shortening and merging of Phase 2 and 3 with repolarization occurring to firing levels (approximately −40 mV), and a Phase 4 that is characterized by spontaneous diastolic depolarization (◘ Fig. 17.3). Phase 4 in the SA node occurs predominantly due to a mixed cation current (Na + and K+). Because of its unusual activation following hyperpolarization, this channel has been termed the “funny” channel and the current If as the funny current. The membrane starts depolarizing because of the funny current, leading to activation of transient (T) and long (L) Ca 2+ channels, which generates a Ca 2+ influx leading to Phase 1. At the peak of the impulse, K + efflux ensues bringing about phase 3 or repolarization. When the membrane potential reaches firing levels, funny current kicks in and causes spontaneous diastolic depolarization during Phase 4, thereby ensuring automatic firing of pacemaker cells.
Fig. 17.3
Typical cardiac action potentials (slow on top and fast below). The resting membrane potential, threshold potential, and the phases of depolarization (0–4) are shown (Reprinted with permission from Iaizzo [5])
Action potentials generated at one region, tend to depolarize neighboring regions and as myocytes are electrically continuous; this leads to rapid spread of depolarization as an electrical signal through the heart [3, 4].
Now that we know how the heart generates and spreads an “electric” spark, let us see how this spark is translated into a contraction.
17.2.3 Contractile Cardiomyocytes and Excitation-Contraction Coupling
Unlike the excitatory and conducting cardiomyocytes, which function as electric generators, the primary role of contractile cardiomyocytes is to function as force generators. Both these cells are supported by extracellular connective tissue, which predominantly contains collagen, elastin, proteoglycans, and metalloproteinases. A group of cardiomyocytes supported by this distinct extracellular matrix network constitutes a myofiber.
Cardiomyocytes typically have an outer plasma membrane, called sarcolemma, that becomes highly specialized at the junction of adjoining cells to form intercalated discs (◘ Fig. 17.4). These bind adjacent cells in series and parallel, thereby creating a syncytium of cells. This enables mechanical coupling between cells and effective transmission of the force generated by the heart. Recall that electrical coupling between cells is provided by Gap junctions. The sarcolemma also invaginates into the cell to form an extensive tubular network called transverse tubules or T tubules.
Fig. 17.4
A cross-section of cardiac tissue showing two cells separated by a blood vessel containing red blood cells. The repeating sarcomeric structure of the myofibrils and the names of the sarcomeric landmarks are highlighted on the left of the figure. On the right of the figure the legend points out the membrane specializations of the cell. These include the intercalated disks, gap junctions, the transverse tubules that punctuate the sarcolemma (plasma membrane), and the sarcoplasmic reticulum. Also shown are mitochondria compacted into a limited space because of the abundance of the myofibrils (Reprinted with permission from Iaizzo [5])
Most of the contractile cardiomyocyte’s cell volume is made of myofibrils. The rest is made up of cytosol, mitochondria, nucleus, and sarcoplasmic reticulum (SR). Unlike skeletal muscle cells, cardiomyocytes have a high density of mitochondria and strategic positioning of SR in the vicinity of T tubules.
Myofibrils consist mainly of two types of contractile proteins: thin filament actin and thick filament myosin. These are arranged in a specific pattern to generate the basic unit of contraction: the sarcomere. The arrangement of sarcomeres in turn gives cardiac muscle a distinct striated appearance when examined under the electron microscope. This is due to differences in refractive properties of the elements. These striations are identified by letters and represent either specific lines or bands of refraction. Z lines (from the German word zuckung or twitch line), are dark lines present at regular intervals along the myofibril. For the sake of understanding, let us imagine the sarcomere to be a square, with two lateral pillars, a roof, and a base (◘ Fig. 17.5).
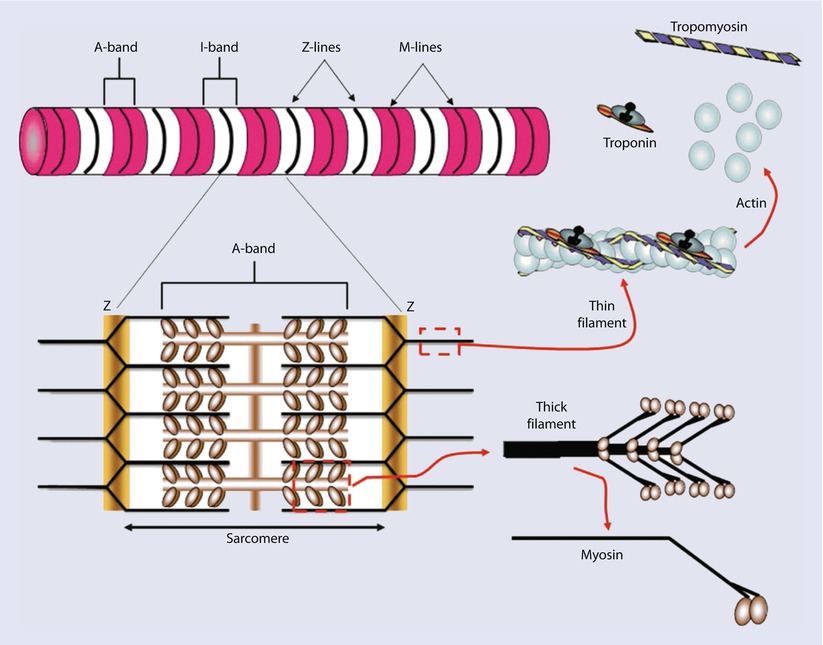
Fig. 17.5
yofibrils are constructed of repeating sarcomeres within cardiac muscle cells. Each sarcomere is defined as the structures bounded on each end by Z-disks (Z-lines). Thin filaments of the protein actin are attached to the Z-line and reach toward the center of each sarcomere. Two regulatory proteins are found on the double-stranded actin thin filaments—tropomyosin and troponin. Tropomyosin is a doublestranded a-helical protein dimer that binds across 7 actin monomers on the thin filament obscuring a binding site for myosin. Troponin is a 3-subunit globular protein that binds 1 per tropomyosin. Thick filaments of the protein myosin are found in the center of the sarcomere. The area that contains the thick filaments is also known as the A-band. The myosin molecules are asymmetrically shaped with a coiled-coil “tail” and two globular “head” domains. The head domains bind to actin to form crossbridges between the filaments and generate contractile force (Reprinted with permission from Iaizzo [5])
The “pillars” then represent the Z lines. Now imagine a line running through the center of this square. This is the M line, which anchors the myosin filaments. Actin filaments anchor onto Z lines via actinin and extend toward the M line, interdigitating with the myosin filaments. The region occupied by myosin filaments (with and without overlapping actin) is termed the A band (appears dark). The region occupied by actin filaments without any overlap with myosin, is called the I band (appears light). Z lines are connected to the sarcolemma via desmin. Scaffolding for the sarcomere is provided by the largest known protein, titin. Thus each sarcomere consists of two half I bands and 1 A band between 2 Z lines. Sliding of the thin filaments over the thick filaments generates contraction. Actual lengths of the filaments do not change; shortening is brought about by increasing overlap between the thin and thick filaments. This is represented by lengthening of A band and shortening of I band during contraction. The sarcomeres are arranged in series along the length of the cylindrical myofibril and adjacent sarcomeres are joined at the Z lines.
At rest, actin is covered by the troponin- tropomyosin complex. These are regulatory proteins that prevent myosin from binding to actin in the resting state. Troponin has three subunits: troponin C, which binds Ca 2+; troponin I, which inhibits muscle contraction; and troponin T, which binds the troponin complex to tropomyosin. The myosin protein has two heads attached to a long tail via a hinge. It rests in an extended position and is bound to a molecule of ATP.
The T tubule network is responsible for transmitting the electrical current or action potential to the myofibrils. The dihydropyridine receptors (DHPR) in the T tubules are activated by the action potential and being voltage gated L-type Ca 2+ channels cause an influx of Ca 2+ into the cell. This triggers the ryanodine receptors (RyR) in the SR, leading to Ca 2+ release from the SR and amplification of Ca 2+ concentration in the cytosol. This phenomenon is called calcium-induced calcium release.
The released Ca 2+ then binds troponin C, causing the troponin I-tropomyosin curtain to move and uncover the binding site on actin, thereby making it “available.” The myosin head can now interact with the “available” actin, leading to formation of a cross bridge. Cross bridge cycling in turn leads to an actual contraction. ATP bound to the myosin head gets hydrolyzed to ADP and energizes the myosin head. A conformational change occurs with release of ADP that causes the thin actin filament to move in relation to the thick myosin filament increasing their overlap, and producing a “power stroke.” The myosin head goes from a resting “extended” to an active “flexed” position, moving the actin molecule along. ATP binds to the free site on myosin, interrupting the myosin actin interaction. Rapid hydrolysis of ATP to ADP via myosin ATPase enzyme, leads to “re-extension” of the myosin head and return to the original state. This myosin head is then ready for interaction with the next “available” actin. This can be visualized as follows: Lay your left arm supine on a table with palm facing the ceiling such that your elbow and wrist are in a straight line. Now make a fist and bend your elbow, making a 120° angle between your arm and forearm. Place the palm of right hand on top of your left fist. Your left fist represents a myosin head, your left elbow is the hinge, and your right palm is an actin molecule. Flex your left elbow to bring your right hand/palm toward your left shoulder. That represents the myosin head moving the actin molecule. Now disengage your left fist from your right palm. Let your right palm stay at the level of the left shoulder and bring your left fist back to its extended 120° position. Your left fist is ready to “cross bridge” with another palm (ask a friend to lend one). This is how myosin moves actin. Two ATPs are required: one to energize the myosin head and other to disengage from actin.
This process is repetitive and depends only on the availability of Ca 2+ and ATP. Many myosin heads cycle almost simultaneously to produce gross muscle contraction. The sarcoplasmic or endoplasmic reticulum Ca 2+ ATPase (SERCA) is an ATP-dependent pump that moves cytosolic Ca 2+ back into the SR. Along with the Na + − Ca 2+ exchanger, it is responsible for the decrease in cytosolic Ca 2+. Calmodulin is one of the primary sensors of cytosolic Ca 2+. Fall in calcium levels restores the inhibitory function of the troponin-tropomyosin complex, ceasing the interaction between actin and myosin. This in turn leads to relaxation. Thus, both contraction and relaxation are ATP-dependent processes. SERCA activity is inhibited by the protein phospholamban. Once Ca 2+ enters back into the SR, it is stored bound to calsequestrin and calreticulin. These proteins release Ca 2+ when the next wave of action potential arrives. This entire process is called excitation-contraction coupling (◘ Fig. 17.6) and is responsible for the heart’s ability to act as a tireless electromechanical pump.
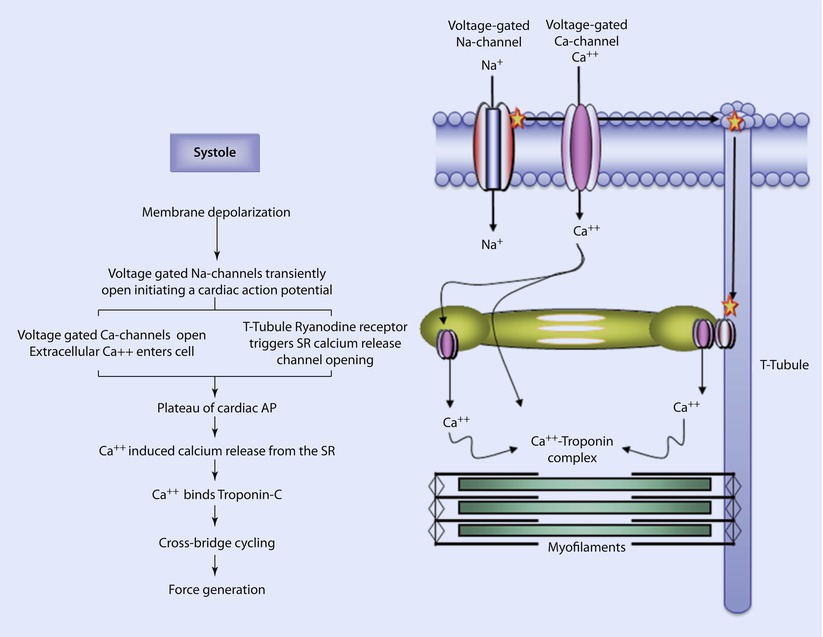
Fig. 17.6
Excitation-contraction coupling. In systole, an electrically depolarizing signal triggers the transient opening of voltage-gated Na-channels; the influx of positively charged Na ions further depolarizes the cell. This further depolarization causes the opening of L-type Ca-channels (long duration opening) and calcium enters the cell. This also causes ryanodine receptors in the T-tubules to trigger the release of calcium from Ca-channels in the sarcoplasmic reticulum. This initiates the plateau of the cardiac action potential. The rise in intracellular calcium concentration triggers additional calcium release from the sarcoplasmic reticulum via Ca-channels. The calcium binds to troponin on the thin filaments, inducing the movement of tropomyosin. Crossbridge cycling begins generating tension in the cardiac myocytes (Reprinted with permission from Iaizzo [5])
The cardiomyocyte also has cytoskeleton proteins: intermediate filaments, microtubules, and microfilaments. Intermediate filaments are important for mitochondrial function. Microtubules are important for cell transport mechanisms and microfilaments are important linking-anchoring proteins. Familial hypertrophic cardiomyopathy is a sarcomeric protein disease that arises from mutations in genes encoding myosin, actin, titin, tropomyosin, and troponins. Familial dilated cardiomyopathy, on the other hand, is a cytoskeleton protein disease arising from mutations in genes encoding actin, desmin, lamin, and sarcoglycan. [1–5]
17.3 The Electrocardiogram
Efficiency of contraction in the heart is achieved by precise timing of events during the cardiac cycle. The atria depolarize and repolarize before the ventricles. Thus at any given point of time, different parts of the heart are in different phases of depolarization and repolarization. These discrepancies are responsible for generating a fluctuating potential difference. Given that the heart is enclosed by conducting fluid, much like a battery suspended in saltwater, it generates an electrical field around it. This can be measured and displayed by appropriately placed electrodes as an electrocardiogram (ECG). The ECG is not a display of individual action potentials occurring in the myocytes; it represents the cumulative change in electrical activity over time. When the ECG is measured by electrodes placed on skin, it is typically referred to as surface ECG. Electric potentials, other than that generated by the heart, can interfere or influence the net potential measured at the level of the skin. Patients are usually instructed to breathe quietly and lay still while an ECG is being recorded to minimize interference from skeletal muscle potentials. In the perioperative setting, it is difficult to get a good ECG trace from patients who are shivering or when electrocautery is being used.
William Einthoven did pioneering work in the field of electrocardiography and was awarded the Nobel Prize in 1924. His hypothesis: The Einthoven’s triangle is used to obtain a surface ECG. According to the hypothesis, if a current source is placed in the center of an equilateral triangle, the sum of potential at the points of the triangle is zero at all times. Clinically this can be approximated by placing recording electrodes on both arms and the left leg. The heart then lies in the center of this imaginary triangle. If all these “active” electrodes are connected together, a fourth indifferent electrode with zero potential can be formulated. This indifferent electrode can hypothetically be thought to reside in the center of the triangle, just like the heart.
Two electrodes constitute a lead. Each lead has two ends: a positive potential end and either a negative or zero potential end. Current can therefore flow between an active and an indifferent electrode or between two active electrodes. The former is an example of a unipolar lead and the latter represents a bipolar lead.
There are three standard bipolar limb leads (I, II, and III) and nine unipolar leads. Originally only bipolar limb leads were used to generate a 3-lead ECG, but later with addition of nine unipolar leads (six chest leads: V1 to V6, and three augmented limb leads: aVL, aVR, and aVF), it was possible to obtain a 12-lead ECG.
In clinical practice, to generate a 12-lead ECG, 10 electrodes need to be placed on the skin as follows (◘ Fig. 17.7):
- 1.
Right Arm: anywhere between the right shoulder and elbow
- 2.
Right Leg: anywhere between the torso and right ankle
- 3.
Left Arm: anywhere between the left shoulder and elbow
- 4.
Left Leg: anywhere between the torso and left ankle.
- 5.
Precordial V1: 4th intercostal space, to the right of the sternum
- 6.
Precordial V2: 4th intercostal space, to the left of the sternum
- 7.
Precordial V3: midway between V2 and V4
- 8.
Precordial V4: 5th intercostal space at the midclavicular line
- 9.
Precordial V5: anterior axillary line at the level of V4
- 10.
Precordial V6: midaxillary line at the level of V4 and V5.
Fig. 17.7
a A cross-section of the chest shows the relative position of the six precordial leads in the traverse plane, along with a typical waveform detected for ventricular depolarization. b An anterior view of the chest shows common placement of each precordial lead, V1 through V6 (Reprinted with permission from Iaizzo [5])
Standard limb leads would then be:
- 1.
Lead I: between left arm and right arm, left arm being positive
- 2.
Lead II: between right arm and left leg, left leg being positive
- 3.
Lead III: between left arm and left leg, left leg being positive
Intraoperatively, usually a 5-electrode system is used (◘ Fig. 17.8). This has the capability of monitoring standard limb leads I, II, III; the augmented limb leads aVR, aVL, and aVF; and 1 precordial limb lead (typically V5). Monitors in the operating room, however, generally display only two of these seven possible leads. Commonly, leads II and V5 are displayed, as this combination allows the clinician to diagnose arrhythmias and ischemia optimally. The monitor can be configured to display any of the aforementioned seven leads. To yield accurate information, it is imperative that the clinician places the leads in recommended anatomical positions. Ideally, the right arm, left arm, and left leg electrodes should be equidistant from the heart to accurately reflect the electrical axis of the heart.
Fig. 17.8
Placement of the common 5-wire ECG electrode system leads on the shoulders, chest, and torso. The chest electrode is placed according to the desired precordial lead position. C chest, LA left arm, LL left leg, RA right arm, RL right leg (Reprinted with permission from Iaizzo [5])
By convention, an upward deflection on the ECG trace occurs when the active electrode becomes positive, whereas a downward deflection is generated when the active electrode becomes negative. The wave of depolarization moves from the SA node to the rest of the heart in multiple directions, but these can be summated to present a single electrical vector. The way the different leads are positioned to this vector determines if they record positive or negative deflections. These deflections give rise to the waves, segments, and intervals of the ECG. In a standard ECG strip, 1 mm square equates to 40 ms of duration on the horizontal axis and 0.1 mV of amplitude on the vertical axis. One mm square is often referred to as a “small” box. Five 1 mm squares form a 5 mm or large box (◘ Fig. 17.9).
Fig. 17.9
Single components of an ECG and their temporal relations (Reprinted with permission from Romanò [6])
The component waves are as follows:
- 1.
P wave: Represents atrial depolarization. As it includes right and left depolarization, it may be biphasic or twin peaked. It is usually upright. Height in Lead II is less than 2.5 mm and duration is less than 0.11 s. Although the SA node is the first group of cells to fire, its electrical activity cannot be measured with surface electrodes. The cumulative activity of the atria can, however, be recorded. Taller P waves may be a sign of RA enlargement, and wider or M-shaped P waves may represent LA enlargement.
- 2.
Q wave: It is a negative deflection that follows the P wave and represents septal depolarization. After myocardial infarction, pathologic Q waves develop (duration greater than 30 ms, depth greater than 0.1 mV) after a couple of days. These represent scar tissue; and as dead tissue does not conduct impulses, it produces a wide and deep negative deflection (pathological Q wave) representing flow of current away from the tissue.
- 3.
QRS complex: Represents ventricular depolarization. As left ventricle has more muscle mass than right, it contributes more to the genesis of the QRS complex. Usually duration is less than 0.12 s. R wave is upright and represents early ventricular repolarization whereas the S wave is negative and represents late ventricular depolarization. During the time when QRS is generated, the atria are repolarizing. This atrial repolarization wave or Ta is not usually seen due to the overwhelming signal generated by QRS.
- 4.
T wave: Represents ventricular repolarization. Usually these are upright but can be inverted or flat in myocardial ischemia, bundle branch blocks, LV hypertrophy, and ventricular ectopic beats. These are peaked in hyperkalemia. Tall T waves (hyperacute T waves) are also seen minutes after myocardial infarction and represent a phase of reversible myocardial ischemia that precedes myocardial necrosis. It generally occurs before ST elevation.
- 5.
U wave: usually seen in V2 to V4 leads. It follows the T wave, is usually upright, and represents late repolarization, after depolarizations, or possibly septal repolarization. Prominent U waves are seen in hypercalcemia, hypokalemia and digoxin toxicity.
Segments in ECG are the regions between two waves whereas intervals include one segment and one or more waves:
- 1.
PR segment: It extends between end of P wave and beginning of QRS complex. It is an isoelectric segment and represents the time taken for the impulse to propagate through the AV node to the bundle of His and bundle braches. It is sometimes referred to as the P-Ta segment.
- 2.
PR interval (PR segment + P wave): It extends from beginning of the P wave to beginning of the QRS complex and represents the time taken for the impulse to reach the ventricles from the SA node. As the Q wave is frequently absent, it is called PR interval rather than PQ interval. Normal values lie between 120 and 200 milliseconds. It is shortened in pre-excitation syndromes such as Wolf-Parkinson-White syndrome where an accessory pathway between the atria and ventricles allows the impulse to bypass the AV node. It is greater than 200 ms in first-degree AV block.
- 3.
QT interval: It begins at the onset of QRS and ends at the end of T wave. Thus, it includes the QRS complex, ST segment, and T wave. It represents the duration from depolarization to repolarization of the ventricles. Its duration depends upon heart rate (HR), gender, and age. It is usually corrected to the HR as it shortens with faster rates and lengthens with slower rates. This correction is done using Bazett’s formula but is not error proof:

The normal value for the QTc in men is ≤0.44 s and in women is ≤0.45–0.46 s. Hypercalcemia, hyperthyroidism, hyperkalemia, digitalis toxicity, and class IB drugs shorten the interval. Myocarditis, hypokalemia, hypocalcemia, CHF, class 1A and 3 drugs prolong it. Long QT intervals predispose to development of ventricular arrhythmias, torsade, and sudden death. In the perioperative setting, use of halogenated volatile gases (sevoflurane particularly) and antiemetics (droperidol, ondansetron) has been associated with prolonged QT interval.
- 4.
ST segment: Starts from end of QRS to onset of T wave. The initial part of the ST segment is called J point. It is normally isoelectric and represents ongoing atrial relaxation and ventricular contraction. Depression of ST segment greater than 0.5 mm helps in diagnosing ischemia and subendocardial infarction. ST segment elevation of more than 1 mm occurs with transmural infarctions, Prinzmetal’s angina, pericarditis, and ventricular aneurysms.
- 5.
RR interval: RR interval is defined as the distance between the peak of one R wave and the peak of the preceding R wave. It is usually regular and can be used to calculate the HR on a standard ECG strip. Assuming heart rhythm is regular, 1500 divided by number of 1 mm squares between two consecutive RR intervals will give us the HR. You can also divide 300 by number of large boxes to get the HR. If the rhythm is irregular, do the following:
- A.
Obtain a 6 s ECG strip. The ECG strip is usually marked at 3 s intervals. Recall, each small box is 40 ms, each large box is 200 ms or 0.2 s and thus, 15 large boxes will constitute 3 s (15 × 0.2 = 3 s).
- B.
A 6 s strip will have 30 large boxes. Count the number of R waves in 30 large boxes (or 6 s) and multiply by 10 to get the HR per minute.
- A.
17.4 The Cardiac Cycle
The sequence of electromechanical events that take place during the course of a heartbeat constitutes the cardiac cycle (CC). As outlined before, CC can be broadly divided into systole (phase of contraction) and diastole (phase of relaxation). The atria as well as the ventricles undergo contraction and relaxation. However, we shall use the terms systole and diastole to denote ventricular contraction and relaxation, unless otherwise specified. Keeping this in mind, CC then comprises broadly of six events that occur sequentially: isovolumic (ventricular) contraction, ventricular ejection (rapid and slow phases), isovolumic (ventricular) relaxation, ventricular filling (early filling), diastasis, and atrial systole.
The QRS complex of the ECG represents ventricular depolarization. This triggers ventricular contraction and an increase in ventricular intracavitary pressures. This leads to closure of the tricuspid and mitral valves, which in turn generates the first heart sound or S1. This heralds the beginning of the isovolumic contraction phase wherein ventricular pressure increases without change in volume and in this phase, all the valves are closed (beginning of R to end of S wave). The continuing increase in ventricular pressures eventually leads to opening of the pulmonary and aortic valves with rapid ejection of blood into the great arteries (rapid ventricular ejection phase). This leads to increasing pressures in the great arteries and the rate of ventricular ejection slows down (end of S wave to approximately distal portion to end of T wave represents ventricular contraction). As action potentials are time-dependent, the LV and RV start repolarizing (T wave) and eventually stop ejecting. When the ventricles stop ejecting, the PA and aortic pressures briefly exceed ventricular pressures, leading to closure of PV and AoV. This generates the second heart sound (S2) and represents end systole (approximately at around peak of T wave). The RV being crescent-shaped demonstrates peristaltic contraction and typically does not exhibit the isovolumic contraction phase like the LV.
The diastolic period has four phases: isovolumic relaxation, ventricular filling, diastasis, and atrial systole. The ventricular diastolic period (distal portion to end of T wave to beginning of QRS) starts after PV and AoV closure. The pressure in the ventricles decreases rapidly without an initial change in volume. This is called isovolumic relaxation and all the valves are closed in this phase. Atrial diastole starts and continues during ventricular depolarization (QRS) and contraction (ST). Electrically it is overshadowed by the QRS and is thus the atrial T wave or Ta (atrial repolarization wave) is not represented on the ECG. The ventricles continue to untwist and relax with continuing fall in their intracavitary pressures. On the other hand, the atrial pressures rise, given that they have been filling during atrial diastole. This pressure difference leads to opening of TV and MV, leading to rapid ventricular filling. Early filling is due to diastolic suction and contributes to about 70% of ventricular filling. It generates the third heart sound (S3). This phase is followed by diastasis, wherein rapid ventricular filling and subsequent ventricular pressure rise, impeding further filling from the atria to such an extent that the atria simply act as passive conduits for blood flow from the pulmonary veins into the left ventricle. This phase contributes about 5% to total ventricular filling and may disappear with tachycardia.
Atrial systole follows diastasis and is constituted by atrial depolarization (P wave) and contraction (PR segment) or “atrial kick.” This “kick” contributes to about 20%–30% of ventricular filling and generates the fourth heart sound (S4). When the heart is hypertrophied or has low compliance, the atrial kick may be responsible for up to 40% of ventricular filling.
Atrial contraction is followed by atrial relaxation or diastole. Following atrial contraction, the propagating impulse leads to ventricular depolarization (QRS). This marks the beginning of ventricular systole. As the ventricles fill up during diastole, the intracavitary pressures rise, leading to closure of TV and MV and beginning of isovolumic contraction completing the cardiac cycle.
Thus, atrial systole occurs during ventricular diastole and ventricular systole occurs during atrial diastole. This mechanism of sequential activation is important to ensure forward flow of blood through the pulmonary and systemic circulation. Additionally, the kinetic energy of ventricular ejection is stored as potential energy in the great arteries and released to the distal vasculature during diastole ensuring forward flow through the entire CC [3, 4].
17.4.1 Timing of Events
Although the right and left hearts undergo similar events during the CC, the timing of events is asynchronous. RA depolarization precedes LA depolarization but they contract almost simultaneously. As the LV depolarizes first, its contraction precedes RV contraction. However, as the PA pressures are lower compared to systemic pressures, the PV opens first allowing the RV to eject before the LV. The pulmonary vascular impedance is lesser than that of the aorta and this allows the RV to eject for a longer time than the LV, leading to a later closure of the PV as compared to the aortic valve. This difference in timing of closures of aortic (early) and pulmonary valves (later), leads to splitting of the second heart sound (S2).
17.4.2 Heart Sounds and Waveforms Generated During the Cardiac Cycle
Heart sounds can be auscultated at the bedside using a stethoscope. A stethoscope usually has a bell and a diaphragm; the former is used to listen to low frequency sounds (S3 and S4) and the latter for high frequency sounds (S1 and S2).
The following heart sounds are usually generated:
S1: It has a frequency of about 30 Hz and is commonly heard as “lub.” It has two components: one generated by closure of MV or M1 (occurs first) and the other by closure of TV or T1 (occurs later). However, the two events occur too closely to usually differentiate by auscultation. S1 occurs coincident with the upstroke of the carotid pulse and is best heard at the cardiac apex as its intensity is primarily determined by M1. It is accentuated in mitral stenosis (MS) or tricuspid stenosis (TS), atrial myxomas, tachycardia, pre-excitation syndromes (short PR intervals), and conditions associated with increased flow through the valve such as patent ductus arterious (PDA) or ventricular septal defect (VSD). Its intensity is decreased when the valves are immobile due to fibrosis (mitral regurgitation/MR) or calcification and with long PR intervals. As S1 has two components, it can be split in pathological conditions such as complete RBBB, LV pacing, atrial septal defects (ASD), and Ebstein’s anomaly. In ASD, the split is wide and fixed: it does not vary with the phase of respiration. In most other conditions, the split varies in intensity with inspiration and expiration.Related posts:

Stay updated, free articles. Join our Telegram channel

Full access? Get Clinical Tree


