Chapter 1
Approach to Acute Respiratory Failure
Definitions
Acute respiratory failure is the final common pathway for diverse clinical disorders. Acute refers to an onset usually measured in terms of hours or days (i.e., less than 7 days) . Respiratory failure indicates a severe impairment of pulmonary gas exchange; it is categorized into two types. Hypercapnic respiratory failure occurs when a patient’s Paco2 rises to greater than normal—that is, greater than 45 mm Hg. Hypoxemic respiratory failure occurs when a patient’s Pao2 falls so low that it is life-threatening or has serious adverse physiologic effects. For example, in cases of acute hypoxemic respiratory failure, Pao2 is often less than 55 mm Hg despite the administration of high, potentially toxic concentrations of oxygen. A Pao2 of 55 mm Hg corresponds to a modestly reduced arterial hemoglobin saturation of about 88%. This is near the top of the steep part of the oxygen-hemoglobin (O2-Hgb) dissociation curve, and further decrements result in steep, linear falls in arterial O2 content (see Figures A1 and A2 in Appendix A for O2-Hgb dissociation curves).
Four Components of the Respiratory System
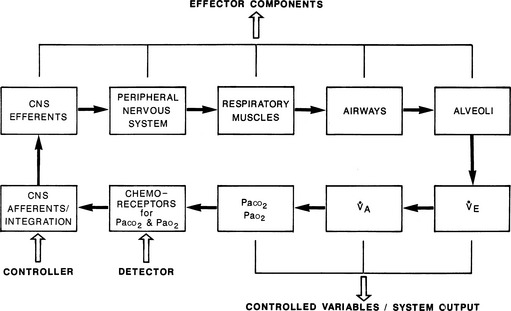
The respiratory system can be regarded as having four functional and structural components: (1) the central nervous system (CNS) component (chemoreceptors, the controller [respiratory center in the medulla], and CNS efferents); (2) the chest bellows component (composed of the peripheral nervous system, respiratory muscles, and the chest wall and soft tissues surrounding the lung); (3) the airway component; and (4) the alveolar component. Together they form the effector arm of the respiratory system’s feedback and control loop (Figure 1.1).
1. The CNS controller initiates respiratory drive by generating neural output. The rate and intensity of its output are determined by the feedback provided by peripheral chemoreceptors (monitoring Pao2 and Paco2) and central chemoreceptors (monitoring Paco2 or its effects) and by input from other neural sources.
2. The neural impulses from the CNS controller traverse the spinal cord and the phrenic and other motor neurons and reach the diaphragm and other respiratory muscles.
3. In response, these muscles expand the chest cavity, displace adjacent abdominal contents, and produce negative (subatmospheric) pleural pressure within the thorax.
4. This negative pressure is transmitted to the alveoli, creating a gradient between the alveoli and atmospheric pressure at the mouth. In response, air flows through the conducting airways to the alveoli, leading to lung inflation.
5. Finally, alveolar O2 passively diffuses across the alveolar-capillary membrane so that red blood cells become fully equilibrated with alveolar Po2 as they pass through alveolar capillaries. The same process, but in the reverse direction, occurs for CO2.
Respiratory Pump and Control of Paco2
Under normal conditions, the feedback and control loop (see Figure 1.1) maintain the system’s set point for Paco2 at 40 mm Hg. Pathologic conditions, however, can move this set point up or down. Under such circumstances, the CNS controller tries to achieve the “proper” level of Paco2 at this new set point by changing minute ventilation.
Because the actions of the respiratory system’s first three components (CNS, chest bellows, and airway) determine a patient’s minute ventilation, they have been called the respiratory pump. Minute ventilation can be increased or decreased by the respiratory pump by changing tidal volume, respiratory rate, or both (Box 1.1, Equation 1). Because this pump controls Paco2 levels, failure of one or more of its components can result in hypercapnic respiratory failure.
Although the respiratory pump changes minute ventilation (abbreviated as  , because one measures expired minute ventilation), how those changes affect Paco2 depend on associated changes in alveolar ventilation,
  (Table 1.1, Equation 2). Unlike
  , which is measurable by a spirometer,
  is a theoretic quantity that cannot be measured directly but can be illustrated if the lung is viewed as a two-compartment model. In this model, the lung has an alveolar space (for gas exchange) and a dead space (for convective gas flow) (Box 1.1, Equation 3). The latter includes anatomic dead space (the trachea and other conducting airways) and alveolar dead space (alveoli with ventilation/perfusion ratios [
 ] >1.0). In this model, minute ventilation,
  , is the sum of alveolar ventilation,
  , and dead space ventilation,
  (Box 1.1, Equation 4) or, alternatively, can be expressed as a function of alveolar ventilation and ratio of dead space to tidal volume (
 ) (Box 1.1, Equation 7).
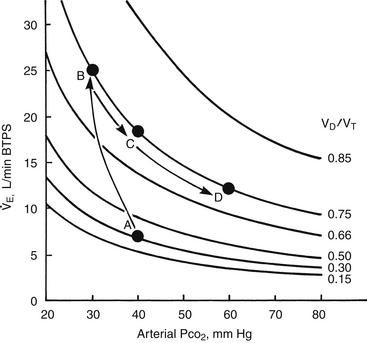
If VD/VT and  (Table 1.1, Equation 10) remain constant, Paco2 has a hyperbolic relationship with
  (as the right-hand side of Equation 10 would be a constant). Figure 1.2 illustrates this relationship and how changes in
  affect Paco2 at different values of VD/VT.
< div class='tao-gold-member'>
Stay updated, free articles. Join our Telegram channel

Full access? Get Clinical Tree


 ), alveolar ventilation (
 ), Pa
), Pa
 is the expired minute ventilation, VT is the tidal volume, and RR is the respiratory rate

 A is alveolar ventilation

 A is alveolar ventilation (
 A =VA × RR), and
  D is dead space ventilation (
 D = VD × RR)
 /VT by rearranging
 D in
D in  (VD/VT) as derived in
  /(1 – VD/VT)
 × (1 – VD/VT)
 A
A
 ]
] A in
A in  = K ×
= K × 

 = K ×
= K × 


 ) (ordinate) that is needed to achieve a certain level of Pa
 L/min. If VD/VT increases to 0.75 due to an acute asthma flare and if a new, lower value of Pa
 of ~25 L/min (point B). Point C represents the “crossover” point at which the Pa
 falling to ~18 L/min because of the onset of respiratory muscle fatigue. Finally, at point D, the patient has acute respiratory failure with elevated Pa
 that has decreased farther from point B or C but remains greater than at baseline (point A).
