and multiplying both sides by 158 gives:
Mechanics
Mechanics is the study of how objects around us move or remain at rest. This subject requires an understanding of the quantities listed in Figure 44.6.
| Quantity | Vector or scalar | Description | SI unit |
|---|---|---|---|
| Displacement | Vector | Distance measured in a given direction | m |
| Velocity | Vector | Change in displacement per second | m⋅s–1 |
| Acceleration | Vector | Change in velocity per second | m⋅s–2 |
| Mass | Scalar | Amount of matter present in an object | kg |
| Force | Vector | An external ‘push’ or ‘pull’ which when applied to an object can change its state or motion | N |
| Weight | Vector | Gravitational pull acting on an object | N |
| Pressure | Scalar | Force per unit area | Pa |
| Energy | Scalar | Capacity to do work (stored work) | J |
| Work | Scalar | Energy expended when a force moves its point of application | J |
| Power | Scalar | Work done per second | W |
Mass and weight
Mass is the amount of matter present and is a property of an object which remains constant no matter where the object is located.
Weight is the gravitational force acting on an object and is given by the product of mass (m) times the acceleration due to gravity (g):
The weight of an object therefore varies according to its location. It will be less on the moon than on earth, and it will be greater at the North Pole than at the Equator.
Force and pressure
The relationship between force and pressure is
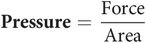
Consider the force used when when injecting with a large syringe compared to a small syringe. In order to eject fluid from either syringe the same pressure must be developed. However, the force required to depress the plunger of the syringe will depend on the cross-sectional area of the syringe barrel, since
For example, let the pressure required in the syringe equal p, and consider a 2 mL syringe with a radius a. The force required is given by
Compare this with a 20 mL syringe in which the radius is 2a. Here the force required becomes
Thus four times the force is needed to depress the plunger in a 20 mL syringe compared to that required in a 2 mL syringe (Figure 44.7).
Force required to depress plunger in a syringe
Work done by a force
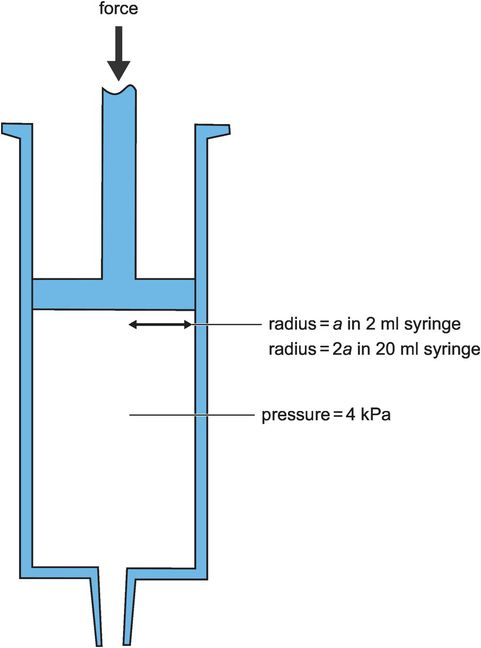
The work done by a force acting on an object can be calculated by the product of force and the distance moved through by its point of application.
Consider the work done by a force F raising an object of mass m throught a height h (Figure 44.8). In order to lift the mass, the force must be at least equal to the weight of the object:
where g = acceleration due to gravity
The work done in raising the object has resulted in a gain in potential energy due to its increase in height (energy by virtue of position or state). This potential energy represents a capacity to do work, or may be converted to another form of energy such as kinetic energy, if the object were allowed to fall. As the object falls it loses potential energy but gains kinetic energy (energy by virtue of its velocity).
Work done by force raising a mass
Work, energy and power
Work and energy are closely related, since the expenditure of energy usually results in the performance of useful work, and similarly the performance of work often produces changes in energy levels. Energy is not destroyed but merely converted from one form to another. In a mechanical system, when energy is expended in doing work or converted from one form to another, there is usually an apparent ‘loss’ due to the inefficiencies of any real system (e.g. friction). This apparent ‘loss’ of energy often appears as a production of heat.
Power
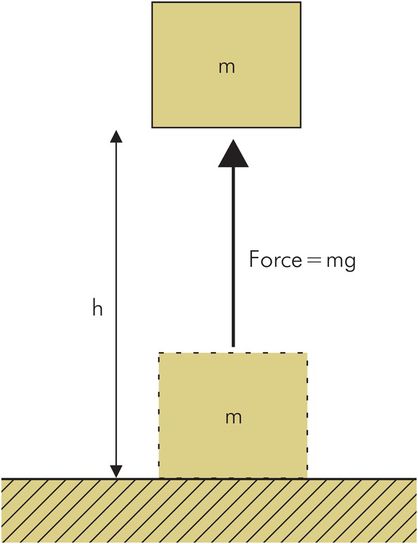
Power is the rate of doing work or the energy expended per unit time. To calculate the power output of a machine or process, divide the total work done by the time taken.
Consider 24 hours given basal metabolic rate of 2400 kcal per day.
Hydrostatics
This is the study of fluids and their pressure and volumes while they are at rest. An understanding of hydrostatics is useful when considering:
Pressure measurement by a barometer or manometer
How chest drains work
Work done in compressing gases by a ventilator
Work of breathing done by the body
Work done by the myocardium in providing the cardiac output
Hydrostatic pressure
Manometers and barometers measure pressure using a column of fluid. This is done by balancing the unknown pressure against the pressure produced by the weight of a column of fluid.
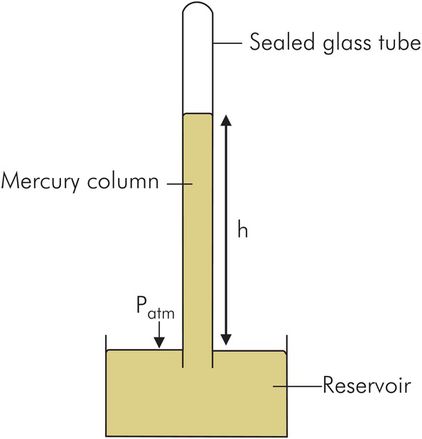
In a barometer the measuring column of fluid is mercury and closed to the atmosphere. The column of mercury is then balanced against the atmospheric pressure acting on the reservoir (Figure 44.9).
In a manometer the measuring column is open to the atmosphere and an unknown pressure is applied to the base of this column via a closed limb as in the sphygmomanometer, in which the fluid is mercury. For measuring lower pressures the fluid may be water or alcohol.
Calculation of pressure in a barometer
Barometric pressure
A barometer balances atmospheric pressure (Patm) acting on the surface of a reservoir against the pressure at the base of a column of mercury. The mercury column must therefore be in a sealed glass tube, since if it were open, as in the sphygmomanometer, no difference in mercury levels would exist.
Calculation of the pressure at the base of the mercury column in a barometer
where height of column (h) = 0.76 m, density of mercury (ρ) = 13.6 × 10 3 kg m–3, and acceleration due to gravity (g) = 9.81 m s–2.
Therefore the atmospheric pressure measured by a column of mercury 760 mm tall is given by:
This can be used to convert between kPa and mmHg:
Gauge pressure
When an unknown pressure is measured relative to atmospheric pressure (as is usually the case in clinical practice) the value obtained is referred to as a ‘gauge’ pressure. This is the case in measurements such as blood pressure or airway pressure.
Work done by a ventilator in compressing inspiratory gases
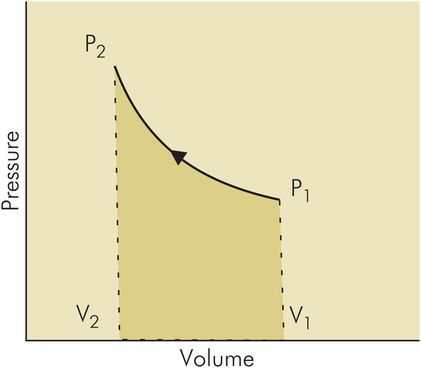
When a volume of gas is compressed work is done, and potential energy is gained by the gas. This is analogous to the storage of potential energy in a spring when it is compressed. The work done in compressing a volume of gas from volume V1 to V2 with a pressure (p) can be found by plotting a pressure–volume curve and finding the area under the curve (Figure 44.10):
In order to estimate the inspiratory work in delivering a breath of 500 mL, a simple example can be taken.
Consider a constant inspiratory pressure of 1.0 kPa applied to produce a tidal volume of 500 mL in a patient (Figure 44.11). The inspiratory work done per breath would then be 1000 × 0.5 × 10–3 J = 0.5 J.
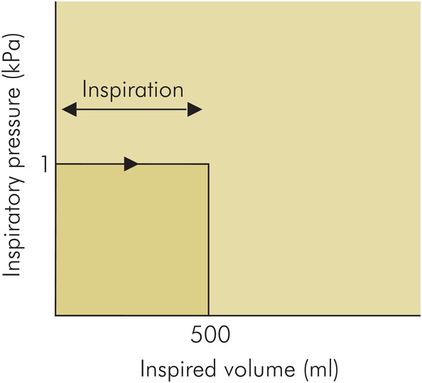
Pressure–volume curve with constant pressure showing work done
When the complete inspiratory–expiratory cycle of a ventilator is plotted the pressure and volume axes are traditionally shown as in Figure 44.12. Note the arrangement of the axes, with pressure on the x-axis and volume on the y-axis: this is done to give the familiar inspiratory–expiratory loop. Work is performed in compressing the inspired gas and expanding the patient’s lungs (inspiratory curve). This stores potential energy as elastic energy in the gases and tissues of the respiratory system, which then performs work in restoring the lungs to their original volume (expiratory curve). In an ideal system with 100% efficiency the inspiratory and expiratory curves would coincide, since no energy is wasted in frictional losses. The amount of energy put into the system during inspiration is thus returned in full during expiration. In practice when this cycle of events is plotted on a pressure–volume curve, as in Figure 44.12, the inspiratory and expiratory curves do not coincide, and a loop is formed. This phenomenon is known as hysteresis, and the area of the loop represents the inspiratory and expiratory work ‘wasted’ over the complete cycle.
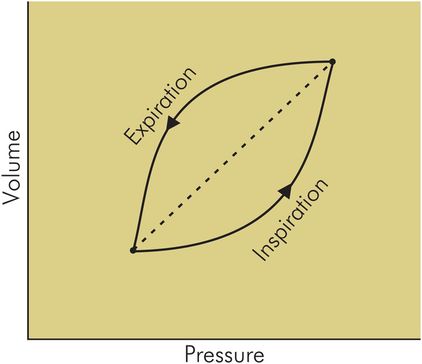
Pressure–volume loop for ventilator cycle, showing hysteresis
Work of breathing
Under resting conditions the work done in inspiration can be approximated by considering a simple model as described above.
Work of breathing, at an expenditure of 0.5 J per breath and a resting respiratory rate of 12 per minute, is given by
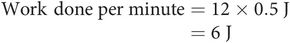
Allowing for the fact that respiratory muscles are only about 10% efficient, the total expenditure on work of breathing is approximately 1 W, which is equivalent to 1% of basal metabolic requirements. Under stressful or pathological conditions work of breathing may increase tenfold or more and represent a significant energy requirement.
The work of breathing during spontaneous respiration is considered in further detail in the section on ‘Respiratory Physiology’.
Work done by the myocardium
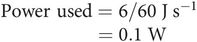
The work performed by the myocardium of the left ventricle during each cycle of the heart can be derived from a pressure–volume loop plotted for the ventricle (Figure 44.13). This loop is described in detail in Chapter 14 (see Figure 14.18.). Calculation of the area of this loop gives the work done per cycle by the left or right ventricle, which can then be normalised for body surface area to give left or right ventricular stroke work index (LVSWI or RVSWI).
Pressure–volume loop for left ventricle
Figure 44.13 shows an example for the pressure–volume loop of a left ventricle. A gross simplification of the loop enables an estimate to be made. The work done per cycle is then given by
where
MAP = mean arterial pressure = 90 mmHg = 12 kPa
PCWP = mean pulmonary capillary wedge pressure = 7.5 mmHg = 1 kPa
SV = stroke volume = 80 mL = 0.080 × 10⁻³ m3
Therefore, for a heart rate of 70 min–1:
Assuming a 10% efficiency for the myocardium, the total energy requirements to provide 5.6 L min–1 of cardiac output becomes approximately 10 W, i.e. approximately 10% of basal metabolic requirements.
Heat
Heat is a form of energy which can be transferred from hot objects to cooler objects. Temperature is a measure of how hot or cold an object is i.e. a measure of its thermal state. Therefore heat energy will tend to pass across a temperature gradient from high to low temperatures. When heat is transferred to an object its temperature will increase, similarly the loss of heat energy from an object will be accompanied by a fall in temperature.
Units of heat energy
Heat energy is measured in joules (J), but traditionally has also been measured in calories (cal) or kilocalories (kcal or Cal).
1 calorie is defined as the amount of heat required to raise the temperature of 1 g of water by 1 °C:
Temperature scales
Temperature scales have been defined in the past by using known fixed temperatures, such as the boiling and freezing points of water at one standard atmosphere pressure. Some temperature scales are compared in Figure 44.14 using these points.
| Scale | Freezing point H2O | Boiling point H2O |
|---|---|---|
| Kelvin | 273.15 K | 373.15 K |
| Celsius | 0 °C | 100 °C |
| Fahrenheit | 32 °F | 212 °F |
The boiling and freezing points of water, however, vary according to ambient pressure, and nowadays a more invariant point called the triple point of water (see below) is used to define the two most commonly used temperature scales of kelvin and degrees Celsius. Practical methods of measuring temperature are discussed in Chapter 45.
Specific heat capacity and heat capacity
In an object the relationship between temperature change and amount of heat energy added or removed depends on the size of the object and the material it is composed of.
Specific heat capacity, s (kJ kg–1 °C–1) is the amount of heat required to raise the temperature of 1 kg of a substance by 1°C. For example, the specific heat capacity of water is 4.16 kJ kg–1 °C–1. The average specific heat capacity of body tissues is between 3 – 4 kJ kg–1 °C–1
Heat capacity, T (kJ °C–1) is the amount of heat required to raise the temperature of an object by 1°C. If the object has a mass = M, and is composed of material with a specific heat capacity = s, then it has a heat capacity given by
Thus the heat capacity of a 70 kg adult, assuming a specific heat capacity of 3.5 kJ kg–1 °C–1 , is given by
Gases, liquids and solids
The addition or removal of heat energy to or from a substance will not only cause a variation in its temperature, but can also cause that substance to change its physical state. Any substance can exist in three states (phases) as a solid, liquid or gas. The conditions determining which state exists are temperature and pressure. At any given pressure the transition between solid and liquid occurs at a fixed temperature, the ‘freezing point’, while the transition between liquid and gas occurs at the ‘boiling point’. However, changes in ambient pressure cause boiling and freezing points to vary. At sea level water boils at 100 °C , but at 5500 m, where atmospheric pressure is approximately halved, the boiling point of water decreases to 80 °C.
Critical temperature
Both pressure and temperature can change the state of a substance. Thus gases can be liquefied either by cooling or by increasing the pressure. However, there is a temperature above which any gas cannot be liquefied by increasing pressure. This is the critical temperature (TC).
Critical temperature is defined as the maximum temperature at which a gas can be liquefied by increasing ambient pressure. Above critical temperature the gas cannot be liquefied by increasing ambient pressure.
The critical temperature for oxygen is –119 °C, and therefore oxygen in a cylinder at room temperature is always gaseous, no matter how much the pressure is increased. However, the critical temperature for nitrous oxide is 36.5 °C . This means that at normal room temperature (20–25 °C), a cylinder of nitrous oxide contains a mixture of liquid and gas. Should the ambient temperature exceed 36.5ºC (as in a tropical country), the nitrous oxide in a cylinder will only exist in gaseous form.
Variation of physical state with pressure and temperature
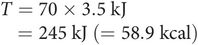
The way in which temperature and pressure determine the physical state of a substance is illustrated in Figure 44.15. This figure shows curves plotting volume against pressure for a given mass of substance. Each curve is plotted at a given temperature and is called an isotherm. The middle curve is plotted at the critical temperature (TC), while TH is plotted at a temperature above TC , and TL is less than TC.
TH– at temperatures higher than the critical temperature, the substance exists only as a gas and the variation of volume with pressure, at constant temperature, follows a simple hyperbolic curve or inverse relationship, according to Boyle’s law.
TC– at the critical temperature, the substance exists as a vapour at low pressures (i.e. below critical pressure). However, when pressure increases above critical pressure the vapour liquefies, producing an inflexion point in the curve. Further increases in pressure do not then decrease the volume, as the liquid state is effectively incompressible.
TL– at temperatures lower than critical temperature, the substance exists as a liquid at high pressures. As the pressure decreases the volume remains constant until a point is reached when the liquid begins to boil (i.e. at the saturated vapour pressure, SVP) and a mixture of liquid and vapour is produced. The volume of this mixture at SVP varies according to the degree of vaporisation. When complete vaporisation has occurred, volume again follows an inverse relationship with pressure.
The isotherms map out areas which define the physical state of the substance. At temperatures above TC (plain area) the substance exists only as a gas. At temperatures below TC the substance may be in liquid form (darker shaded area); it may be a vapour (lighter shaded area); or it may exist as a mixture of both. This diagram is typical for a substance such as nitrous oxide, where TC is equal to 36.5 °C.
Isotherms for nitrous oxide
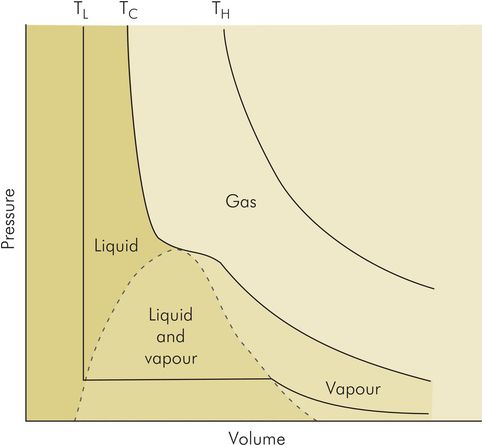
Triple point of water
Water can exist in three phases, as water vapour, liquid water and ice. These phases will depend on temperature and pressure as shown in Figure 44.16. The transition between water and water vapour is demarcated by the boiling point of water (P), which is 100 °C at 1 atmosphere, but which increases with increasing pressure (OA).
Triple point of water
Water vapour and water therefore coexist along OA. Similarly the freezing point of water (0 °C at 1 atmosphere) separates water and ice, but decreases with increasing pressure (OB). Ice and water thus coexist along OB. Finally, OC separates ice and water vapour, and these phases coexist along this line.
There is a single point (O) at which the three phases of water coexist, at a pressure of 0.006 atmospheres and 0.01°C. This is the triple point of water (Figure 44.16).
Vapours and gases
The term gas is applied to a substance which is normally in its gaseous state at room temperature and atmospheric pressure. Its critical temperature is below room temperature and therefore it cannot exist as a liquid.
The term vapour refers to a gaseous substance which is normally in liquid form at room temperature and atmospheric pressure, since its critical temperature is above room temperature. Thus a vapour is a gaseous substance which is below its critical temperature under ambient conditions.
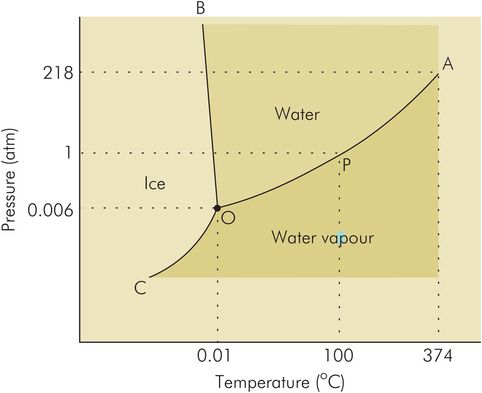
Saturated vapour pressure and its relationship to boiling point
A vapour is formed from a liquid by evaporation, or the escape of molecules from the liquid surface. This process also occurs from the surface of solids to a small extent by a process known as sublimation.
When evaporation takes place from the surface of a liquid the concentration of vapour above the liquid increases. This process continues until a state of equilibrium is reached when no further increase in vapour concentration occurs. At this stage the vapour is said to be saturated, and the vapour pressure is the saturated vapour pressure (SVP).
Saturated vapour pressure (SVP) can be defined as the pressure exerted by a vapour when in contact and equilibrium with its liquid phase. The SVP of a liquid increases with temperature (Figure 44.17). The temperature at which the SVP becomes equal to atmospheric pressure is the boiling point of the liquid.
Variation of SVP with temperature
Latent heat
When a substance changes phase, from liquid to gas or from solid to liquid, the molecular separation and bonding change. Water molecules in steam are about 12 times further apart than in liquid water. This increased separation of the molecules represents stored potential energy since the hydrogen bonds between water molecules in liquid water are very strong. Work is therefore required to achieve this molecular separation, which is provided by the latent heat absorbed.
If ice is heated from a sub-zero temperature (Figure 44.18), its temperature will rise steadily except when it passes through the two transitions in phase from solid to liquid (freezing point) and from liquid to gas (boiling point). At these transition points the temperature remains constant while latent heat is absorbed to increase molecular separation. The latent heat associated with these changes in state is known as latent heat of fusion and latent heat of vaporisation, respectively.
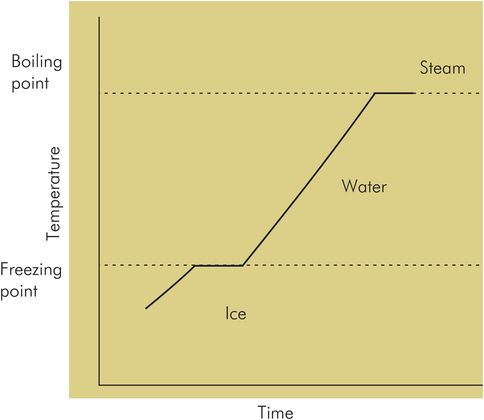
Variation of temperature of a block of ice being heated
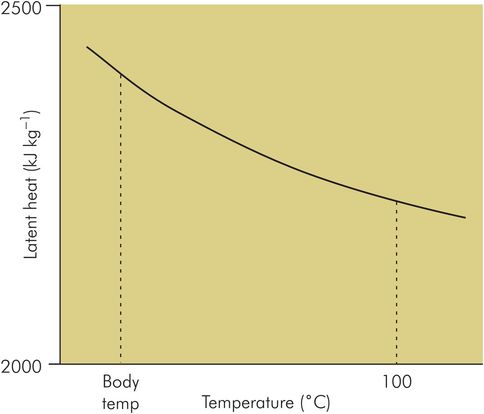
Liquids also evaporate at temperatures lower than their boiling point and will also require latent heat of vaporisation to achieve this change in state. However, the cooler the liquid the greater the amount of latent heat required to increase the liquid molecular energy levels to those possessed by vapour molecules. Thus specific latent heat of vaporisation increases as temperature decreases (Figure 44.19), and is usually quoted at a given temperature.
Heat loss due to ventilation with cool dry gases
Poor preparation of inspired gases can cause a patient to lose body heat, because:
The gases are not warmed and heat is lost in warming the gases to body temperature.
The gases are not humidified and heat is lost due to evaporation in order to humidify the gases in the respiratory tract.
These losses can be calculated as follows:
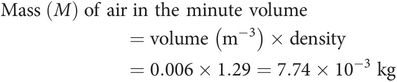
Consider ventilating with air at 20 °C (body temperature = 37 °C) with a minute volume of 6 L min–1 . The specific heat capacity (s) of air is 998 J kg–1 °C–1 and the density of dry air at normal temperature and pressure (NTP) is 1.29 kg m–3.
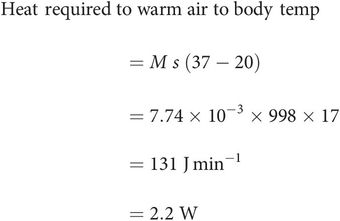
If basal metabolic requirements are approximately 100 W this represents just over 2% of basal requirements.
Calculation of heat loss in humidifying gases
Fully saturated air at 37 °C contains approximately 43 g m–3 (0.043 kg m–3) of water. Assume 6 L min–1 of ventilation with dry gases which become 100% humidified in the respiratory tract. If the specific latent heat of vaporisation of water at 37 °C is 2420 kJ kg–1, then the amount of water vapour required to humidify the inspired minute volume is given by
Thus the total heat losses due to using cool unhumidified gases are
Humidity
Humidity is a measurement of the amount of water vapour present in the air. It may be presented in two ways, either as an absolute humidity value or as a relative humidity value.
Figure 44.20 shows how the relative humidity (RH) of a sample of air which is saturated at 20 °C (RH = 100%) decreases as temperature increases. The amount of water vapour required to saturate air at 20 °C is approximately 17 g m–3 . However, at 37 °C, approximately 43 g m–3 is required for saturation, so the RH of the given sample decreases to 39%. From this example it can be seen that humidifying inspired gases at room temperature results in only about 40% RH at body temperature.
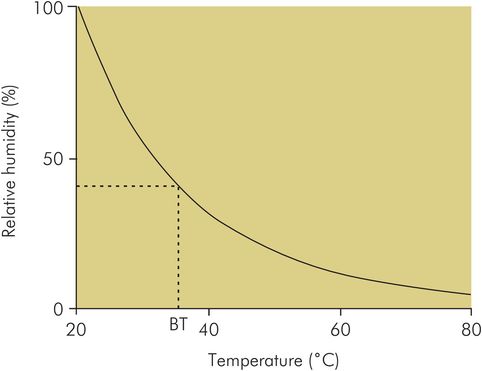
Variation of relative humidity with temperature
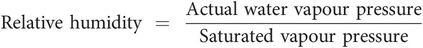
Calculation of RH from water vapour pressure and SVP
Since the partial pressure exerted by a gas is proportional to the mass of gas present, the relative humidity can be determined from the actual water vapour pressure and the saturated water vapour pressure at the given temperature:
Methods of humidity measurement are discussed in Chapter 45.
Heat transfer
Heat energy can be transferred by different mechanisms:
Conduction – When one end of a bar of metal is held in a fire the cool end gradually gets hotter as heat travels along the bar. This form of heat transfer is conduction. In the metal the atoms maintain a mean fixed position, unlike the case of a liquid or gas. The atoms, however, are free to vibrate about their mean position, the amplitude of this motion being dependent on the temperature of the solid. When this vibration is increased by raising the temperature in one region, the vibration is transmitted to neighbouring atoms, causing their temperature to increase and heat to be transferred. Clearly conduction requires physical continuity or contact. Net movement of the medium transferring heat does not occur in conduction. Conduction also occurs in liquids and gases, but the transfer of heat in these cases occurs mainly by convection.
Convection – This mechanism describes the transfer of heat in a liquid or gas when one region becomes heated. Increasing the temperature locally in a liquid or gas causes the density locally to decrease. This less dense fluid then rises to be replaced by cooler denser fluid. This results in a convection current, or the bulk movement of the fluid with an accompanying transfer of heat energy. Hot air currents in the atmosphere and the continuous movement of water in a kettle as it boils are examples of convection.
Radiation – Heat energy can also be transferred by electromagnetic radiation in the form of infrared radiation (see Figure 44.76). This enables heat transfer to occur across a vacuum in the absence of any physical continuity or surrounding medium. Radiation is the mechanism by which heat is transferred from the sun to earth. Any object is capable of both emitting and absorbing infrared radiation with a resultant loss or gain of heat energy.
The importance of these mechanisms in anaesthesia lies in heat losses suffered by a patient during prolonged periods of anaesthesia or sedation. These mechanisms are considered, together with additional factors such as losses due to evaporation from the respiratory tract and by sweating, in Chapter 21.
Gases
Gases, unlike solids and liquids, are compressible and change their volume when different pressures are applied to them. Therefore the physical behaviour of a gas can be described by three parameters, pressure (P), volume (V) and temperature (T). This is summarised by the gas laws for a fixed mass of gas:
The relationship between volume and pressure at constant temperature (Boyle’s law):

The relationship between volume and temperature at constant pressure (Charles’ law):
The relationship between pressure and temperature at constant volume (Gay-Lussac’s law):
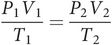
The ideal gas equation
The above three laws can be summarised into a single equation, the ideal gas equation:
This equation enables us to convert from one set of conditions to another when a fixed mass of gas undergoes changes in pressure, volume or temperature, since
The gas constant (R)
The ideal gas equation may be written as
where k is a constant dependent on the mass of gas present. If n = number of moles of gas present, the ideal gas equation becomes:
where R is known as the universal gas constant, and can be evaluated by considering 1 mole of gas at 273 K (0 °C) at a pressure of 1 atmosphere. This gives a value of
Gas contents in a cylinder
From the ideal gas equation, the pressure exerted by any gas is dependent on the number of moles present. Therefore, in a fixed volume such as a gas cylinder, the pressure in the cylinder is a measure of the amount of gas contained (e.g. in an oxygen cylinder). However this does not apply to a vapour (where liquid and gas phases are present, such as in a full nitrous oxide cylinder), since the pressure then reflects the saturated vapour pressure. However, it should be noted that the critical temperature (Tc) for nitrous oxide is only 36.5 °C, and if ambient temperature rises above this value nitrous oxide cannot exist in its liquid state.
Avogadro’s hypothesis
The above gas laws apply to any gas as long as the ‘given mass’ of gas remains the same, since gas behaviour is determined by the number of molecules present rather than the absolute mass present. This idea is based on a hypothesis proposed by Amedeo Avogadro in 1811, which stated:
Equal volumes of gases, under the same conditions of temperature and pressure, contain equal numbers of molecules.
An important conclusion following from this hypothesis was that gaseous elements exist as molecules (O2 and N2) rather than as single atoms. This explained apparent anomalies in behaviour between gaseous elements and gaseous compounds.
Dalton’s law of partial pressures
Dalton’s law of partial pressures states that if a mixture of gases is placed in a container then the pressure exerted by each gas (partial pressure) is equal to that which it would exert if it alone occupied the container.
Thus in any mixture of gases (e.g. alveolar gas, fresh inspired gases, air), the partial pressure exerted by each gas is proportional to its fractional concentration.
Consider a mixture of 5% carbon dioxide, 15% oxygen and 80% nitrogen. If the mixture exerts a total pressure of 100 kPa, then the partial pressures exerted by each gas are pCO2 = 5 kPa, pO2 = 15 kPa and pN2 = 80 kPa.
Similarly, if the total pressure exerted by the gas mixture is increased to 200 kPa, then the partial pressures become pCO2 = 10 kPa, pO2 = 30 kPa and pN2 = 160 kPa.
Adiabatic compression or expansion of gases
Adiabatic, when applied to the expansion or compression of a gas, means that heat energy is not added or removed when the changes occur. Thus when compression of a volume of gas occurs, it is accompanied by a temperature rise, and similarly expansion of a volume of gas will produce a temperature fall. Practical consequences of this are that compression of gases will require added cooling to avoid unwanted heating of the system.
Alternatively, expansion of gases in the airway during jet ventilation can produce localised cooling, which in turn can reduce the humidity of injected gases. A practical application of the adiabatic expansion of gases lies in the cryoprobe. Here expansion of gas in the probe is used to produce low temperatures in the tip for cryotherapy.
Hydrodynamics
Gases, liquids and fluid behaviour
Although gases and liquids differ considerably in their physical properties, they display similar behaviour under flow conditions, and can both be described as being ‘fluid’. The following points are similarities in behaviour between gases and liquids:
Liquids and gases both fill the shape of their container, and are subject to constraints imposed by gravity. However, because of their lower density, gases are less affected by gravity than liquids.
The flow behaviour of gases and liquids is largely determined by density and viscosity, although gases have much lower density and viscosity than liquids.
In both gases and liquids, flow is produced by the application of a pressure gradient.
The similarity between gases and liquids in flow behaviour has led to the development of fluid dynamics, which is the study of fluids in motion, and applies equally to both gases and liquids.
Viscosity
Viscosity may be thought of as the ‘stickiness’ of a fluid. This property of a fluid can show itself in many ways. Imagine trying to pour treacle from a bottle compared to pouring water from the same bottle. Viscosity will affect the flow of fluids through a tube: the more viscous the fluid, the slower the flow through the tube. Gases are far less viscous than liquids, and viscous effects only become apparent at much higher flow velocities in gases compared to liquids.
The viscosity of a fluid can be quantified by its coefficient of viscosity. In order to understand how the coefficient of viscosity for a fluid is obtained, the concepts of shear stress and shear rate are required.
Shear stress and shear rate
A viscous force, or drag, is felt on any object if it moves through a fluid, or if the fluid moves past the stationary object. Figure 44.21 shows a thin, flat plate with a fluid flowing past it. Away from the plate, the fluid flow is faster, but closer in towards the plate the fluid is slowed down by the presence of the plate until at the surface the fluid is not moving. This happens at any surface because of adhesion between the fluid and the solid surface; it is known as the ‘no-slip’ condition. Near to the surface, the flow pattern is deformed from one of uniform flow velocity to one in which layers of fluid parallel to the direction of flow ‘slip’ against each other, giving rise to a drag effect or ‘shearing’ action. This shearing action at the surface gives a drag force per unit area of the plate, which is called the shear stress. This is illustrated in Figure 44.21. The lengths of the arrows represent the velocity of the fluid, which diminishes to zero next to the plate. The velocity of flow thus varies between these fluid layers, i.e. a velocity gradient perpendicular to the direction of flow, or shear rate, is produced.
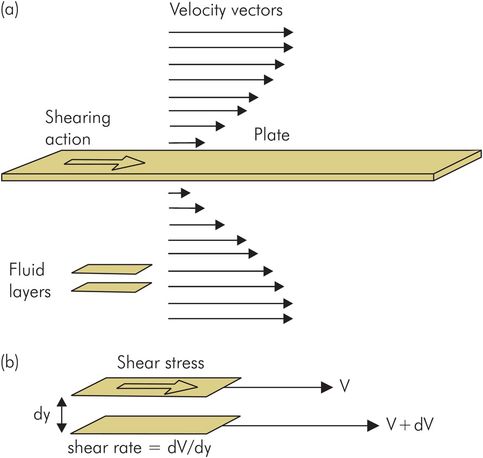
Shear stress and shear rate
Coefficient of viscosity
The coefficient of viscosity (or simply ‘viscosity’) of a fluid can be defined by considering laminar flow in which two parallel layers of fluid are slipping against each other. As described above this produces two effects, a shear stress between the layers, and a velocity gradient at right angles to the direction of flow (shear rate). The coefficient of viscosity (or viscosity) is defined by:
The units of viscosity are poises, after Poiseuille, who discovered the laws governing the flow of fluids through tubes. Water has a viscosity of 0.0101 poises at 20 °C, while air has a viscosity of 0.00017 poises at 0 °C.
Viscosity varies with temperature. Liquids generally become less viscous with increasing temperature, while gases become more viscous as temperature rises.
Newtonian fluids
These are fluids in which viscosity, η, is constant, regardless of the velocity gradients produced during flow. Many fluids, including water, are Newtonian. Some fluids, however, do not behave in this way, such as the shear-thinning fluids whose viscosity falls as the shear rate between layers increases, and the rheotropic fluids, which become more viscous the longer the shearing persists. Blood is a well-known shear-thinning fluid.
Measurement of viscosity
Viscometers are used to obtain a measurement for the coefficient of viscosity. The simplest form of viscometer allows fluid to flow under the influence of gravity down a fine-bore calibrated tube. The rate of fall of the fluid meniscus is detected by photocells from which the viscosity can be calculated.
A more complicated device uses the viscous drag created by spinning a small drum containing a sample of fluid. A pointer is mounted on a float suspended in the sample and is displaced by the torque due to the viscous drag. This records the viscosity measurement on a scale.
Viscosity and the damping of fluid flow
The viscous shearing action in a fluid flow dissipates energy as heat and is analogous to frictional effects between two solid surfaces rubbing against each other. This dissipative effect dampens the motion of fluid in a system, and thus viscous effects form a major component of damping in any hydrodynamic system. As with mechanical or electrical systems, damping is an important factor in determining the behaviour of the system.
Viscous effects can also affect the pattern of flow, since fluid flow can occur with two different basic patterns, laminar flow and turbulent flow. Laminar flow is smooth and streamlined while turbulent flow is rough, containing eddies of swirling fluid which disrupt the flow and create greater drag. The characteristics of these flow patterns are discussed in more detail below.
Flow through tubes
When a pressure difference is applied across the ends of a tube, fluid will flow from the high pressure to the low pressure. An analogy can be drawn with an electrical circuit. Fluid flow (electrical current) occurs along the tube (conductor) because of the driving pressure difference (voltage), and energy is dissipated by the viscous drag (shear stress) between the fluid and the tube (electrical resistance).
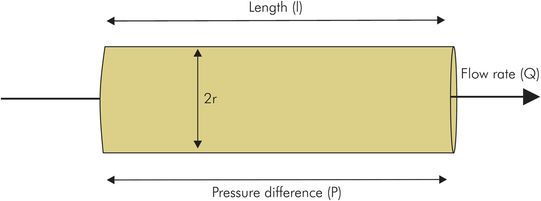
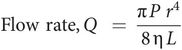
Hagen–Poiseuille law
Hagen (in 1839) and Poiseuille (in 1840) discovered the laws governing laminar flow through a tube. Consider a pressure P applied across the ends of a tube of length L and radius r (Figure 44.22). Then the flow rate, Q, produced is proportional to:
the pressure gradient (P/L)
the fourth power of the tube radius (r4)
the reciprocal of fluid viscosity (η–1)
This is often combined as the Hagen–Poiseuille equation and attributed to Poiseuille, a surgeon, who verified this relationship experimentally.
Hagen–Poiseuille law
Kinematic viscosity
As noted above, the viscosity of a fluid influences its flow pattern by creating a damping effect. However, the inertial properties of the fluid (dependent on fluid density) also affect the flow pattern. Thus the relative effects of inertial and viscous forces can determine the nature of fluid flow in any given situation. This is taken into account by using the kinematic viscosity (μ), which is defined as the ratio of the viscosity to the density (ρ):
If the kinematic viscosity is high, rapid irregular flow patterns in a fluid will be well damped, but if it is low then disturbances such as swirling eddies may persist for a long time.
Reynolds number and turbulence
The Reynolds number (Re) is used to determine whether the flow will be laminar or turbulent in any given situation. It includes the kinematic viscosity and the ratio of the inertial forces to the viscous damping forces in the fluid, and is given by:
Where v = the mean flow velocity for flow through a tube, or the velocity a long way from an object, and L = a characteristic length of the system, such as the diameter of a tube.
At low Reynolds numbers, the viscous forces dampen minor irregularities in the flow, resulting in a laminar pattern. A high Reynolds number means that the inertial forces dominate, and any eddies in the flow will be easily created and persist for a long time, creating turbulence. For flow though a tube, a Reynolds number of less than 2000 tends to give laminar flow, while between 2000 and 4000 the flow may be a mixture of laminar and turbulent depending on the smoothness of the fluid entering the tube. Above 4000, the flow will certainly be turbulent.
Velocity profiles for laminar and turbulent flow in a tube
If we looked at the velocities across a tube, the velocity profile, the shapes would be different for laminar and turbulent flow, as shown in Figure 44.23.
Laminar flow – Figure 44.23a shows the profile for laminar flow. This is much more pointed than the flat central portion of turbulent flow. The arrows are flow velocity vectors and are all parallel to the axis of the tube. There is a gradual decrease in flow velocity as the walls of the tube are approached. Laminar flow tends to occur when viscous effects predominate – i.e. with viscous fluids, in narrow tubes, or at low flow velocities.
Turbulent flow – If the flow velocity of the fluid in Figure 44.23a is increased, turbulent flow will be produced (Figure 44.23b). This contains irregular flow vectors and swirling eddies. The velocity vectors vary continuously in time, but a velocity profile (broken line) can still be drawn, by averaging the velocity vectors in time. In the turbulent case the velocity vectors are greater in magnitude but the profile is flatter across the centre of the tube. The velocity gradient at the walls is steeper because of an increased viscous drag associated with the turbulence. Flow resistance effects are relatively greater in turbulent flow than in laminar flow. Turbulence tends to occur at high flow velocities, when density (inertial) effects predominate – i.e. with thin dense fluids and in wide-bore (orifices) or irregular tubes.
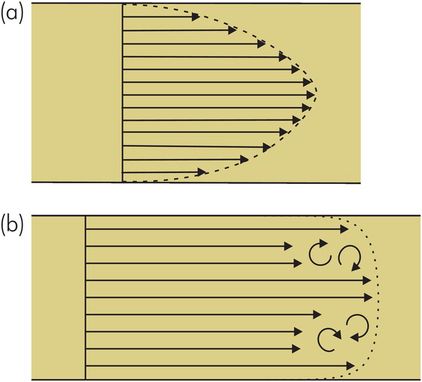
(a) Velocity profile in laminar flow; (b) velocity profile in turbulent flow
Transition between laminar flow and turbulence
When flow is slow it remains laminar, and both viscous drag and pressure drop along the tube increase in proportion with flow velocity. As flow velocity increases, there is an increased tendency for small eddies to disrupt the flow until at higher velocities the flow becomes turbulent. When flow is turbulent there is an abrupt change in the viscous forces, as reflected by an increased pressure drop along the tube. The slope of a graph plotting pressure drop against flow velocity becomes steeper at the laminar–turbulent transition. This transition is illustrated in Figure 44.24, and at this point the Reynolds number exceeds the threshold of approximately 2000.
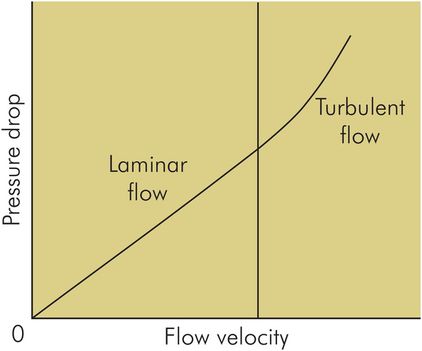
Velocity–pressure drop curve showing transition between laminar and turbulent flow
A mixture of laminar and turbulent gas flow patterns is found in the airways of the lung during normal breathing. Turbulent flow occurs in the trachea and main bronchi at peak flow rates during quiet breathing, while flow in the small airways remains laminar under virtually all conditions.
Effect of varying cross-section on flow velocity
In many situations flow occurs through tubes with a varying cross-sectional area, as illustrated in Figure 44.25. The fluid is assumed to be incompressible, an assumption which is clearly valid for liquids, and which under normal circumstances remains surprisingly valid for gases. The volume flow rate is the product of the area of the tube and the average flow velocity, and since no fluid leaves or enters the tube, the volume flow rate must be the same at point 1 as it is at point 2. This statement can be written as:
As the fluid moves from a larger cross-section (point 1), to a smaller cross-section (point 2), the velocity increases (from v1 to v2). Similarly, on moving from a smaller cross-section to a larger cross-section the velocity of flow will decrease.
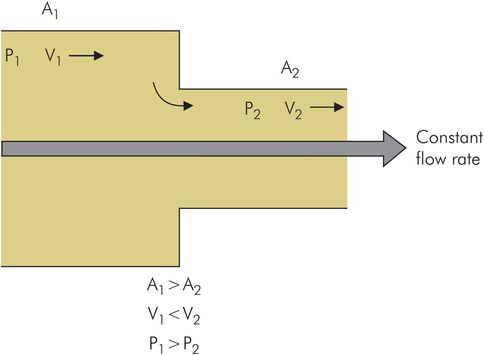
Constant volume rate flow through a tube with varying cross-section
Pressure and velocity: Bernoulli’s equation
The pressure in the fluid can be related to its flow velocity by considering the balance between potential and kinetic energy for the fluid. The fluid has potential energy due to the pressure driving it in the direction of flow, and kinetic energy because it is moving. Since it is moving faster at point 2 than at point 1, its kinetic energy at point 2 is higher. For a gain in kinetic energy to occur, some potential energy must have been lost, i.e. a pressure drop occurs between point 1 and point 2. Thus the increased velocity at point 2 is accompanied by a reduced pressure. The relationship between pressure (P), and velocity (v) at any point in a fluid is given by:
This equation applies to incompressible flow, assuming no change in potential energy due to gravity (i.e. flow does not occur uphill or downhill). This is a good approximation for gases, in which gravitational effects are usually negligible, or liquid flow in horizontal tubes.
Bernoulli’s equation shows that as the velocity of a fluid increases, the pressure falls, or alternatively if the pressure of a gas flow falls, it gains velocity. This is illustrated by the example of gas escaping from a cylinder at high pressure through a nozzle to the atmosphere. The gas in the cylinder acquires a high speed as it exits through the nozzle to atmospheric pressure. The potential energy initially contained in the gas, due to it being compressed, has been converted to kinetic energy as the pressure falls to atmospheric pressure.
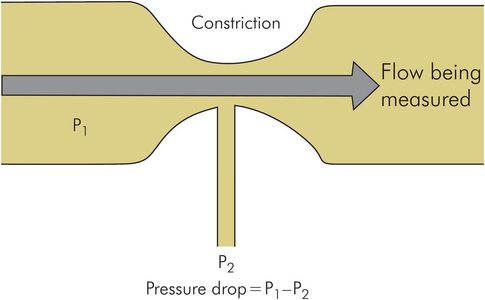
Venturi effect
The Venturi effect refers to the low pressure that is produced by a constriction in a duct with fluid flowing through it. As seen from the above discussion, this arises as a result of the Bernoulli principle. The Venturi effect is applied in devices such as the flow-driven nebuliser. The Venturi flow meter (Figure 44.26) also uses the Venturi effect to estimate flow velocity from the drop in pressure at a tube constriction. However, the pressure drop is not proportional to the flow velocity, and the device needs to be carefully calibrated.
Venturi flow meter
Injection of gas through a jet
The use of gas injected through a narrow jet or cannula occurs in jet ventilation, the use of the Sanders injector and some types of fixed-performance oxygen masks. In these devices high-pressure gas is injected through a small orifice into a duct or airway open to the atmosphere. The injected gas forms a high-velocity stream which drags surrounding air behind it (entrainment) due to the viscosity of the gases. This is often erroneously referred to as a ‘Venturi’ effect but can more accurately be attributed to viscous drag.
Electricity
Basic quantities and units
Definitions of charge, current, potential and potential difference together with their units are given below.
Electric charge
An electric charge may be positive or negative, and is produced by the accumulation of an excess or deficit of electrons in an object. Charge is measured in coulombs. Like charges tend to repel each other and opposite charges attract each other.
Definition of the coulomb
The coulomb is defined as an electric charge equal in magnitude to the charge possessed by 6.24 × 10¹⁸ electrons.
1 coulomb can also be defined from the unit of current (the ampere: see below) as that charge which passes any point in a circuit in a second, when a steady current of 1 ampere is flowing.
Electric current
Most useful electrical effects are produced by the movement of charge. Any movement of electric charge forms an electric current. The current flowing in a conductor can be measured as the number of coulombs passing any given point per second. The unit of current is the ampere (A or amp), where
Related posts:


Stay updated, free articles. Join our Telegram channel

Full access? Get Clinical Tree


