KEY POINTS
1. The total annual cost of cardiovascular disease in the U.S. is close to 400 billion representing 17% of the total health care costs due to major illness.
2. Risk factors for myocardial revascularization surgery include history of CHF, EF <30%, advanced age, obesity, emergency surgery, concomitant valve surgery, prior cardiac surgery, DM, and renal failure.
3. Supply of oxygen to the myocardium is determined by arterial oxygen content of blood and coronary blood flow.
4. A doubling of heart rate more than doubles the myocardial O2 demand. The reason is heart rate causes a concomitant small increase in contractility.
5. Elevated wall stress also increases myocardial O2 demand. This is related by the formula: Wall stress = pressure × Radius/(2 × wall thickness).
6. Regional wall motion abnormalities develop in less than 1 minute after the onset of ischemia: sooner than ECG evidence of ischemia.
7. Off-pump coronary bypass compared to conventional CABG shows no difference in mortality and quality of life variables. However, duration of ventilation, hospital stay, and morbidity are decreased with off-pump coronary bypass.
8. Multiple causes of myocardial ischemia can occur during the prebypass, bypass, and postbypass periods.
9. A brief period of myocardial ischemia may protect against the damage caused by subsequent prolonged ischemia and tissue reperfusion. This ischemic preconditioning has been demonstrated in both animal and human studies.

I. Introduction
A. Prevalence and economic impact of coronary artery disease. Although the death rate for coronary heart disease has declined over the last several decades, it is still the leading cause of death in the United States. In the United States, more than 16 million people have a history of angina pectoris, myocardial infarction, or both [1]. More than 400,000 coronary artery bypass graft (CABG) revascularization procedures are performed annually [1].
1
The economic consequence of coronary heart disease is enormous. It is estimated that the total annual cost of cardiovascular disease in the United States is close to $400 billion, which represents almost 17% of the total health-care costs due to major illnesses [2]. Additionally, coronary heart disease accounts for almost a fifth of all disability disbursements by the Social Security Administration [1].
B. Symptoms and progression of coronary artery disease. A complete description of angina pectoris and other symptoms related to coronary artery disease is given in Chapter 3. Unlike the usually predictable time course and progression of symptoms in patients with valvular heart disease, patients with coronary artery disease may have variable onset of symptoms as well as progression of disease characterized by discrete events such as angina or myocardial infarction. Many patients suffer ischemia without symptoms; these “silent” ischemic events require diligence for detection and prompt treatment before and after operation. Only 18% of myocardial infarctions are preceded by longstanding angina [1]. All aspects of preoperative evaluation of these patients (i.e., exercise stress testing and cardiac catheterization) are discussed in Chapter 3.
C. Historical perspective of CABG. Early unsuccessful or suboptimal attempts at myocardial revascularization took place before the 1960s. In 1967, Favalaro and Effler at the Cleveland Clinic began performing reversed saphenous vein bypass grafting procedures. In 1968, Green performed an anastomosis of the internal mammary artery (IMA) directly to a coronary artery. There was a resurgence of interest in the IMA grafting procedure in the late 1970s and early 1980s after a number of studies showed far greater graft patency rates for IMA grafts compared with saphenous vein grafts. In addition, better long-term survival was evident in patients receiving IMA grafts, regardless of ventricular function.
An interest in enhanced recovery (“fast track”) cardiac surgery, fueled perhaps by concern over resource utilization, led to recognized improvements in clinical outcome [3]. In select cases, the advent of new myocardial stabilization devices obviated the need for exposure to cardiopulmonary bypass for myocardial revascularization. In the 1990s, many centers experimented with minimally invasive revascularization techniques and transmyocardial revascularization. During this time, transesophageal echocardiography (TEE) established an increasing role during coronary revascularization.
The extent of physiological derangement of patients presenting for cardiac surgery continues to increase, due to an aging patient population, increasing frequency of reoperations, and application of multivessel angioplasty and intracoronary stents to those with lesser degrees of disease.
D. Evaluating risk of morbidity and mortality for CABG surgery
1. Introduction. A comprehensive review of the myriad risk stratification schema for CABG surgery is beyond the scope of this text; however, a brief discussion of some of the more popular risk stratification tools follows.
2
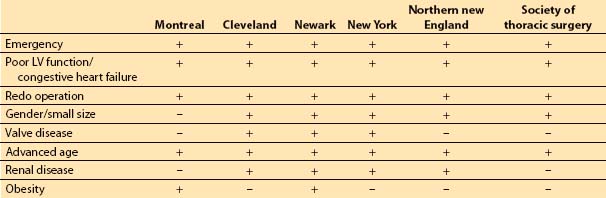
2. Risk factor models. Although risk stratification tools may differ in the specific weights assigned to certain risk factors and not all of the risk factors appear in every study, certain factors appear associated with increased risk of morbidity and mortality. These factors include poor left ventricular (LV) function (history of congestive heart failure or LV ejection fraction less than 30%), advanced age, obesity, emergency surgery, concomitant valve surgery, prior cardiac surgery, history of diabetes, and history of renal failure [4,5].
The composite score of the individually weighted risk factors is associated with a certain predicted risk of short- and long-term morbidity and mortality, length of stay, and hospital costs. Table 11.1 presents several risk stratification tools.
Table 11.1 Risk factor inclusion in various risk stratification models for coronary artery bypass grafting
3. Model evaluation. No model can completely capture the risk of caring for sicker patients. The ACC/AHA assigns a level IIa recommendation (level of evidence C) to the use of models for prediction of morbidity and mortality [6]. Some models do not allow for adequate flexibility with regard to the dynamic nature of the patient’s physiology during the preoperative period. For example, a patient’s LV ejection fraction at the time of cardiac catheterization will be used in the evaluation process instead of that derived from TEE at the time of surgery.
II. Myocardial oxygen supply
A. Introduction. The viability and function of the heart depend upon the relatively delicate balance of oxygen supply and demand. The cardiac anesthesiologist must understand the intricacies of this relationship so as to manipulate their determinants perioperatively. The myocardium maximally extracts O2 from arterial blood at rest: Coronary sinus blood PO2 is 27 mm Hg and its saturation is less than 50%. With exertion or hemodynamic stress, the only way the O2 supply can increase acutely to meet the myocardial energy demand is by increasing coronary blood flow (CBF). Ischemia occurs when CBF does not increase to a level sufficient to meet myocardial demand, leading to anaerobic metabolism. The following approach achieves the clinical goal of ensuring that O2 supply at least matches demand:
1. Optimize the determinants of myocardial O2 supply and demand
2. Select anesthetics and adjuvant agents and techniques according to their effects on O2 supply and demand
3. Monitor for ischemia to detect its occurrence early and intervene rapidly
B. Coronary anatomy
1. Left main coronary artery. A thorough understanding of the coronary artery anatomy and the distribution of myocardial blood flow allows an understanding of the extent and degree of myocardium at risk for ischemia and infarction during surgery. The blood supply to the myocardium derives from the aorta through two main coronary arteries (see Fig. 11.2), the left and right coronary arteries. The left main coronary artery extends for a short distance (0 to 40 mm) before dividing between the aorta and the pulmonary artery into the left anterior descending artery and the circumflex coronary artery.
2. Left anterior descending coronary artery. The left anterior descending artery begins as a continuation of the left main coronary artery and courses down the interventricular groove, giving rise to the diagonal and septal branches. The septal branches vary in number and size, and provide the predominant blood supply to the interventricular septum. The septal branches also supply the bundle branches and the Purkinje system. One to three diagonal branches of variable size distribute blood to the anterolateral aspect of the heart. The left anterior descending artery usually terminates at the apex of the LV.
3. Circumflex coronary artery. The circumflex artery courses the left atrioventricular groove giving rise to one to three obtuse marginal branches, which supply the lateral wall of the LV. In 15% of the patients, the circumflex artery gives rise to the posterior descending coronary artery (“left dominant”). In 45% of the patients, the sinus node artery arises from the circumflex distribution.
4. Right coronary artery. The right coronary artery traverses the right atrioventricular groove. It gives rise to acute marginal branches that supply the right anterior wall of the right ventricle (RV). In approximately 85% of the individuals with a right dominant system, the right coronary artery gives rise to the posterior descending artery to supply the posterior inferior aspect of the LV. Thus, in the majority of the population, the right coronary artery supplies a significant portion of blood flow to the LV, while in the other 15% of the population, the posterior-inferior aspect of the LV is supplied by the circumflex coronary artery (left dominant system) or both right coronary and circumflex arteries (codominant system). The sinus node artery arises from the right coronary artery in 55% of patients. The atrioventricular node artery derives from the dominant coronary artery and is responsible for blood supply to the node, the bundle of His, and the proximal part of the bundle branches.
3
C. Determinants of myocardial oxygen supply. In broad terms, the supply of oxygen to the myocardium is determined by the arterial oxygen content of the blood and the blood flow in the coronary arteries.
1. O2 content = (hemoglobin) (1.34) (% saturation) + (0.003) (Po2)
Ensuring maximal O2 content therefore involves having a high hemoglobin level, highly saturated blood, and a high PO2. Normothermia, normal pH, and high levels of 2,3-diphosphoglyceric acid all favor tissue release of O2.
2. Determinants of blood flow in normal coronary arteries. CBF varies directly with the pressure differential across the coronary bed (coronary perfusion pressure [CPP]) and inversely with coronary vascular resistance (CVR): CBF = CPP/CVR. However, CBF is autoregulated (i.e., resistance varying directly with perfusion pressure) so that flow is relatively independent of CPP between 50 and 150 mm Hg but is pressure dependent outside of this range. Metabolic, autonomic, hormonal, and anatomic parameters alter CVR, and hydraulic factors influence CPP. Coronary stenoses also increase CVR.
a. Control of CVR. Factors affecting CVR are outlined in Table 11.2.
Table 11.2 Control of coronary vascular resistance
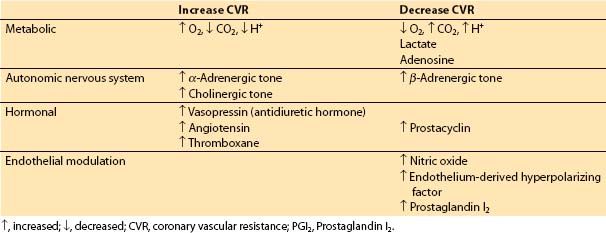
(1) Metabolic factors. When increased coronary flow is required secondary to increased myocardial workload, metabolic control factors are primarily responsible. Hydrogen ion, CO2, lactate, and adenosine all may play a role in metabolic regulation of CBF by inducing changes in CVR [7].
(2) Autonomic nervous system. The coronary arteries and arterioles possess α– and β-receptors. In general, α1-receptors are responsible for coronary vasoconstriction, whereas β-receptors mediate a vasodilatory effect. α2-Receptors on endothelial cells and muscarinic signaling appear to be involved in a nitric oxide-mediated decrease in coronary vascular tone [8]. An increased population of α-receptors may cause episodes of coronary spasm in individuals with nonobstructed coronaries. α1-Mediated constriction of the coronary circulation may counter some of the metabolic vasodilation, especially in the resting basal state. However, under most circumstances such as increasing demand or ischemia, metabolic control factors will over-ride α-mediated vasoconstriction.
(3) Hormonal factors. Two stress hormones, vasopressin (antidiuretic hormone) and angiotensin, are potent coronary vasoconstrictors. However, blood levels of these hormones during major stress may be insufficient to produce significant coronary vasoconstriction. Thromboxane participates in thrombosis and coronary vasospasm during myocardial infarction. Prostaglandin I2 (PGI2) decreases coronary vascular tone.
(4) Endothelial modulation. Nitric oxide triggers a cyclic guanosine monophosphate (c-GMP)–mediated vasodilatory effect on vascular smooth muscle, and may also contribute to vessel patency and blood flow by inhibiting platelet adhesion. PGI2 and endothelium-derived hyperpolarizing factor also cause relaxation of vascular smooth muscle.
(5) Anatomic factors
(a) Capillary/myocyte ratio. Only three- to four-fifths of available myocardial capillaries function during normal conditions. During exercise, episodes of hypoxia, or extreme myocardial O2 demand, the additional unopened capillaries are recruited and increase blood flow, causing a decrease in CVR and in diffusion distance of O2 to a given myocyte. This adaptation, along with coronary vasodilation, contributes to coronary vascular reserve.
(b) Coronary collaterals. Coronary collateral channels exist in the human myocardium. Under most circumstances, they are nonfunctional. However, in the presence of impeded CBF, these coronary channels may enlarge over time and become functional.
(6) Other factors affecting CVR. CVR may be partly regulated by myogenic control of vessel diameter, which dynamically responds to the distending pressure inside the vessel. CVR increases with the increased blood viscosity caused by high hematocrit or hypothermia. Thus, hemodilution should accompany induced hypothermia. There is a transmural gradient of vascular tone, with vascular resistance being lower in the subendocardium than in the subepicardium [7].
b. Hydraulic factors and subendocardial blood flow
(1) LV subendocardial blood flow. Unlike CBF in the low-pressure RV system, LV subendocardial blood flow is intermittent and occurs only during diastole. Because of the increased intracavitary pressure and excessive subendocardial myocyte shortening, subendocardial arterioles are essentially closed during systole. Of the total LV coronary flow, 85% occurs during diastole and 15% occurs in systole (primarily in the epicardial region). Thus, the majority of blood flow to the epicardial and middle layers of the LV and all the blood flow to the endocardium occur during diastole.
(2) CPP. Equals the arterial driving pressure less the back-pressure to flow across the coronary bed. For the LV, the driving pressure is the aortic blood pressure during diastole. The back-pressure to flow depends on the area of myocardium under consideration. Because the endocardium is the area most prone to ischemia, attention focuses on its flow, and thus the usual formula for CPP uses left ventricular end-diastolic pressure (LVEDP) as back-pressure instead of right atrial pressure, despite the fact that most blood returns to the heart via the coronary sinus:
CPP = aortic diastolic pressure – LVEDP
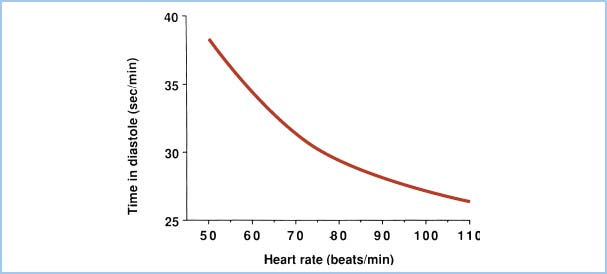
Because diastole shortens relative to systole as heart rate increases, subendocardial blood flow is decreased at extremely rapid heart rates. Figure 11.1 demonstrates the total time per minute spent in diastole as a function of heart rate. Elevations in LVEDP (e.g., heart failure, ischemia) also will impede subendocardial blood flow. Thus, to optimize CPP, one should aim for normal-to-high diastolic blood pressure, low LVEDP, and low heart rate.
Figure 11.1 Total time spent in diastole each minute is plotted as a function of heart rate in beats per minute (beats/min). The reduction in diastolic interval leads to diminished LV blood flow as heart rate increases.
3. Determinants of myocardial blood flow in stenotic coronaries. In addition to the physiologic determinants of myocardial blood flow in normal coronary arteries, stenotic vessels add pathologic determinants of myocardial blood flow. Stenoses increase CVR and decrease CBF. Reduction in CBF in stenotic vessels is a function of the length and degree of stenosis, presence or absence of collaterals, pattern of stenosis, and presence of certain coexisting disease states, such as diabetes mellitus and hypertension, which cause predisposition to microcirculatory pathology and ventricular hypertrophy, respectively.
In particular, some patients present with a vasospastic component, which may aggravate a fixed lesion or even create anginal symptoms in patients with angiographically clear vessels.
a. Poiseuille’s law determines the hemodynamic significance of a coronary obstruction in long (segmental) lesions. Given the same decrease in cross-sectional area, a longer segmental stenosis of a coronary artery reduces flow more than a short one.
b. Because CBF is reduced in proportion to the fourth power of the vessel diameter, a 50% diameter decrease in lumen size decreases flow to 1/16th its initial value, which is hemodynamically consistent with symptoms of angina on exertion. A 75% reduction in diameter at angiography corresponds to a greater than 98% reduction in flow, and corresponds clinically to symptoms of angina at rest.
c. Sequential lesions in the same coronary artery impact coronary flow in an additive fashion.
d. With longstanding coronary obstruction, collateral circulation often develops. For low-grade obstructive lesions, these channels supply enough blood flow to prevent ischemia. However, as the degree of coronary stenosis increases, the collateral channels may not be adequate.
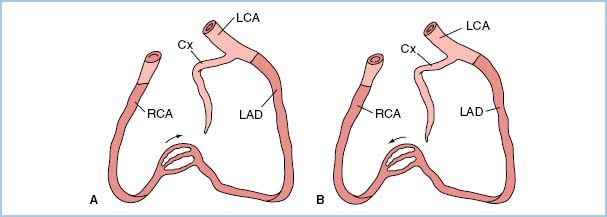
e. Certain patterns of stenoses have important clinical implications related to the amount of myocardium supplied and placed in jeopardy by the stenotic lesion(s). A left main coronary stenosis limits blood flow to a large amount of the LV muscle mass. High-grade, very proximal stenotic lesions of both the circumflex and left anterior descending systems have the same physiologic implications as does a left main stenosis. Prognostically, however, a left main stenosis is grimmer because rupture of a single atheroma will compromise a large amount of myocardium. In addition, similar “left main equivalent” situations may exist when a severely stenosed coronary provides collateral blood flow to a region with a totally occluded vessel (Fig. 11.2). In addition to discrete focal and segmental coronary lesions in graftable vessels, diffuse distal disease may lessen the effectiveness of bypassing proximal coronary obstructions.
Figure 11.2 Two examples of possible left main “equivalency.” Two-vessel coronary disease with an occluded left anterior descending coronary artery (LAD) and myocardium jeopardized by a right coronary artery (RCA) stenosis (A) or an occluded RCA and myocardium jeopardized by a stenotic LAD (B). Cx, circumflex coronary artery; LCA, left coronary artery. (From Hutter AM Jr. Is there a left main equivalent? Circulation. 1980;62:209, with permission.)
III. Myocardial oxygen demand.
Direct measurement of myocardial oxygen demand is not feasible in the clinical setting. The three major determinants of myocardial O2 demand are heart rate, contractility, and wall stress.
A. Heart rate. If a relatively fixed amount of O2 were consumed per heartbeat, one would expect the O2 demand per minute to increase linearly with heart rate. Thus, a doubling of heart rate would yield a doubling of O2 demand. In fact, demand more than doubles with a two-fold increase in heart rate. The source of this additional O2 demand is the staircase phenomenon, in which increased heart rate causes a small increase in contractility and increases in contractility mean more consumption of O2 (see Section B below).
4
B. Contractility. More O2 is used by a highly contractile heart compared to a more relaxed heart.
1. Quantitative assessment. Strictly defined, the contractile state of the heart is a dynamic intrinsic characteristic that is not influenced by preload or afterload. Previous attempts to measure contractility using physiologic variable include the rate of rise of LV pressure, (dP/dt), and its value normalized to chamber pressure, ([dP/dt]/P). Neither succeeds. Clinically, it is possible to quantify dP/dt echocardiographically by measuring the rate of rise in the velocity of the mitral regurgitant jet using Doppler technology. Unfortunately, loading conditions and chamber compliance significantly affect the acceleration of the mitral regurgitant jet. Additionally, although mitral regurgitation is frequently observed echocardiographically, it is not universally present. Contractility can be approximated in a load-independent fashion using the slope of the end-systolic pressure–volume relationships of a family of LV pressure–volume loops. This method is usually not available in clinical settings.
2. Qualitative measures. One can easily observe the contractile state of the heart when the pericardium is open. Remember, though, that the RV is more easily and most often viewed this way, whereas the left is more obscured. TEE provides a means for qualitative estimation of LV contractility. Clinically, we infer good contractility when the arterial pressure tracing rises briskly. However, the shape of the radial arterial tracing is heavily influenced by the system’s resonant frequency, damping by air bubbles, compliance of the arterial tree, reflections of pressure waves from arterioles, and other confounders.
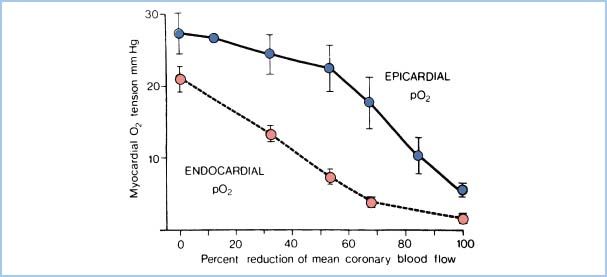
3. Increased subendocardial myocyte shortening. Myocytes in the subendocardial region undergo more shortening than those in other areas because of geometric factors. Because they operate at a higher contractile state, they have greater oxidative metabolism. Subendocardial vessels, already maximally dilated, cannot respond to increased demand and intermittent limitations of blood flow in the subendocardial region. Thus, myocardial O2 tension falls first here (Fig. 11.3), and this region is more susceptible to ischemia.
Figure 11.3 Relationship of subendocardial O2 supply (represented by myocardial O2 tension) to reductions in CBF. Demonstrated is the increased vulnerability of the subendocardial zone compared to the epicardial zone. (Modified from Winbury MM, Howe BB. Stenosis: regional myocardial ischemia and reserve. In: Winbury MM, Abiko Y, eds. Ischemic Myocardium and Antianginal Drugs. New York, NY: Raven; 1979:59.)
5
C. Wall stress. The stress in the ventricular wall depends on the pressure in the ventricle during contraction (afterload), the chamber size (preload), and the wall thickness. The calculation for a sphere (which we shall assume for the shape of the ventricle, for the sake of simplicity) comes from LaPlace’s Law:
Wall stress = pressure . radius/(2 . wall thickness)
1. Chamber pressure. Oxygen demand increases with chamber pressure. Doubling the pressure doubles the O2 demand. Systemic blood pressure usually reflects the chamber pressure; thus, we equate systemic blood pressure with LV afterload. The heart’s true afterload is more complex because elastic and inertial components also affect ejection. Mean systemic pressure, not peak systolic pressure, correlates with O2 demand. In aortic stenosis, however, the LV experiences very high chamber pressures despite more modest systemic pressures. The clinical goal is to keep afterload (and thus wall stress) low.
2. Chamber size. Doubling the ventricular volume increases the radius by only 26% (volume varies with the radius cubed). Thus, increased chamber size is associated with more modest increases in O2 demand. Nevertheless, because preload determines ventricular size, we desire a low preload to keep wall stress (and thus O2 demand) low. Much of the benefit of nitroglycerin stems from venodilation and its attendant decrease in preload.
3. Wall thickness. A thicker wall means less stress over any part of the wall. Ventricular hypertrophy serves to decrease wall stress, although the additional tissue requires more O2 overall. Hypertrophy occurs in response to the elevated afterload that occurs in chronic systemic hypertension or aortic stenosis. Although wall thickness is essentially uncontrollable clinically, its effects should be considered. LV aneurysms, seen after transmural infarction, increase wall stress because of their effect on LV volume (radius) and reduced wall thickness.
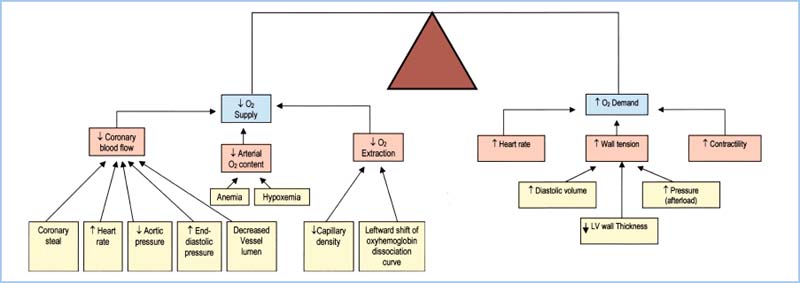
D. Summary. The factors that increase O2 demand are increases in heart rate, chamber size, chamber pressure, and contractility. Table 11.3 and Figure 11.4 summarize the relationship between myocardial supply and demand. Note that tachycardia and increases in LVEDP both lead to increased demand and decreased supply of oxygen.
Table 11.3 Regulation of O2 supply and demand
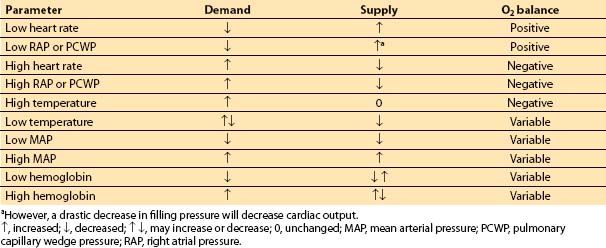
Figure 11.4 Summary of factors that affect myocardial oxygen supply and demand. (Adapted from Crystal GJ. Cardiovascular physiology. In: Miller RD, ed. Atlas of Anesthesia: Vol. VIII. Cardiothoracic Anesthesia. Philadelphia, PA: Churchill Livingstone; 1999;1:1, with permission.)
IV. Monitoring for myocardial ischemia
A. Introduction. Monitoring for cardiac surgery is discussed in Chapter 4. Typical monitoring for CABG surgery includes the standard American Society of Anesthesiology (ASA) monitors and invasive arterial blood pressure monitoring. Although TEE is used more frequently in current practice, the most recent ASA/SCA practice guidelines uphold guidelines published in 1996 classifying use in patients with increased risk for myocardial infarction as a category II indication [9]. The use of pulmonary arterial (PA) catheters for routine CABG is also controversial. Detection and treatment of intraoperative ischemia are critically important because intraoperative ischemia is an independent predictor of postoperative myocardial infarction [10]. Only half of the intraoperative ischemic events can be related to a hemodynamic alteration and none can be detected by the presence of angina in anesthetized patients. Lactate extraction of a regional myocardial circulatory bed, while diagnostic of ischemia, cannot be routinely measured. Thus, we seek clues that ischemia leaves in its wake: Changes on the electrocardiogram (ECG), PA pressure (PAP) changes, and myocardial wall-motion abnormalities.
B. ECG monitoring
1. Introduction. The detection of wall-motion abnormalities by TEE has not led to the replacement of continuous multilead ECG monitoring as a standard monitor of intraoperative ischemia. ECG monitoring is inexpensive, easy to use and read, can be automated, and is available before and during the induction of anesthesia, when the TEE probe is not in place, and may be carried through to the ICU setting, where TEE monitoring is impractical. ECG changes are less sensitive to ischemia: They occur later in the temporal cascade of events that follow myocardial ischemia, especially with less dramatic coronary supply/demand inequality.
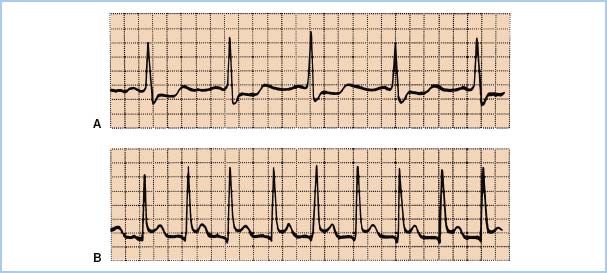
2. ST-segment analysis. Depression of the ST segment of the ECG denotes endocardial ischemia and elevation denotes transmural ischemia. ST-segment changes occur at least 60 to 120 s after the start of ischemia. The reference for the ST segment is usually taken as 80 ms after the J-point, which is the end of the QRS wave (Fig. 11.5). Significant changes are usually defined as 0.1 mV or 1 mm of ST-segment elevation or depression at normal gain. ECG monitoring systems include automated real-time ST-segment analysis. Although this feature constitutes a definite advance in the “human engineering” aspects of ischemia monitoring, the machine is only as smart as the person interpreting its data. Beware of intraventricular conduction delays, bundle branch blocks, and ventricular pacing, all of which can render ST-segment analysis invalid. Check the machine’s determination of where the ST segment occurs: 80 ms after the J-point is not always appropriate.
Figure 11.5 A: ST-segment depression, an indicator of subendocardial ischemia. B: Transmural ischemia, one cause of ST-segment elevation, produces the pattern appearing in the lower tracing.
a. Differential diagnosis of ST-segment changes. ST-segment elevation may arise from the several causes of transmural ischemia (atherosclerotic disease, coronary vasospasm, intracoronary air), or from pericarditis or ventricular aneurysm (Fig. 11.5). One must also consider improper lead placement, particularly reversal of limb and leg leads, and improper selection of electronic filtering. The diagnostic mode should always be chosen on machines equipped with a diagnostic–monitor mode selection switch.
3. T-wave changes. New T-wave alterations (flipped or flattened) may indicate ischemia. These may not be detected by viewing the ST segment alone. Likewise, pseudonormalization of the ST segment or T wave (an ischemic-looking tracing in a patient without ischemia changing to a more normal-looking one) may indicate a new onset of ischemia and should be treated appropriately.
4. Multilead ECG monitoring. Simultaneous observation of an inferior lead (II, III, or aVF) and an anterior lead (V5) provides detection superior to single-lead monitoring, detecting approximately 90% of ischemic events. Ischemia limited to the posterior of the heart is difficult to detect with standard ECG monitoring. Modified chest leads may be necessary when the surgical incision precludes usual placement.
C. PAP monitoring
1. General indications for a PA catheter for revascularization procedures. PA catheters provide a conduit for infusions, measurement of blood temperature and chamber pressures, and calculations of cardiac output, vascular resistance, and RV ejection fraction (with special catheters equipped with particularly fast thermistors). Some catheters also measure mixed venous oxygen saturation. Observational studies concluding that PA catheterization does not affect outcome [11,12] remain unconvincing until randomized studies provide validation. Although perhaps unnecessary for the intraoperative management of routine coronary bypass surgery, PA catheters achieve utility postoperatively, when TEE cannot be utilized.
2. Detection of ischemia: PAPs. The absolute PAP is not diagnostic of ischemia. Pulmonary hypertension, whether primary or secondary to chronic ischemia, hypertension, or to valvular heart disease, is not uncommon. PAPs or pulmonary capillary occlusion pressures commonly exceed upper levels of normal due to chronic obstructive pulmonary disease (COPD), dependent catheter locations in the lung, or mitral stenosis, making measurement less reliable in the absence of ischemia [13]. The shape of the transduced pressure waveform, however, is more predictive. Appearance of a new V wave on the pulmonary capillary occlusion pressure waveform indicates functional mitral regurgitation, which is due to “new” ischemic papillary muscle dysfunction. It may occur before or even in the absence of ECG changes. However, detection of changes on the pulmonary capillary occlusion waveform requires frequent balloon inflation, introducing additional risk because of the possibility of vessel rupture. Often ischemia may be detected by a change in the shape of the PA tracing, obviating the need for frequent wedging.
D. TEE
1. General indications for TEE during revascularization procedures. TEE can assess ventricular preload and contractility, detect myocardial ischemia-induced regional wall-motion abnormalities (RWMAs), evaluate the aortic cannulation site, detect concomitant valve pathology, detect the presence and pathophysiologic effect of pericardial effusion, aid the placement of intra-aortic balloon catheters and coronary sinus catheters, and detect the presence of ventricular aneurysms and ventricular septal defects. TEE has become an invaluable clinical tool and has achieved routine use at many institutions. New RWMAs after bypass correlate with adverse outcomes. See Chapter 5 for a detailed discussion of intraoperative TEE.
2. Detection of myocardial ischemia with TEE
5
a. RWMAs
(1) Introduction. The heart develops abnormal motion in less than 1 min following perfusion defects [14]. RWMAs resulting from myocardial ischemia temporally precede both ECG and PAP changes. TEE simultaneously interrogates regions of the heart representative of all three major coronary arteries, including the posterior wall, which are not easily monitored with ECG. This is, perhaps, most easily accomplished in the short-axis, midpapillary muscle view. Ischemia confined to nonvisualized regions will escape detection. Proper interrogation of the heart requires a comprehensive examination in multiple planes.
(2) Limitations of monitoring RWMA
(a) Tethering. Nonischemic tissue that is adjacent to ischemic tissue may move abnormally simply because it is attached to tissue exhibiting an RWMA. This tends to exaggerate the RWMA.
(b) Pacing/bundle branch blocks. Abnormal ventricular depolarization sequences not only affect ST-segment analysis (see Section IV.B.2), but also alter wall motion and can mimic RWMA.
(c) Interventricular septum. Normal septal motion depends on appropriate ventricular loading conditions, the presence of pericardium, and normal electrical conduction.
(d) Stunned myocardium. Adequately perfused myocardium may exhibit RWMA if recovering from recent ischemia, thus prompting inappropriate therapeutic intervention.
(e) Induction/ICU. TEE use is not practical during induction of anesthesia or for continuous ICU monitoring.
b. Diastolic LV filling patterns. Unfortunately, ventricular filling patterns depend on ventricular loading conditions and the site of Doppler interrogation within the ventricular inflow tract, limiting utility to monitor ischemia.
c. Intraoperative stress TEE. Low-dose dobutamine (2.5 μg/kg/min), when administered for 3 to 5 min, improves coronary flow without significantly affecting demand. The resultant improved myocardial energetics improves existing wall-motion abnormalities. Demonstration of contractile reserve using intraoperative stress echo then directs revascularization efforts to regions of myocardium able to benefit from the additional blood supply.
d. Contrast echocardiography. Intracoronary injection of sonicated albumin allows imaging of perfused myocardium, providing a tool to identify stunned myocardium, thus avoiding needless therapeutic intervention. At present, contrast agents are not approved by the U.S. Food and Drug Administration for this indication. Additionally, there are some technical imaging issues that must be resolved before this technique can become a real clinical tool. A microbubble contrast injection technique has also been described [15].
e. Detection of infarction complications. TEE can detect complications of ischemia/infarction such as acute mitral insufficiency, ventricular septal defect, and pericardial effusion.
V. Anesthetic effects on myocardial oxygen supply and demand.
Outcome studies in cardiac surgery fail to reveal an effect of particular anesthetic agents [16,17]. Cardiac anesthesiologists, keenly aware of the impact of anesthetic agents on myocardial oxygen supply/demand dynamics, effectively monitor for and treat myocardial ischemia, thus accommodating for any such effects.
A. Intravenous (IV) nonopioid agents
1. Thiopental and thiamylal. Induction doses of ultrashort-acting barbiturates decrease systemic vascular resistance (SVR) and cardiac contractility and increase heart rate. Oxygen demand decreases from the first two effects and increases from the third. All three decrease oxygen supply. The net effect on myocardial O2 balance depends on the initial conditions. The hyperdynamic, hypertensive patient benefits from the restoration of more physiologic blood pressure and contractility, whereas a patient with a normal heart rate may respond to the resultant tachycardia with ischemia.
2. Propofol. The cardiovascular effects of induction doses of propofol are similar to those of the thiobarbiturates: Systemic blood pressure, SVR, and cardiac contractility decrease. Heart rate may increase less with propofol compared to thiopental.
3. Ketamine. Ketamine increases sympathetic tone, leading to increases in SVR, filling pressures, contractility, and heart rate. Myocardial O2 demand strongly increases, whereas O2 supply only slightly augments, thus producing ischemia. However, the patient already maximally sympathetically stimulated responds with decreased contractility and vasodilation. Ketamine is not recommended for routine use in patients with ischemic heart disease. However, it is sometimes used in patients with cardiac tamponade, because of its ability to preserve heart rate, contractility, and SVR; see Chapter 18.
4. Etomidate. Induction doses of etomidate (0.2 to 0.3 mg/kg) do not alter heart rate or cardiac output, although mild peripheral vasodilation may lower blood pressure slightly. As such, it is an ideal drug for rapid induction of anesthesia in patients with ischemic heart disease. Etomidate offers little protection from the increases in heart rate and blood pressure that accompany intubation. It is usually necessary to supplement etomidate with other agents (e.g., opioids, benzodiazepines, volatile agents, β-blockers, and nitroglycerin) in order to control the hemodynamic profile and prevent myocardial oxygen supply/demand imbalance. An induction dose blocks adrenal steroidogenesis for 6 to 8 h.
5. Benzodiazepines. Midazolam (0.2 mg/kg) or diazepam (0.5 mg/kg) may be used to induce anesthesia. Although both agents are compatible with the goal of maintaining hemodynamic stability, blood pressure may decrease more with midazolam because of more potent peripheral vasodilation. Negative inotropic effects are inconsequential. Blood pressure and filling pressures decrease with induction, whereas the heart rate remains essentially unchanged. Addition of induction doses of a benzodiazepine to a moderate-dose opioid technique, however, may result in profound peripheral vasodilation and hypotension.
6. a2-Adrenergic agonists. Centrally acting α2-adrenergic agonists result in a reduction in stress-mediated neurohumoral responses and therefore are associated with decreases in heart rate and blood pressure [18]. These agents are typically used during maintenance of anesthesia or postoperatively. Preoperative oral clonidine reduces perioperative myocardial ischemia in patients undergoing CABG surgery, but occasionally results in significant intraoperative hypotension. Dexmedetomidine possesses greater α2 selectivity than clonidine. Both agents have sedative and antinociceptive properties. Use of α2-adrenergic agonists is associated with a reduced opioid requirement. Additionally, α2-adrenergic agonists do not result in respiratory depression.
B. Volatile agents. In general, volatile anesthetics decrease both O2 supply and demand. The net effect on the myocardial supply/demand balance depends upon the hemodynamic profile that prevails at the time of administration.
1. Heart rate. Sevoflurane has negligible effect on heart rate. Desflurane and isoflurane often increase heart rate, although isoflurane decreases heart rate if its associated decrease in SVR is not profound, if the carotid baroreceptor function is impaired, or if the patient is fully β-blocked. In the steady state, the cardiovascular actions of desflurane are similar to those of isoflurane. However, during induction without opioids, heart rate and systemic and PA blood pressures may increase and require therapeutic intervention.
Desflurane use for inhalation induction is unwise due to a significant increase in heart rate, particularly with rapid escalation of the inspired concentration. Junctional rhythms may occur with any volatile agent; they deprive the heart of an atrial kick, leading to decreased stroke volume, cardiac output, and CBF, offsetting the salubrious effects of low heart rate.
2. Contractility. All volatile anesthetics decrease contractility, lowering O2 demand. However, isoflurane, desflurane, and sevoflurane cause less depression than halothane or enflurane. In decompensated hearts, all volatile anesthetics impair ventricular function.
3. Afterload. Decreases in cardiac output and SVR with volatile anesthesia result in decreased systemic blood pressure. Venodilation and blunted contractility account for the decrease in cardiac output. SVR decreases most with isoflurane and desflurane, moderately with enflurane and sevoflurane, but not at all with halothane administration. Both O2 supply and O2 demand decrease.
4. Preload. Volatile agents maintain filling pressures. Therefore, CPP (diastolic aortic pressure minus LVEDP) may decrease during volatile anesthesia.
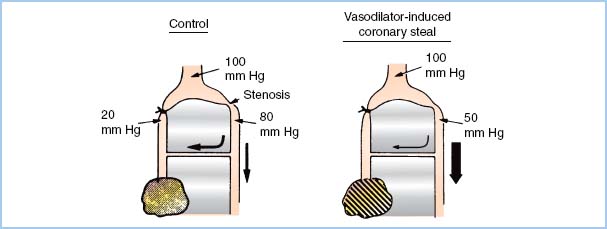
5. Coronary steal. A coronary “steal” phenomenon has been described in which dilation of normal vascular beds diverts blood away from other beds that are ischemic and thus maximally dilated (Fig. 11.6). Steal-prone anatomy may exist in 23% of the patients undergoing CABG [19]. Coronary steal has been observed in canine models of steal-prone coronary anatomy with isoflurane administration under circumstances that caused collateral flow which is pressure dependent. It is doubtful that isoflurane-induced coronary steal is of significant clinical importance to patients undergoing coronary revascularization surgery as long as hypotension and consequent pressure-dependent coronary artery perfusion are avoided. Coronary steal has not been observed with halothane, enflurane, or desflurane.
Figure 11.6 Theoretical basis of coronary steal. The shaded, marginally ischemic area normally receives barely enough flow (left). A potent vasodilator improves flow to the normal myocardium but does not affect the already maximally dilated area in jeopardy. This process decreases flow through the collateral from the nonischemic bed. This further impoverishment of the marginally ischemic area produces frank ischemia (right). (Modified from Becker LC. Conditions for vasodilator-induced coronary steal in experimental myocardial ischemia. Circulation. 1978;57:1108.)
Related posts:
 Devices for Cardiac Support and Replacement
 Alternative Approaches to Cardiac Surgery with and without Cardiopulmonary Bypass
 Anesthetic Considerations for Patients with Pericardial Disease
 Anesthetic Management for Patients with Congenital Heart Disease: The Pediatric Population
 Anesthetic Management during Cardiopulmonary Bypass
 Anesthetic Management for Patients with Congenital Heart Disease: The Adult Population
Stay updated, free articles. Join our Telegram channel

Full access? Get Clinical Tree


