Acute Coronary Syndrome
Christopher Ross and Theresa Schwab
Acute coronary syndrome (ACS) is the leading cause of death and disability in developed nations and creates one of the largest economic burdens on the health care systems. More than 1 million deaths occur annually in the United States due to ACS, with many of these in patients younger than age 65 (1). Although millions of people are assessed for chest pain in emergency departments (EDs) in the United States each year, fewer than one-fourth are ultimately diagnosed with ACS. The case-fatality rate has dropped significantly owing to myriad factors, including societal education about risk factor modification, treatment of associated conditions such as diabetes and hypertension, current medical therapies, and the institution of reperfusion strategies. Despite aggressive workups and the use of several strategies for risk stratification, emergency physicians still discharge about 2% of patients with myocardial infarction (MI) (2), with an associated increase in short-term mortality. These patients tend to be younger, have atypical presentations, and have nondiagnostic electrocardiograph (ECG). Approximately 20% of all malpractice dollars are awarded to plaintiffs in cases involving ACS, and this fear often leads to altered decision making and an associated increase in testing and hospitalization in low-risk patients (3).
ACS encompasses three specific presentations of coronary artery disease (CAD): unstable angina (UA) pectoris, non-ST-segment elevation myocardial infarction (NSTEMI), and ST-segment elevation myocardial infarction (STEMI).
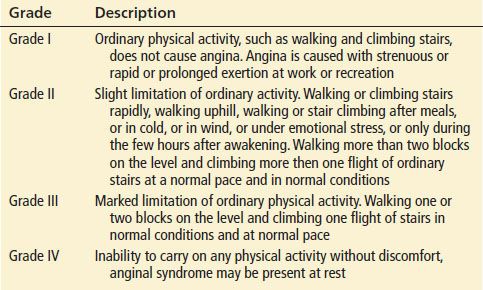
UA is defined by its clinical presentation, usually a change in class as defined by the Canadian Cardiovascular Society (Table 82.1 and 82.2). The distinction between UA and NSTEMI is based ultimately on the detection of markers of myocardial necrosis in the blood, so the two entities are indistinguishable at presentation, and their management is initially the same. Neither UA nor NSTEMI have characteristic historical, physical examination, or ECG findings. STEMI is defined by the electrocardiographic findings and the need for initiation of emergent reperfusion strategies. Each of these conditions is due to a lack of perfusion of the myocardium, which causes an imbalance between oxygen supply and demand. Atherosclerosis of the coronary arteries with occlusion of the vessel is the most common cause of myocardial ischemia. Regardless of the specific etiology, the beneficial effects of therapy are greatest when performed soon after presentation to the hospital.
TABLE 82.1
Canadian Cardiovascular Society Grading of Angina Pectoris
Patients with stable angina usually have a smooth-surfaced atherosclerotic plaque that permits sufficient coronary arterial flow at rest or minimal exercise to meet the metabolic demands of the myocardium. During physical exertion or other increases in metabolic demand, myocardial oxygen demand increases owing to elevation of both heart rate and blood pressure. Coronary perfusion cannot increase sufficiently to meet the augmented demands, and ischemia with classic symptoms of angina develops.
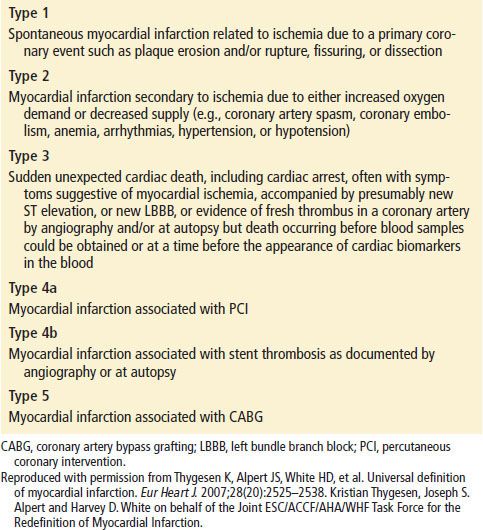
In contrast to stable angina, the pathologic substrate for ACS is a complex and irregular atherosclerotic plaque. Unstable plaques are prone to rupture, resulting in a cascade of inflammatory events, thrombus formation, and platelet aggregation that can cause acute obstruction of the arterial lumen and myocardial necrosis. Other etiologies of ACS include dynamic obstruction (coronary spasm such as in Prinzmetal’s variant angina) and progressive mechanical obstruction, such as re-stenosis after percutaneous coronary intervention (PCI). The definition of myocardial infarction (MI) requires evidence of myocardial necrosis in a clinical setting consistent with myocardial ischemia. Specific examples include (i) a rise and/or fall of cardiac biomarkers with at least one of the following: symptoms of ischemia, ECG changes, or imaging evidence of new loss of viable myocardium or of wall motion abnormality; (ii) sudden, unexpected cardiac death accompanied by symptoms of myocardial ischemia or ECG abnormalities or autopsy findings; (iii) PCI and coronary artery bypass grafting (CABG), giving rise to elevated cardiac biomarkers with or without ECG findings. MIs can be classified according to Table 82.3.
CLINICAL PRESENTATION
The history is the most sensitive test for the ED detection of ACS, far surpassing both ECG and measurement of cardiac markers. The hallmark of ACS is chest pain, typically located in the substernal region or epigastrium that frequently radiates to the neck, left shoulder, and left arm. All patients presenting with chest pain should therefore have a detailed history and should be asked for particulars on onset of pain (abrupt or gradual), quality of pain (squeezing, sharp, pleuritic, etc.), radiation (can be either left or right shoulder/arm, neck, back, etc.), site of the pain (substernal, diffuse or poorly localized, chest wall, etc.), provocation (with exertion, breathing or spontaneously, etc.), and timing (episodic or constant, duration of each episode, etc.). Anginal equivalents such as dyspnea, nausea, vomiting, and diaphoresis may also occur and compose up to 30% of presentations of ACS. These atypical symptoms are classically found in the elderly, in women, in non-Whites, or in those who have comorbid diseases such as diabetes, heart failure, prior stroke, or hypertension. Atypical presentations of ACS are associated with longer delays to presentation and ECG acquisition and a 3-fold increase in mortality associated with delay in the initiation of therapeutic interventions and a decreased intensity of treatment regimens (4). Classic ischemic chest pain associated with ACS usually occurs abruptly, increases in intensity over time, and reaches peak intensity within 2 to 5 minutes of onset. Anginal pain generally lasts for <15 minutes, whereas that associated with MI lasts longer. Certain chest pain characteristics have a low likelihood of representing ACS (seconds of pain or constant pain lasting hours to days, pleuritic pain, and reproducible chest wall pain), but this likelihood is not negligible and is one of the reasons why ACS is so difficult to diagnose (5). Patients may also present with a myriad of other symptoms like nausea, vomiting, diaphoresis, altered mental status, weakness, and even belching.
TABLE 82.2
Clinical Presentation of Unstable Angina

TABLE 82.3
Myocardial Infarction
Traditional risk factors (smoking, diabetes, hypertension, hypercholesterolemia, and family history) are weak predictors of the likelihood of ischemia in an acute presentation by an individual patient. These risk factors were developed retrospectively and are of limited utility in ED patients. These risk factors have no predictive value in the elderly, and even in those younger than 40 years of age, their predictive value is limited and should not dictate diagnostic and management decisions (6). The stronger risk factor for ACS is a previous history of ACS. Patients with a history of a positive stress testing or angiographically documented CAD have an extremely high likelihood of recurrent ischemic disease if they present with anginal or anginal-equivalent symptomatology.
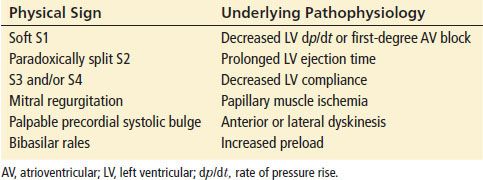
Physical examination findings are nonspecific in the ACS patient, and the utility of the physical examination lies in identifying other etiologies for the patient’s symptoms. Identification of acute cardiac dysfunction, in the form of shock or heart failure, mandates urgent initiation of treatment, but one-fourth of patients with ACS have a normal cardiac examination. Moreover, valvular heart disease, congenital heart disease, cardiomyopathy, and chronic ischemic heart disease have physical examination findings similar to those of the ACS patient, so care should be used in attributing these findings to other pathophysiologic processes. Thus, the physical examination is often not helpful in diagnosing ACS. Table 82.4 lists signs associated with the pathologic changes that occur with ischemia.
TABLE 82.4
Physical Signs That Occur During Myocardial Ischemia
DIFFERENTIAL DIAGNOSIS
A detailed discussion of the differential diagnosis of chest pain is included elsewhere in the text. Cardiac, pulmonary, musculoskeletal, and gastrointestinal systems all give rise to symptoms of ACS. Life-threatening diseases which may be confused with ACS include aortic dissection, pulmonary thromboembolism, pneumothorax, mediastinitis, pericarditis, myocarditis, hypertrophic obstructive cardiomyopathy, and pericardial tamponade. Pneumonia and pleural diseases, valvular heart disease, pericarditis, takotsubo cardiomyopathy, gastroesophageal reflux disease, peptic ulcer disease, and chest wall pain (such as costochondritis and trauma to the chest wall) should also be included in the differential diagnosis. Particular attention to the character of the pain, precipitating factors, associated symptoms, and the physical examination usually allows the clinician to rule out a number of these other causes of chest pain.
ED EVALUATION
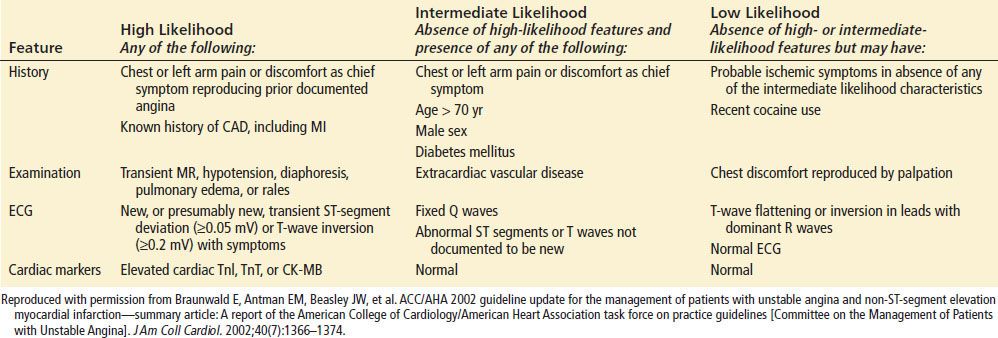
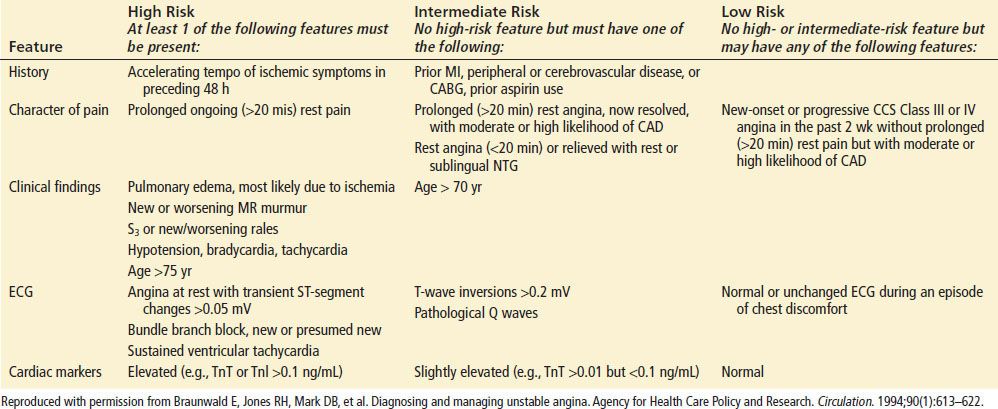
The emergency physician must perform a rapid triage and assessment of patients with potential ACS. Risk stratification will need to be based on history, physical examination, ECG, cardiac markers, and potentially imaging. The estimation of risk is complex, but several investigators have proposed useful risk-stratification schemes (Tables 82.5 and 82.6).
Electrocardiography
The ECG is a mainstay of the initial diagnosis of ACS. It can dictate management, response to therapy, and appropriate admission disposition and is also predictive of the risk of subsequent major adverse cardiac events (MACE). In patients with suspected ACS, a standard 12-lead ECG should be obtained and interpreted within 10 minutes of presentation. Although the ECG remains the best immediate test for identification of AMI, a single ECG performed during the patient’s initial presentation detects less than half of AMI. ECG abnormalities of myocardial ischemia or MI include characteristic changes in the PR segment, the QRS complex, the QT interval, and the ST segment or T waves. However, fewer than half of patients who are eventually discharged with a diagnosis of acute MI have a diagnostic initial ECG. Rather, “nonspecific” or “nondiagnostic” findings are more frequent. The ECG should be obtained when the patient is having symptoms, if possible, but a normal ECG obtained while a patient is having symptoms is no more likely to be associated with ACS than a normal ECG when there are no symptoms (7). Serial ECG recordings can aid in determining whether the patient’s symptoms are due to ACS and have been shown to increase the sensitivity of identification of ACS to almost 90%, but the specificity remains poor at 50% (8). Whenever there is a change in symptomatology or clinical status, a repeat ECG should be performed. Thus, if the ECG is either normal or nondiagnostic but there is still a high clinical suspicion of ACS, it is recommended that the ECG be repeated in 5- to 10-minute intervals to look for diagnostic changes (9).
TABLE 82.5
Likelihood That Signs and Symptoms Represent an Acute Coronary Syndrome Secondary to Coronary Artery Disease
The electrographic manifestations of acute myocardial ischemia by the 2012 Joint ESC/ACCF/AHA/WHF Task Force include the following (10).
• For ST elevation: New ST elevation at the J point in two contiguous leads with the cut-points: ≥0.1 mV in all leads other than V2-V3 where the following cut-points apply: ≥0.2 mV in men 40 years; ≥0.25 mV in men <40 years, or ≥0.15 mV in women.
• For ST depression and T-wave changes: New horizontal or down-sloping ST depression ≥0.05 mV in two contiguous leads and/or T-wave inversion ≥0.1 mV in two contiguous leads with prominent R wave or R/S ration >1.
The 12-lead ECG shows the anterior myocardial wall well but is limited in identifying ischemic areas in the lateral, posterior, and right myocardium. Nonstandard surface ECG recordings are of value in some patients with ACS. The 15-lead ECG includes leads V4 r, V8, and V9 to look for ischemic changes in the right ventricle and posterior portions of the myocardium. The addition of the 15-lead ECG increases the sensitivity for MI without sacrificing specificity. Although a 15-lead ECG should be obtained whenever there appears to be ischemia in the anterior or inferior leads, it can be used in every patient to increase the sensitivity of detection of MI. ECG with up to 192 leads has been utilized to improve sensitivity and to identify more patients who would benefit from reperfusion therapy. This body surface mapping has been shown to augment the traditional ECG in the identification of transmural infarction (ST elevation) and may get these patients to definitive therapy more readily. However, the vast majority of STEMI patients are picked up with the regular 12-lead ECG.
TABLE 82.6
Short-Term Risk of Death or Nonfatal Myocardial Infarction in Patients with Unstable Angina
ECG abnormalities have been classically divided into high- and low-risk criteria for MACE. High-risk abnormalities include ST-segment depression, pathologic Q waves, T-wave changes, left bundle branch block (LBBB), left ventricular hypertrophy (LVH), abnormal conduction, ventricular-paced rhythm, and any abnormality that is reversible or associated with the patient’s symptoms. Abnormalities associated with a low risk of subsequent cardiac events include normal ECG, nonspecific ST and T-wave changes, and absence of change from a previous ECG. Patients with a low-risk ECG still have more than a 10% chance of MI after presentation with ischemic symptoms. Patients with high-risk ECG findings have a 40% chance of MI and high risks of major cardiac events and mortality.
Early ECG signs of myocardial injury are ST-segment and T-wave changes that may also be seen with early or transient reversible ischemia. Nondiagnostic, new, or presumably new ST-segment elevation or depression of ≥0.5 mm (0.05 mV) or T-wave inversion to ≥1 mm (0.1 mV) observed during symptoms may indicate ACS. The magnitude of this ST-segment depression may be predictive for death and recurrent MI.
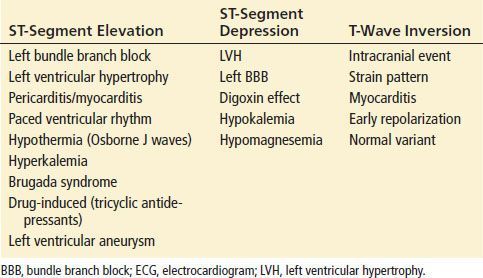
The presence of new nonspecific ECG changes increases the likelihood that chest pain is caused by myocardial ischemia; however, the predictive value is only about 50%. Any dynamic changes, including pseudonormalization of the ECG, should raise suspicion for ACS. New ST-segment deviations of ≥1 mm (0.1 mV) are more consistent with STEMI or NSTEMI and should prompt therapeutic intervention. It is important to note that the magnitude of the change is prognostic for morbidity and mortality from ACS. The greater the ST-segment depression on ECG, the more likely that the patient is having UA or a NSTEMI and worse the prognosis for outcome. A prominent R wave, or an R/S ratio >1, may also be indicative of myocardial ischemia, especially when it is seen in the anterior precordial leads. Patients with ST-segment elevation resulting from acute MI have either obliquely flat or convex-upward waveforms, whereas patients with noninfarction ST-segment elevation (i.e., early repolarization or LVH) tend to have a concave-upward waveform. ST-segment and T-wave changes are not always associated with ACS, so the differential diagnosis should be carefully considered before initiating treatment. Common nonischemic causes for ST-segment elevation or depression and T-wave inversions suggestive of ACS are listed in Table 82.7. Although a nonconcave ST-segment elevation pattern is more commonly encountered in acute STEMI than in other nonischemic causes of ST-elevation, the sensitivity of the morphologic pattern, approximately 75%, precludes complete reliance on its presence or absence to make the diagnosis. The ECG can identify STEMI, but it is not sensitive or specific for the identification of other types of ACS.
TABLE 82.7
Nonischemic Causes of ECG Changes
Evidence of previous ischemic disease may be seen on the ECG. Q waves or QS complexes are usually pathognomonic of a prior MI. Q waves usually develop by 12 hours after the infarction and may be permanent ECG findings. The specificity of the ECG for diagnosing MI in the setting of previous MI is greatest when Q waves occur in anatomic groupings.
The degree of ST-segment changes is also predictive of the extent of myocardial disease, with higher mortality figures for both higher ST-segment elevation and deeper ST-segment depression.
T-wave inversions are a nonspecific finding and can occur in a normal ECG, especially in leads V1 and V2. They are more specific for ACS if they are narrow and symmetrically inverted, if they are associated with symptoms, or if they are reversible. Deep T-wave inversions across the anterior precordial leads or biphasic T waves in the same leads have an association with proximal left-sided coronary lesions. Wellens syndrome refers to this ECG finding, which is associated with an increased incidence of sudden cardiac death during stress testing. These patients should thus undergo coronary angiography for definitive diagnosis.
STEMI is defined by distinctive changes on the ECG. The earliest finding of transmural ischemia may be prolongation of the corrected QT interval, then hyperacute T waves, followed by ST-segment elevation. The hyperacute T wave usually occurs within minutes of the interruption of blood flow. The T wave is often asymmetric, with a broad base. The height of the hyperacute T waves generally correlates well with the acuteness of the injury. There is no cellular death at this stage. The hyperacute T wave evolves rapidly to ST-segment elevation over a 5- to 30-minute period. It is important to note that ST-segment elevation in the setting of MI represents a region of the myocardium that is at risk for necrosis if blood flow is not restored; this has important implications for treatment. ST-segment elevation evolves from J-point elevation and maintenance of a concave configuration to a more pronounced elevation that becomes more convex or rounded upward. The ST segment may eventually become indistinguishable from the T wave and resemble a monophasic action potential (commonly referred to as tombstoning). The degree of ST-segment elevation correlates with the immediate risk for acute complications of infarction.
By definition, the diagnosis of STEMI is dependent on new ST elevation in two contiguous ECG leads. Specific criteria are new ST elevation at the J-point or dynamic ST-elevation in two contiguous leads, with cutoff points of ≥2 mm (0.2 mV) in men or ≥1.5 mm (0.15 mV) in women in leads V2-V3 and/or ≥1 mm (0.1 mV) in other leads. ST–T-wave depressions in leads oriented toward the presumably noninfarcted myocardium are termed reciprocal changes. These changes may also precede ST-elevation, emphasizing the importance of obtaining serial ECG. These ST–T wave depressions usually reflect more extensive infarction and a worse prognosis (Table 82.8).
TABLE 82.8
Anatomic Representation of Myocardial Ischemia by ECG Findings
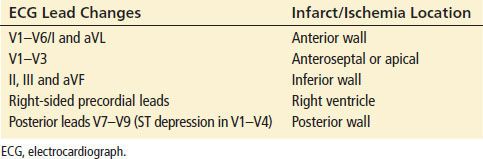
Anatomic Localization of Ischemia by Electrocardiography
The localization of MI by ECG is important for immediate risk stratification for MACE.
Anterior and apical infarctions represent the large left ventricular wall, which makes up the greatest muscle mass of the heart. Infarction in this area is associated with the highest incidence of mortality and MACE. ST elevation or waves in one or more of the precordial leads (V1-V6) and leads I and aVL have classically been used to suggest anterior wall ischemia or infarction. Septal involvement classically refers to involvement solely in V1-V3 but this may represent an apical injury. Changes in V4-V6 suggest anterolateral ischemia or infarction. The reciprocal leads for anterior ischemia are the inferior leads. Anterior infarctions are due primarily to left-sided coronary lesions such as obstructions of the left main artery or the left anterior descending artery. Patients that have ST elevation in the anterior precordial leads and any of the following electrocardiographic findings are at risk of a proximal left lesion and thus have a higher risk of morbidity and mortality: presence of ST elevation in lead aVR, complete right bundle branch block (RBBB), ST depression in lead V5, an abnormal Q wave in aVL, and inferior ST elevation ≥1 mm plus ST elevation in aVL (11). ST elevation in lead aVR ≥ ST elevation in lead V1 may be indicative of a left main coronary artery obstruction (12).
Lateral infarctions may be associated with anterior, inferior, or posterior infarctions, depending on the dominance of the area by the left anterior descending, right coronary artery (RCA), or circumflex vessels. The ECG manifestations of lateral infarction are noted in leads I, aVL, V5, and V6. The reciprocal leads for lateral infarctions can be seen in leads III, aVF, and V1.
Inferior infarctions are identified by ischemic changes in leads II, III, and aVF and may involve either the RCA or the circumflex artery. If there is ST elevation in lead III exceeding that in lead II, especially when combined with ST depression in I and aVL, there is a very high probability of involving the proximal or mid-RCA. If the ST-segment elevation in lead II is equal to lead III, especially combined with ST depression in leads V1-V3 or ST elevation in leads I and aVL, it is usually a circumflex arterial occlusion (13). The RCA supplies the atrioventricular (AV) node in 90% of patients (in the other 10% it is supplied by the circumflex). Thus, bradycardia and blocks are common with involvement in this region. When there is evidence of inferior myocardial ischemia and/or infarction, right-sided leads V3R and V4R should be placed to assess for possible right ventricular ischemia or infarction (see below for right ventricular infarctions [RVMIs]). The reciprocal changes can be seen in I, aVL, or both. Care must be taken in diagnosing anterior changes as reciprocal, as ST depression may be indicative of posterior infarction as well (see further).
True isolated posterior infarctions are rare, as the majority of posterior infarctions are extensions of either inferior or lateral infarctions (RCA or circumflex). Inferior and lateral MIs associated with posterior extension have a higher mortality than each in isolation, and posterior infarctions may be involved in up to 20% of all MI. The posterior wall is, however, poorly represented on the standard 12-lead ECG. A posterior MI should be suspected with any ST-segment depression in the anterior precordial leads or any inferior or right-sided MI. Posterior and inferior MIs can be differentiated from anterior wall ischemia by the presence of ST-segment elevations in the inferior leads (II, III, and aVF) and posterior leads V7-V9. Utilization of these posterior leads V8 and V9 improves diagnostic sensitivity. ECG criteria for posterior MI include a tall, upright T wave, a tall, wide R-wave ≥0.04 seconds in lead V1 (corresponds to the appearance of pathologic Q waves in the posterior leads), a R/S amplitude ratio of >1, and horizontal ST depression in the anterior precordial leads. Posterior MI is amenable to reperfusion therapy, so identification has important implications.
The ECG diagnosis of RVMI offers special challenges. The right side of the heart is another poorly represented region on the standard ECG, and RVMI usually occurs in the presence of an inferior left ventricular infarction, which can mask the specific ECG manifestations. Because there are anatomic variations of the blood supply to the right ventricle, interruption of blood supply in any of the coronary arteries can lead to a right-sided infarction. Thus, right-sided infarction should be a consideration with all MIs and especially so in inferior infarctions. Thirty to fifty percent of inferior infarctions show extension to the right ventricle. RVMI is associated with higher mortality and in-hospital morbidity than patients without RV involvement. Although about half of RVMI have profound hemodynamic and electrical complications, the long-term prognosis is generally good for those who survive the event (14). The sensitivity of the ECG can be improved by utilizing right-sided chest leads (V1R-V6R), which are the mirror images of the left-sided leads. RV infarction is indicated by ST-segment elevation of ≥1 mm in lead V3R or V4R, or both. RV infarction is also suggested in an inferior MI with an isolated ST-segment elevation in V1, owing to the rightward axis of this lead. Although elevation of the right-sided limb leads is specific for RVMI, it is not sensitive. It is important to recognize right ventricular involvement on ECG, as these patients are dependent on preload for the maintenance of left ventricular outflow. Administration of agents, such as nitrates, that reduce preload can result in profound hypotension. RV contractile dysfunction becomes hemodynamically significant in only about 10% of patients; individuals with hemodynamically significant RV infarction typically present with arterial hypotension and jugular venous distention but clear lung fields. These patients are usually amenable to fluid resuscitation, as it will in essence improve hemodynamic parameters on these preload-dependent patients.
Bundle Branch Blocks
Bundle branch blocks (BBB) can make the interpretation of MI more difficult. RBBB usually does not interfere with the diagnosis of STEMI. A RBBB usually affects the terminal phase of ventricular depolarization, producing a wide R¿ wave in the right chest leads and a wide S wave in the left chest leads. This is due to the delayed depolarization of the right ventricle, while most of the STEMI involvement involves the LV and therefore ECG tracings will not be affected in this regard. In the setting of RBBB block, MI can be diagnosed relatively easily, with the ECG showing a wide QRS, a positive terminal deflection in lead V1, and a wide S wave in V6. In the presence of LBBB, ECG indicators of acute MI are much less reliable. No single or group of ECG criteria are completely sensitive for the detection of MI. Three ECG findings that have shown a specificity of 90% for MI include (i) ST-segment elevation of 1 mm or more in the same direction as the QRS complex, (ii) ST-segment depression of 1 mm or greater in leads V1 to V3, and (iii) ST-segment elevation >5 mm opposite to the direction of the QRS complex. A paced rhythm produces a pattern similar to that of LBBB, so ST-segment elevation of >5 mm in predominantly negative QRS complexes (usually the anterior precordial leads) is the only criterion that is useful in the setting of diagnosis of MI when there is a paced rhythm.
Biochemical Markers
After history and ECG, risk stratification continues with biochemical markers of cardiac injury. Disruption of normal cardiac myocyte membrane integrity by ischemia/infarction leads to biologically active intracellular contents such as troponin, creatine kinase (CK), and myoglobin to leak into the extracellular space. The patterns of appearance of these markers in the blood depend on their intracellular location and molecular weight, the local blood and lymph flow, and their rate of elimination from the blood. Cardiac markers are not only useful for diagnosis but can provide prognostic information as well. There is debate as to whether release of these markers is due solely to irreversible damage to the heart. This question arises because of the minor troponin elevations seen after athletes that have run marathons or triathlons or rises of troponin with some patients with pulmonary embolism. These troponin elevations are transient and resolve much more quickly than troponin elevation from AMI (15).
CK, specifically the CK-MB fraction, has been historically used as the primary cardiac marker, but its diagnostic utility over time is in favor of troponin assays. CK-MB is far less sensitive and specific for myocardial infarction than troponins and should not be used in isolation to make the diagnosis of myocardial infarction. CK-MB usually begins to rise within 4 hours of an ischemic event, peaks at 18 to 24 hours, and returns to baseline by 36 to 48 hours. However, some CK-MB is normally present in skeletal muscle, limiting its specificity for cardiac ischemia. Its relatively short half-life assists in temporally identifying the ischemic event when used with other markers, such as troponins.
Cardiac troponins (TnI and TnT) are much more specific for cardiac muscle necrosis. These are proteins that are highly specific for myocardial tissue as they are immunologically distinct from skeletal muscle troponins. There is great variation in the sensitivity of the troponin assays currently in clinical use, from initially developed “standard” assays to the new “high sensitivity” assays that have come into use. Being able to rapidly diagnose ACS or to identify patients at high risk of events with cardiovascular disease is the premise of using “high sensitivity” troponins (16,17). There is little standardization of these assays against each other and there is only recommendation of utilizing an elevation above the 99th percentile, no matter what assay is being used. There are trade-offs between sensitivity and specificity, especially at the very low levels of troponin measurements in whatever troponin assay used. Using standard 99th percentile cut-off values, elevated serum cardiac Tn levels are detectable 2 to 3 hours after acute MI in 80% of patients with AMI (18). This sensitivity improves to 100% by 10 hours. Troponin reaches peak concentrations in approximately 12 hours and remains elevated for 3 to 10 days after an infarction. Even small troponin elevations that are accompanied by a normal CK-MB have been shown to correlate with focal myocyte necrosis. Troponin peak values also correlate with size of infarct on scintigraphy and MRI (19,20). In patients presenting with chest pain who do not have ischemic changes on ECG, an elevated troponin is associated with significant increases in the incidence of CAD in those who undergo angiography and adverse cardiac events over the subsequent year. Troponins can thus be used as prognostic indicators in patients with ACS. NSTEMI is differentiated from UA on the basis of troponin elevation and is associated with four times the mortality in the first month and 2.5 times the mortality at 3 years. In STEMI patients, an elevated troponin has been shown to be an independent predictor of mortality in both the immediate postinfarction period and 1 month to 3 years after infarction (21). The degree of elevation of troponins also has significant prognostic value: Higher troponins are associated with progressively increased mortality, decreased TIMI flow, decreased LV function, and abnormal Q waves when compared with lower troponin elevations (22).
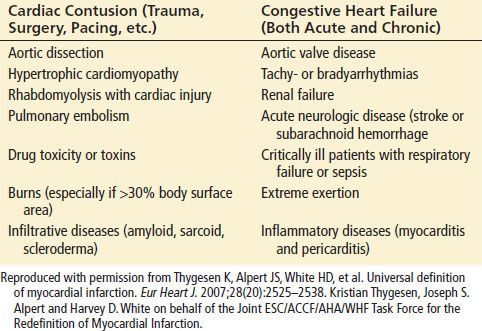
The demonstration of a rising or falling pattern is needed to distinguish myocardial injury from background elevated troponin levels. Troponins can also provide information about reinfarction. Patients with recurrent infarction have an increase in the troponin of more than 20% above the baseline elevation. Although elevations in troponins reflect myocardial necrosis, they do not indicate its mechanism. Thus, an elevated troponin in the absence of clinical evidence of ischemia should prompt a search for other etiologies of myocardial necrosis (Table 82.9).
TABLE 82.9
Etiologies of Elevated Troponins in the Absence of Ischemic Heart Disease