Fig. 6.1
Diagrams (a, b) show two wide QRS complex tachycardias. In both diagrams, small positive deflections, independent of QRS complexes, are present. In diagram (a) these deflections are rhythmic and separated by constant intervals; whenever a deflection is invisible, being coincident with a QRS complex (circle), the interval between two manifest waves is twice the basic interval. These small waves are, therefore, sinus P waves: accordingly, A-V dissociation can be diagnosed, revealing a ventricular origin of tachycardia. In diagram (b), in contrast, the small positive deflections are arrhythmic: they are not P waves but artifacts
The best ECG leads to be analyzed, searching for “dissociated” P waves, are leads II and V1, the ones where sinus P wave voltage is usually relatively high; it is also advisable to observe the leads where the QRS complex and/or the T wave is of low voltage, since it is relatively easy to detect the small atrial waves whenever these are not “buried” within large QRS or T deflections. This is expressed by the “haystack principle”: if you are searching for a needle in a haystack, select a small haystack” (Fig. 6.2).
Fig. 6.2
Wide QRS complex tachycardia. QRS duration is 0.12 s, but since in some leads ventricular complexes are relatively narrow, a supraventricular tachycardia could be diagnosed at first glance. The ventricular origin of tachycardia is demonstrated by A-V dissociation; the P waves independent of ventricular complexes (arrows), and separated from constant intervals, are easily recognized in lead V1, since in this lead both QRS complexes ant T wave voltages are very low (the haystack principle)
The bedside diagnosis of A-V dissociation can be improved by heart sound auscultation and arterial pulse palpation: whenever the atrial contraction is dissociated from ventricular activity, it is possible to appreciate a variable loudness of the 1st heart sound and variability in peripheral pulse amplitude. This is because (1) whenever atrial contraction occurs immediately before ventricular systole, the blood flow “opens” the atrioventricular valves, resulting in a relatively loud 1st heart sound, a phenomenon that does not occur if mitral and tricuspid valves are closed at the time of atrial systole, and (2) if atrial contraction occurs when the A-V valves are open, the diastolic ventricular filling is improved, resulting in a relatively increased stroke volume: accordingly, the pulse amplitude will be higher with respect to that of heart beats in which atrial systole occurs while the A-V valves are closed.
6.2.2 Second-Degree V-A Block
In ventricular tachycardia, atrial electrical activity may be not dissociated from ventricular one if retrograde ventricular-atrial (V-A) conduction occurs, as it happens in about one half of cases. The V-A ratio may be 1 (every QRS complex is followed by a retrograde P wave) or less than 1 when some ventricular impulses are not conducted to the atria. In a wide QRS complex tachycardia, a QRS/P ratio >1 (more QRS complexes than P waves) demonstrates the ventricular origin of the arrhythmia [6–8, 12], (Fig. 6.3), whereas a 1:1 ratio does not permit any definite conclusion since P waves may (a) express a supraventricular tachycardia with 1:1 A-V conduction or (b) represent the retrograde atrial activation during ventricular tachycardia. If analysis of P wave configuration is possible, a main P vector directed inferiorly demonstrates supraventricular origin of the arrhythmia, whereas a P vector directed superiorly (negative P waves in the inferior leads) does not permit any conclusion since not only VT but also several supraventricular tachycardias share a retrograde activation of the atria. In some cases of VT, however, retrograde P waves appear as positive in the inferior leads, a phenomenon that has been called “the illusion of retrograde positive P waves” (Fig. 6.4) [8, 13, 14].
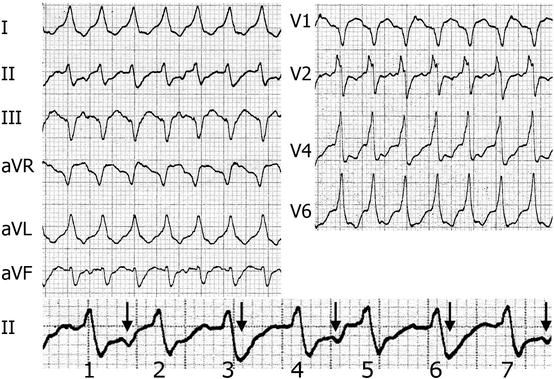
Fig. 6.3
Ventricular tachycardia with 3:2 retrograde block of the Wenckebach type. Lead II (enlarged in the bottom row) analysis reveals that ventricular complexes 1, 4, and 7 are followed by negative P waves occurring midway between two consecutive QRS complexes. Beats 3 and 6, in turn, show very wide “S waves” that never occur in the other beats, whereas complexes 2 and 5 do not show any of the 2 above characteristics (negative P wave, wide “s wave”). It is, therefore, evident that in a group of 3 beats, the 1st one (complexes 3 and 6) is followed by a retrograde P wave with a short R-P interval, whereas the P wave following the 2nd beat of the group (complexes 1, 4, 7) occurs with a relatively long interval, and after the 3rd complex of the series (beats 2 and 5), no P wave occurs. In other words, there is a retrograde 2nd-degree 3:2 Wenckebach type block, and this establishes the diagnosis of ventricular tachycardia. In this tracing, the r wave peak time in lead II is 30 ms
Fig. 6.4
Ventricular tachycardia with retrograde P waves apparently positive in the inferior leads. In all leads, that are simultaneous, apart from the tracing in the bottom strip, the 5th beat (asterisk) is a ventricular extrasystole. Beats 1–4 are followed by P waves that seem, at first glance, positive in the inferior leads and negative in aVR and aVL. The premature beat alters the relationship between QRS complexes and P waves, being the last two ventricular beats not followed by P waves. The bottom strip (lead II) has been recorded later with respect to the others and clearly shows A-V dissociation: P waves of sinus origin are positive (arrows) and independent of QRS complexes; some sinus P waves, occurring simultaneously with ventricular complexes, are invisible, being “buried” within the ventricular complexes. Panels (a, b) show enlarged beats: during retrograde V-A conduction, P waves are negative (arrow in section a), not positive as they seem at first glance. In section (b), a positive P wave is evident in between two QRS complexes, demonstrating A-V dissociation
6.2.3 Capture and Fusion Beats
The presence of narrow, or relatively narrow, beats during wide QRS tachycardia suggests a diagnosis of VT, provided that narrow complexes are preceded by a P wave with an interval consistent with anterograde A-V conduction of the impulse. The narrow, or less wide, complexes are capture or fusion beats that occur whenever, during VT, a sinus or supraventricular impulse succeeds in reaching the ventricles, whose depolarization is due totally (capture) or partially (fusion) to that impulse (Fig. 6.5). Capture and fusion beats are reliable signs of VT, but they are rare (4 % in a study based on 96 cases of proved VT [10]) and can be observed only in the presence of A-V dissociation. Since the latter phenomenon is, in itself, a clear sign of VT, the further help provided by capture and fusion beats is trivial, provided that these never occur whenever the heart rate is very high, being the A-V node made always refractory by ectopic ventricular impulses [6, 8].
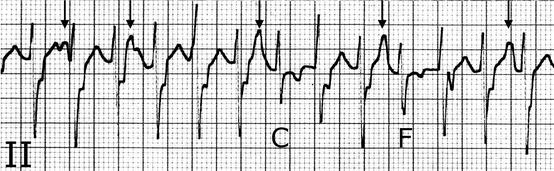
Fig. 6.5
Capture and fusion beats during ventricular tachycardia. In this ECG strip, A-V dissociation is evident (arrows point out sinus P waves that modify T wave morphology). In two occasions, the sinus impulse is conducted to the ventricles, giving rise to a narrow QRS complex (capture beat, labeled C) or to a fusion beat (labeled F). These are intermediate in configuration between ectopic wide complexes and capture beat
6.2.4 Precordial QRS Concordance
A “concordant” QRS morphology in all the precordial leads, namely, ventricular complexes totally negative (QS pattern) or positive (R or qR pattern), demonstrates a ventricular origin of tachycardia, since no intraventricular conduction disturbance can result in such a configuration [15]. Concordance, however, cannot be diagnosed if rS, Rs, or rs complexes occur even in one single precordial lead. In a study based on 232 electrocardiograms with bundle branch block analyzed during sinus rhythm, none showed precordial concordance, suggesting a 100 % specificity of this sign indicating the ventricular origin of the arrhythmia [16]. Negative concordance (QS morphology in all precordial leads, Fig. 6.6), however, is specific of VT, whereas positive concordance could be observed, although rarely, in a preexcited tachycardia due to a left-sided Kent bundle [7, 8]. Negative concordance in the bipolar limb leads (I, II, III) has also been proposed as a specific pattern suggesting VT; [17] such a configuration demonstrates an extreme right axis deviation, a phenomenon that never occurs in adults, apart from some cases of congenital heart disease or dextrocardia.
Fig. 6.6
Precordial concordance. In this tachycardia, wide QRS complexes with QS morphology are present in all precordial leads. This pattern demonstrates without any exception the ventricular origin of tachycardia. Analysis of the inferior leads also reveals a 2nd-degree V-A block with 3:2 ratio; the retrograde negative P waves modify the T wave configuration in two consecutive beats, whereas in the 3rd QRS complex, the T wave is not affected
6.2.5 Absence of RS Complexes in the Precordial Leads
In several cases of VT, none of the precordial leads shows ventricular complexes with a configuration characterized by an R wave followed by an S wave (rs, RS, rS, or Rs). This sign, expressing in a slightly different manner the concept of “precordial concordance,” suggests a ventricular origin of the arrhythmia. The sign specificity was 100 % both in the original study [5] and in another research based on 133 patients with wide QRS tachycardia; [10] in a different series, however, specificity was 81 and 98 % in the presence of positive and negative precordial QRS complexes, respectively [16].
6.2.6 Interval >100 ms from QRS Complex Beginning to S Wave Nadir in a Precordial Lead
It has been observed that whenever, in a wide QRS complex tachycardia, the interval from QRS complex beginning to S wave nadir exceeds 100 ms in a precordial lead, tachycardia is ventricular in origin [5]. The above criterion was fulfilled in 41 % of patients with previous myocardial infarction and VT [18]. In subjects with slowed down intraventricular conduction, however, leads V4–V6 show at times the abovementioned sign even during sinus rhythm, particularly in the presence of left axis deviation. In a study based on electrocardiograms with left bundle branch block and sinus rhythm, 34 % of cases had an interval from QRS complex beginning to S wave nadir >100 ms [16], demonstrating a low specificity of this sign in revealing VT.
6.2.7 Vagal Stimulation Maneuvers
In the presence of QRS wide complex tachycardia, vagal stimulation can result in the following responses:
1.
No change in tachycardia morphology or rate: the question remains open.
2.
Sinus rhythm restoration: supraventricular reentrant tachycardia with a circuit incorporating the A-V node.
3.
Variation in A-V conduction ratio, with appearance of P or F waves: atrial tachycardia or atrial flutter.
4.
Variation in V-A conduction ratio, demonstrated by QRS complexes not followed by a retrograde P wave: ventricular origin of tachycardia.
6.3 The Electrocardiogram in the Absence of Tachycardia
An ECG recorded in the absence of tachycardia can be at times helpful, since a conduction disturbance or preexcitation observed during sinus rhythm can be the key to recognize the mechanism underlying the wide QRS complexes. In the great majority of cases, however, no ECG recorded during sinus rhythm is available at the moment of the arrhythmic emergence. Whenever the ECG during tachycardia is identical to that obtained in sinus rhythm, the arrhythmia is supraventricular in origin, apart from a single exception: the bundle branch reentry tachycardia [19]. In the latter condition, a tracing in sinus rhythm can be misleading, since it suggests a supraventricular, rather than ventricular, origin of the arrhythmia [19].
6.4 QRS Complex Morphology in Leads V1 and V6
Analysis of QRS complex configuration represents an important tool in wide QRS complex tachycardia. Whenever other diagnostic signs (A-V dissociation, capture and fusion beats, precordial concordance, etc.) are either absent or controversial, the distinction between supraventricular and ventricular tachycardia lies on morphologic analysis of ventricular complexes, taking particularly into account leads V1 and V6. The 1st step is tachycardia classification based on QRS morphology in lead V1: whenever ventricular complex is mainly positive in this lead, tachycardia will be defined as “RBBB type,” whereas if in that lead ventricular complexes are negative, tachycardia will be classified as “LBBB type.” In any situation, the leads to be analyzed are V1 and V6.
6.4.1 Wide QRS Complex Tachycardia with Right Bundle Branch Block-Type Configuration (Positive QRS Complex in Lead V1)
V1. Ventricular complexes with morphology R or Rrʹ (the 1st R wave higher than the 2nd one), as well as qR or RS complexes, suggest VT, whereas both a triphasic (rsR׳ or rSR׳) or biphasic configurations rR׳ with the 2nd R wave higher than the 1st one suggest SVT with aberrant conduction (Fig. 6.7).
Fig. 6.7
Ventricular complex morphology suggesting either VT or SVT with aberrant conduction in wide QRS complex tachycardia with RBBB-like configuration (QRS complex mainly positive in lead V1)
V6. In this lead, rS, QS, or qR complexes are specific of VT (Fig. 6.8), whereas qRs complexes suggest aberrant conduction (specificity 95 %). Whenever the R/S ratio, however, is <1 (larger S wave than R wave voltage in lead V6), the ventricular, rather than supraventricular, origin of tachycardia is more likely [10, 16, 20].
Fig. 6.8
 Management of Arrhythmic Patients in the Emergency Department: General Principles
 Syncope: First Evaluation and Management in the Emergency Department
Acute Management of Patients with Arrhythmias and Non-cardiac Diseases: Metabolite Disorders and Ion Disturbances
Syncope: First Evaluation and Management in the Emergency Department
Acute Management of Patients with Arrhythmias and Non-cardiac Diseases: Metabolite Disorders and Ion Disturbances
 Acute Management of Arrhythmias in Patients with Channelopathies
 Supraventricular Arrhythmias in Emergency
 Atrial Flutter and Fibrillation in the Emergency Setting


Ventricular complex morphology suggesting either VT or SVT with aberrant conduction in wide QRS complex tachycardia with LBBB-like configuration (QRS complex mainly negative in lead V1)
Related posts:
Management of Arrhythmic Patients in the Emergency Department: General Principles
Syncope: First Evaluation and Management in the Emergency Department
Acute Management of Patients with Arrhythmias and Non-cardiac Diseases: Metabolite Disorders and Ion Disturbances
Acute Management of Arrhythmias in Patients with Channelopathies
Supraventricular Arrhythmias in Emergency
Atrial Flutter and Fibrillation in the Emergency Setting
Stay updated, free articles. Join our Telegram channel
Full access? Get Clinical Tree
