Study objective
We determine the number and location of freestanding emergency departments (EDs) across the United States and determine the population characteristics of areas where freestanding EDs are located.
Methods
We conducted a systematic inventory of US freestanding EDs. For the 3 states with the highest number of freestanding EDs, we linked demographic, insurance, and health services data, using the 5-digit ZIP code corresponding to the freestanding ED’s location. To create a comparison nonfreestanding ED group, we matched 187 freestanding EDs to 1,048 nonfreestanding ED ZIP codes on land and population within state. We compared differences in demographic, insurance, and health services factors between matched ZIP codes with and without freestanding EDs, using univariate regressions with weights.
Results
We identified 360 freestanding EDs located in 30 states; 54.2% of freestanding EDs were hospital satellites, 36.6% were independent, and 9.2% were not classifiable. The 3 states with the highest number of freestanding EDs accounted for 66% of all freestanding EDs: Texas (181), Ohio (34), and Colorado (24). Across all 3 states, freestanding EDs were located in ZIP codes that had higher incomes and a lower proportion of the population with Medicaid. In Texas and Ohio, freestanding EDs were located in ZIP codes with a higher proportion of the population with private insurance. In Texas, freestanding EDs were located in ZIP codes that had fewer Hispanics, had a greater number of hospital-based EDs and physician offices, and had more physician visits and medical spending per year than ZIP codes without a freestanding ED. In Ohio, freestanding EDs were located in ZIP codes with fewer hospital-based EDs.
Conclusion
In Texas, Ohio, and Colorado, freestanding EDs were located in areas with a better payer mix. The location of freestanding EDs in relation to other health care facilities and use and spending on health care varied between states.
Introduction
Background
Emergency departments (EDs) play a critical role in the United States health care system, delivering 11% of ambulatory visits and a quarter of acute care visits, and serving as the portal for half of hospital admissions. Modern EDs in the United States developed from the “emergency room” of acute care hospitals, and until recently most EDs were hospital based. Freestanding EDs were introduced in the 1970s to provide access to emergency care in communities that could not support a hospital-based ED. They deliver emergency care in a facility that is physically separate from an acute care hospital. Although some freestanding EDs are owned or operated by hospitals (“satellite”), others are independently owned and operated by physician groups and other entrepreneurs.
What is already known on this topic
Freestanding emergency departments (EDs) have been increasing in some regions of the country. There is debate about their role in the health care delivery system.
What question this study addressed
What is the distribution of freestanding EDs in relation to underserved populations and populations with fewer health services?
What this study adds to our knowledge
In the 3 states with the most freestanding EDs (Texas, Colorado, and Ohio), facilities were located in areas with higher income and lower rates of Medicaid. In Texas, freestanding EDs were located in areas with more health services, whereas in Ohio, they were located in areas with fewer health services.
Research we would like to see
How freestanding EDs are related to local health care needs, access to care, continuity of care, and health outcomes.
Importance
Recently, there has been significant growth of freestanding EDs, with a concentration in several states, notably, Texas. In 2007, Sullivan et al identified 80 freestanding EDs nationwide, whereas in 2009 the California HealthCare Foundation identified 222 freestanding EDs. Reports from the popular press reflect the rapid and accelerating growth of freestanding EDs. As the number of freestanding EDs increases, policymakers, health professional organizations, and payers are discussing how to react, including by making changes to policy and reimbursement. Yet current data on the number, geographic distribution, and analysis of the population and health services in areas in which freestanding EDs choose to locate have not been published, to our knowledge.
Goals of This Investigation
One question that recurs is whether freestanding EDs improve access to emergency care. In this article, we aim to describe the location and distribution of freestanding EDs and identify what populations are served by them. We test whether ZIP codes in which freestanding EDs locate differ from nonfreestanding ED ZIP codes along population growth, socioeconomic, and health services factors. Specifically, do freestanding EDs locate in areas with demographic features of underserved populations or fewer health services? Our findings can inform ongoing policy discussions of whether freestanding EDs help improve access to emergency care and for which patients.
Materials and Methods
Study Design and Setting
We created a national inventory of freestanding EDs and then conducted ZIP code–level geographic analyses in the 3 states with the most freestanding EDs: Texas, Ohio, and Colorado.
Methods of Measurement
We identified operational freestanding EDs by conducting a systematic national inventory. First, we gathered lists of licensed freestanding EDs from state departments of health and other state agencies. Second, we conducted Internet searches for each state, using Google to search for “freestanding” or “satellite” and “Emergency Department” or “ED” by state. The list of freestanding EDs in the inventory is current as of March 31, 2015. We collected data on facility characteristics (name and address), hospital ownership (satellite versus independent), and for-profit status (versus nonprofit). We used the inventory to calculate the number of freestanding EDs in each state.
We linked the freestanding ED inventory with ZIP code–level demographic, insurance, and health services data, using the 5-digit ZIP code corresponding to the freestanding ED’s location. We obtained demographic data, including population counts, annual growth rate, sex, age, race, education, and employment data from the 2013 ESRI Demographics files compiled by the Center for Geographic Analysis at Harvard University. Use of health services and medical facility data were also compiled by the Center for Geographic Analysis, using 2013 North American Industry Classification System (NAICS) business counts data. We used the 2013 American Hospital Association data to calculate the number of hospital EDs per ZIP code. We obtained ZIP code–level percentages of uninsured, privately insured, and Medicare and Medicaid patients from the 2013 American Community Survey.
Primary Data Analysis
We focused our geographic analysis on the 3 states with the highest number of freestanding EDs: Texas, Ohio, and Colorado. In each state, we flagged ZIP codes that contained at least 1 freestanding ED and ZIP codes that contained none. We found that ZIP codes with freestanding EDs had significantly higher total population and smaller land area compared with ZIP codes without freestanding EDs. To control for possible confounding because of differences in land area and population, in the 3 states we matched 187 freestanding EDs to 1,048 nonfreestanding ED ZIP codes on land area and population. We used a one-to-many coarsened exact matching algorithm that uses cut points to temporarily coarsen each variable, creates strata of land and population values, and matches observations within each stratum. The cut points were defined manually according to examination of the joint distributions of land and population in freestanding and nonfreestanding ED groups. Each freestanding ED ZIP code was allowed to be matched to more than 1 nonfreestanding ED ZIP code within the same population-land stratum. This one-to-many match produced different sample sizes, and we used coarsened exact matching weights to correct for sample size difference when computing confidence intervals. We used the cem function in Stata MP 13.1 to perform this analysis (StataCorp, College Station, TX). Matching produced groups that were similar with respect to the matching variables ( Table E1 , available online at http://www.annemergmed.com ). As a robustness check, we also performed a one-to-one match on land area and population, as well as a one-to-many match on population and 2010 to 2013 annual compound growth rate. Results of the one-to-one land area and population match were similar to the one-to-many match. Population and growth rates in freestanding ED and nonfreestanding ED samples were similar after we matched on these variables ( Tables E2 and E3 , available online at http://www.annemergmed.com ).
Using matched ZIP code–level data, we computed group-level means of demographic, health insurance, and use and availability of health services variables. To compare characteristics of ZIP codes with and without freestanding EDs, we calculated differences in means across matched groups. We computed confidence intervals for these differences by using univariate regression with freestanding ED group dummy and cem weights to correct for sample size differences. We also performed a multivariable logistic regression analysis to assess the joint contribution of state, demographic, and health services variables to freestanding ED location ( Table E4 , available online at http://www.annemergmed.com ). Links to the datasets and the coarsened exact matching code are available online ( Figure E1 , available online at http://www.annemergmed.com ). All analyses were performed in Stata 13.1.
Results
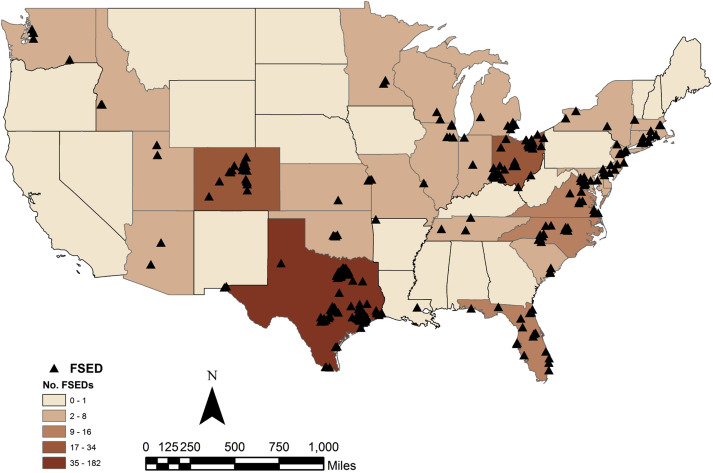
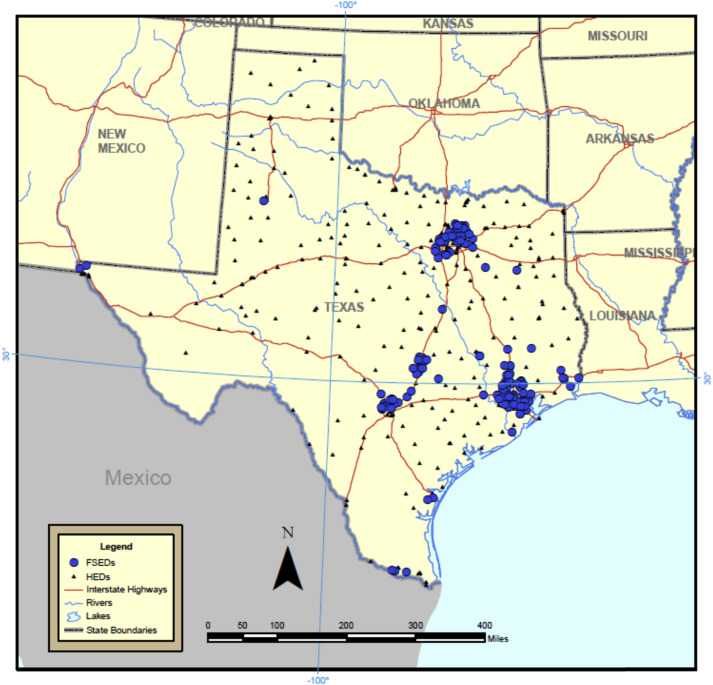
We identified 360 freestanding EDs in the continental United States and a total of 310 freestanding ED–containing ZIP codes as of March 31, 2015. Figure 1 shows the geographic distribution of freestanding EDs across the United States. Freestanding EDs are heavily concentrated in a handful of states. The 3 states with the largest number of freestanding EDs were Texas (n=181), Ohio (n=34), and Colorado (n=24); they had 137, 32, and 22 freestanding ED–containing ZIP codes, respectively. In Texas, freestanding EDs were highly concentrated around several metropolitan areas, as illustrated in Figure 2 . Nationwide 54.2% of freestanding EDs were hospital satellites, 36.6% were independent, and 9.2% were not classifiable; 45.3% of freestanding EDs were for profit, 43.9% nonprofit, and 10.8% not classifiable. In Texas, 22.1% of freestanding EDs were hospital satellites and 71.3% were for profit; in Colorado, 45.8% were hospital satellites and 61.9% were for profit; in Ohio, all but 1 freestanding ED were hospital satellites and 5.8% were for profit.
Demographic, insurance, and health services characteristics differed between matched ZIP codes with and without freestanding EDs ( Table 1 ). Compared with nonfreestanding ED ZIP codes, those ZIP codes with freestanding EDs had higher population growth, fewer racial and ethnic minorities, higher incomes, higher rates of private health insurance, and a lower proportion of the population with Medicaid. In Ohio and Colorado, the direction of the differences was similar to that of Texas, but magnitudes were smaller. In both Colorado and Ohio, household income was higher and percentage Medicaid lower in freestanding ED ZIP codes. In Ohio, freestanding ED ZIP codes had higher rates of private insurance. In Colorado, freestanding ED ZIP codes had a lower proportion of Medicare population.
| Variable | Texas | Ohio | Colorado | ||||||
|---|---|---|---|---|---|---|---|---|---|
| FSED | No FSED | Difference (95% CI) | FSED | No FSED | Difference (95% CI) | FSED | No FSED | Difference (95% CI) | |
| Matched 5-digit ZIP codes | 134 | 441 | 32 | 344 | 21 | 263 | |||
| Demographics | |||||||||
| Population growth rate | 1.7 | 1.3 | 0.4 (0.2 to 0.6) | 0.3 | 0.1 | 0.2 (–0 to 0.4) | 1.4 | 0.8 | 0.6 (0.4 to 0.9) |
| Female patients, % | 50.8 | 50.8 | 0 (–0.4 to 0.4) | 51.3 | 51.0 | 0.3 (–0.4 to 0.9) | 49.1 | 49.5 | –0.4 (–1.4 to 0.7) |
| Median age, y | 35.8 | 32.7 | 3.1 (2.2 to 3.8) | 40.2 | 40.0 | 0.2 (–1.6 to 2.0) | 36.3 | 38.0 | –1.7 (–4.6 to 1.1) |
| Hispanic, % | 25.8 | 50.2 | –24.4 (–29.4 to –19.5) | 2.4 | 3.6 | –1.2 (–2.5 to 0.1) | 18.1 | 19.4 | –1.3 (–8.5 to 6.0) |
| Black, % | 10.2 | 12.8 | –2.6 (–5.3 to 0.2) | 6.6 | 10.5 | –3.9 (–9.7 to 1.9) | 2.4 | 3.0 | –0.6 (–2.8 to 1.5) |
| Median income, $ | 73,003 | 49,267 | 23,736 (19,360 to 28,113) | 58,482 | 49,646 | 8,836 (2,083 to 15,589) | 70,604 | 59,831 | 10,773 (1,639 to 19,908) |
| Unemployment rate | 5.5 | 7.4 | –1.9 (–2.4 to –1.4) | 6.4 | 8.0 | –1.6 (–3.0 to –0.4) | 6.4 | 7.3 | –0.9 (–2.3 to 0.5) |
| Insurance, % | |||||||||
| Private | 71.9 | 53.9 | 18.0 (14.6 to 21.6) | 76.9 | 70.5 | 6.4 (1.9 to 11.0) | 75.7 | 70.9 | 4.8 (–1.6 to 11.3) |
| Medicaid | 9.8 | 19.3 | –9.5 (–11.3 to –7.8) | 11.7 | 16.0 | –4.3 (–7.6 to –1.1) | 9.0 | 13.2 | –4.2 (–8.2 to –0.3) |
| Medicare | 10.4 | 10.8 | –0.4 (–1.2 to 0.4) | 15.8 | 16.5 | –0.7 (–2.2 to 0.7) | 10.4 | 13.7 | –3.3 (–6.5 to –0.2) |
| Uninsured | 16.4 | 25.1 | –8.7 (–10.5 to –6.8) | 9.1 | 11.3 | –2.2 (–3.8 to –0.6) | 13.5 | 14.0 | –0.5 (–3.6 to 2.6) |
| Health services use and spending | |||||||||
| Physician visits/y | 23,330 | 19,973 | 3,356 (1,694 to 5,020) | 17,774 | 16,608 | 1,165 (–2,476 to 4,807) | 14,444 | 14,507 | –63 (–4,199 to 4,073) |
| Medical care, $ spent/y, in millions | 37.6 | 22.9 | 14.7 (12.1 to 17.4) | 24.5 | 20.6 | 3.9 (–1.0 to 8.9) | 23.0 | 19.8 | 3.2 (–2.8 to 9.2) |
| Health facilities | |||||||||
| Hospital-based EDs | 0.6 | 0.3 | 0.3 (0.1 to 0.4) | 0.1 | 0.4 | –0.3 (–0.5 to –0.1) | 0.1 | 0.2 | –0.1 (–0.4 to 0.1) |
| General medical and surgical hospitals | 1.6 | 1.3 | 0.3 (–0.1 to 0.7) | 1.6 | 1.4 | 0.2 (–0.3 to 0.7) | 0.7 | 1.2 | –0.5 (–1.2 to 0.3) |
| Offices of physicians ∗ | 54.3 | 31.2 | 23.1 (14.7 to 31.4) | 25.8 | 30.1 | –4.3 (–13.2 to 4.6) | 17.3 | 23.3 | –6.0 (–15.4 to 3.3) |
| Other outpatient care centers | 4.1 | 3.7 | 0.4 (–0.3 to 1.2) | 2.1 | 2.4 | –0.3 (–1.2 to 0.6) | 2.6 | 3.9 | –1.3 (–2.9 to 0.4) |
| Medical laboratories | 2.0 | 1.5 | 0.5 (0.1 to 0.9) | 1.3 | 1.3 | 0 (–0.6 to 0.5) | 1.2 | 0.9 | 0.3 (–0.2 to 0.8) |
| Diagnostic imaging centers | 0.3 | 0.2 | 0.1 (0 to 0.2) | 0.1 | 0.2 | –0.1 (–0.3 to 0.1) | 0.1 | 0.1 | 0 (–0.2 to 0.1) |
Additionally, Table 1 describes differences in health services use and facilities in matched ZIP codes with and without freestanding EDs. In Texas, freestanding EDs were located in ZIP codes that had more physician visits, medical spending per year, hospital-based EDs, physician offices, and medical laboratories than nonfreestanding ED ZIP codes. In Ohio and Colorado, there were no large differences in physician visits or medical spending between freestanding and nonfreestanding ED ZIP codes. In Ohio, there were fewer hospital-based EDs in freestanding ED ZIP codes. In Ohio and Colorado, there were fewer of several types of health services in freestanding ED ZIP codes compared with nonfreestanding ED ZIP codes. The results of sensitivity analyses matching on population and growth rate were not materially different; some absolute differences between freestanding and nonfreestanding ED ZIP codes were reduced in Texas and Ohio, and confidence intervals for differences in income and percentage Medicaid became wider in Colorado.
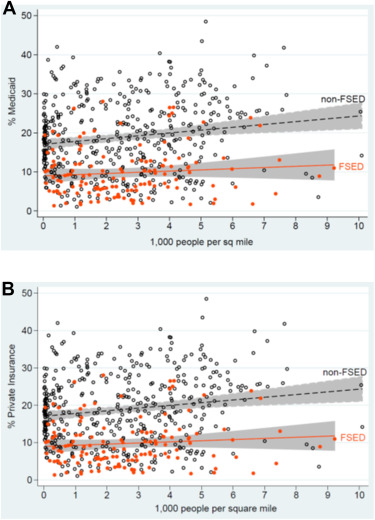
Figure 3 A and B shows scatter plots of matched Texas ZIP codes with or without freestanding EDs, comparing population density against the proportion of the population with Medicaid or private insurance. Freestanding EDs are generally located in ZIP codes with lower proportions of Medicaid and higher proportions of privately insured residents irrespective of the population density of the area.
Tables 2 and 3 show results stratified by freestanding EDs’ hospital affiliation and for-profit status and compare ZIP codes in which these freestanding EDs locate in Texas and Colorado. We excluded Ohio because we found only 1 nonaffiliated and 2 for-profit freestanding EDs. In Texas, location of hospital-affiliated freestanding EDs differed little from nonaffiliated freestanding EDs. For-profit freestanding EDs tended to locate in areas that had a larger Hispanic population than nonprofit freestanding EDs.
| Variable | Texas | Colorado | ||||
|---|---|---|---|---|---|---|
| Hospital Affiliated | Not Hospital Affiliated | Difference (95% CI) | Hospital Affiliated | Not Hospital Affiliated | Difference (95% CI) | |
| FSEDs | 40 | 120 | 11 | 8 | ||
| Demographics | ||||||
| Population growth rate | 2.0 | 1.8 | 0.2 (–0.2 to 0.7) | 1.3 | 1.5 | –0.2 (–1.43 to 1.0) |
| Female patients, % | 50.8 | 50.8 | 0.0 (–0.5 to 0.4) | 48.6 | 50.2 | –1.6 (–4.5 to 1.2) |
| Median age, y | 36.5 | 35.3 | 1.2 (–0.2 to 2.7) | 37.2 | 36.0 | 1.2 (–1.7 to 4.2) |
| Hispanic, % | 22.4 | 26.1 | –3.7 (–9.5 to 2.0) | 16.0 | 14.2 | 1.8 (–5.0 to 8.5) |
| Black, % | 9.0 | 10.7 | –1.7 (–4.8 to 1.3) | 1.4 | 3.4 | –2.0 (–4.3 to 0.4) |
| Median income, $ | 77,887 | 76,202 | 1,685 (–7,683 to 11,054) | 68,342 | 76,669 | –8,327 (–27,766 to 11,111) |
| Unemployment rate | 5.3 | 5.4 | –0.1 (–0.7 to 0.5) | 6.0 | 6.0 | 0.0 (–1.2 to 1.3) |
| Insurance, % | ||||||
| Private | 75.5 | 72.8 | 2.7 (–2.2 to 7.6) | 75.5 | 81.2 | –5.7 (–14.3 to 2.8) |
| Medicaid | 8.4 | 9.4 | –1.0 (–3.2 to 1.1) | 8.4 | 7.2 | 1.2 (–3.3 to 5.6) |
| Medicare | 10.8 | 9.5 | 1.3 (–0.1 to 2.8) | 11.0 | 9.8 | 1.2 (–1.6 to 3.8) |
| Uninsured | 14.3 | 16.1 | –1.8 (–4.6 to 1.0) | 14.0 | 10.5 | 3.5 (–3.4 to 10.3) |
| Health services use and spending | ||||||
| Physician visits/y | 23,108 | 26,050 | –2,942 (–6,773 to 887) | 16,410 | 14,490 | 1,920 (–8,217 to 12,058) |
| Medical care, $/y, in millions | 38.4 | 43.3 | –4.9 (–12.4 to 2.7) | 25.6 | 23.1 | 2.5 (–14.2 to 19.2) |
| Health facilities | ||||||
| Hospital-based EDs | 0.3 | 0.6 | –0.3 (–0.6 to 0) | 0.1 | 0 | 0.1 (–0.1 to 0.3) |
| General medical and surgical hospitals | 1.4 | 1.7 | –0.3 (–0.9 to 0.4) | 0.5 | 0.8 | –0.3 (–1.3 to 0.7) |
| Offices of physicians ∗ | 47.6 | 57.1 | –9.5 (–26.6 to 7.5) | 20.2 | 15.8 | 4.4 (–12.4 to 21.3) |
| Other outpatient care centers | 4.2 | 4.0 | 0.2 (–1.0 to 1.3) | 1.9 | 3.3 | –1.4 (–3.7 to 1.0) |
| Medical laboratories | 1.6 | 2.1 | –0.5 (–1.3 to 0.3) | 1 | 1.1 | –0.1 (–1.5 to 1.3) |
| Diagnostic imaging centers | 0.3 | 0.3 | 0 (–0.1 to 0.2) | 0.1 | 0 | 0.1 (–0.1 to 0.3) |
Related posts:
 Adolescent Male With Right Shoulder Pain After Football Injury
 Association Between the Opening of Retail Clinics and Low-Acuity Emergency Department Visits
Bending the Curve of Health Trajectories for Older Adults Discharged From the Emergency Department
Yet Another
Sedating the Agitated Patient: A Moving Target?
Classified 2017 Advertising Rates & Information
Association Between the Opening of Retail Clinics and Low-Acuity Emergency Department Visits
Bending the Curve of Health Trajectories for Older Adults Discharged From the Emergency Department
Yet Another
Sedating the Agitated Patient: A Moving Target?
Classified 2017 Advertising Rates & Information
Stay updated, free articles. Join our Telegram channel

Full access? Get Clinical Tree


