Ventricular Systolic Dysfunction
William A. Zoghbi
Juan Carlos Plana
Evaluation of left and right ventricular systolic function is an essential part of an echocardiographic examination.
Ventricular function can be evaluated qualitatively or quantitatively.
Systolic function of the left ventricle (LV) has been more extensively evaluated and is more readily amenable to quantification compared to function of the right ventricle (RV).
Global and regional ventricular function is assessed by evaluating endocardial motion and wall thickening. Doppler echocardiography (echo) complements the assessment by quantifying the cardiac output (CO) and the rate of pressure generation.
The degree of LV and RV dysfunction is a powerful predictor of clinical outcomes.
It is essential to be accurate in the calculation of ejection fraction (EF) because it impacts decision making in multiple clinical scenarios (eligibility for internal cardioverter defibrillator [ICD], cardiac resynchronization therapy [CRT] devices, or initiation or discontinuation of chemotherapeutic agents).
Definition and Etiologies
The most commonly used index of global ventricular systolic function is LV ejection fraction (LVEF):
Several studies have shown that EF is among the most important prognostic parameters in cardiovascular disease.
A normal LVEF is ≥55%.
Stroke volume (SV), CO, and rate of rise of LV systolic pressure (dP/dt) are also measures of systolic function and can be derived with echo and Doppler techniques, respectively.
EF, similar to other measures of systolic or diastolic function, is load dependent:
For example, EF is higher than expected in significant chronic mitral regurgitation (increased preload and reduced afterload), whereas EF may be reduced in acute hypertension (increased afterload)
Finally, EF alone may be misleading, more frequently with overestimation, in conditions of severe focal regional dysfunction, such as a large LV apical aneurysm with otherwise preserved regional function.
Common etiologies of LV systolic dysfunction (LVSD) include ischemic heart disease, hypertensive heart disease, valvular heart disease, primary nonischemic dilated cardiomyopathy, infiltrative cardiomyopathy, and congenital heart disease
Echocardiography and Doppler Methods
Echo with Doppler is an ideal noninvasive imaging tool to evaluate ventricular function. Indications for echo in patients with suspected or known ventricular systolic dysfunction are listed in Table 3.1.
Transthoracic echocardiography (TTE) is used in most cases. In technically difficult studies, contrast agents improve the quality of the images.
With the introduction of contrast agents, transesophageal echocardiography (TEE) is rarely performed for the sole evaluation of ventricular function.
Various methods have been used to evaluate and quantify ventricular systolic function (Table 3.2). The most commonly used methods are those of two-dimensional (2D) echo, either qualitatively or quanti-tatively.
Doppler examination complements the overall evaluation by providing an independent method for quantifying SV and CO. A detailed evaluation of commonly used methods follows, with emphasis on technique, features, and pitfalls.
Table 3.1 Indications for echocardiography in patients with suspected ventricular systolic dysfunction | |
|---|---|
|
M-Mode
Although M-mode echo can be used for the evaluation of ventricular function, it should be used with extreme caution to evaluate global LV function. This is because the limited regional function evaluation is extrapolated to global function.
Thus, in general, M-mode can be used in conditions of normal regional function or global regional dysfunction inferred from 2D imaging (patients with uncomplicated hypertension, obesity, or valvular disease in the absence of recognized myocardial infarction [MI]).
Table 3.2 Parameters used in the assessment of regional and global systolic function
Cardiac imaging (M mode/two dimensional/three dimensional)
Left ventricular volumes/left ventricular mass
Stroke volume/cardiac output
Ejection fraction
Fractional shortening/fractional area change
Left ventricular wall stress
Mitral E-point septal separation
Descent of the cardiac base
Echocardiography and Doppler techniques
Stroke volume/cardiac output
Rate of rise of left ventricular systolic pressure (dP/dt)
Systolic time intervals
Tei index
Tissue Doppler (velocity, strain, and strain rate)
Speckle tracking (strain, strain rate)
Best Imaging Planes
TTE: Parasternal long- and short-axis views.
TEE: Transgastric long- and short-axis views.
Diagnostic Methods
M-mode echo allows measurement of wall thickness and LV internal dimensions during the cardiac cycle.
Its high resolution facilitates tracking and recognition of the endocardial borders.
It is recommended that LV internal dimensions be measured at the level of the LV minor axis, approximately at the level of the mitral valve leaflet tips, as perpendicular as possible to the ventricular long axis, centered from the short-axis view, and from leading edge to leading edge of each interface in question (1).
Other information about systolic function can be derived with M-mode, including E-point septal separation and the degree of anteroposterior motion of the aortic root:
With normal systolic function, the anterior mitral leaflet opens during diastole, nearly touching the interventricular septum, with a resultant small E-point septal separation (<5 mm).
Diagnostic Formulas
Fractional shortening () = 100 × (LVIDed – LVIDes)/LVIDed, where LVIDed and LVIDes are the LV internal diameters at end diastole and end systole, respectively (Fig. 3.1).
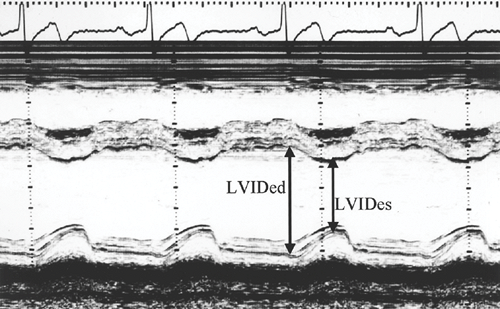
Figure 3.1: M-mode echocardiogram showing measurements of LV internal diameters in end-diastole (LVIDed) and end-systole (LVIDes). M-mode echo can be used for determination of global LV function only in situations of normal regional function or diffuse hypokinesis, as determined by 2D echo.
LVEF = fractional shortening × 1.7, to be used only in normal regional function or in ventricles with diffuse hypokinesis.
Key Diagnostic Features
In systolic dysfunction, the E-point septal separation increases as a result of a combination of LV dilatation and reduced motion of the anterior mitral leaflet in the setting of a reduced transmitral flow.
The anteroposterior motion of the aortic annulus also decreases as the CO diminishes in patients with LVSD.
Pitfalls
Overestimation of the internal diameter of the LV occurs if the M-mode ultrasound beam is oblique to the long axis of the ventricle.
Underestimation of diameters can occur if the beam is not centered in the ventricular chamber:
Two-dimensional guided imaging should be used to assure the adequate positioning of the ultrasound beam.
With diseases that affect the symmetry of the chamber or with regional dysfunction, the measurements obtained at the base of the heart may not be representative of the LV dimensions and function, hence altering the possibility of estimating EF accurately based on diameters.
E-point septal separation may not reflect true LV function; this separation is increased with aortic regurgitation and reduced in acute systolic dysfunction with preserved LV size.
Because of M-mode limitations, it is highly recommended to use 2D echo and, when available, three-dimensional (3D) echo to accurately calculate volumes and EF.
Two-dimensional Echocardiography
Best Imaging Planes
Transthoracic Echocardiography
LV: Parasternal long- and short-axis views, apical four- and two-chamber views, apical long-axis view, subcostal views.
RV: Parasternal long- and short-axis views, RV inflow view, apical four-chamber view, and subcostal views.
Transesophageal Echocardiography
LV: Four-chamber, two-chamber, and long-axis views from the midesophageal position; transgastric long- and short-axis views.
RV: Midesophageal four-chamber view; transgastric RV inflow view and short-axis view.
Diagnostic Methods and Formulas
Left Ventricular Systolic Function
Qualitative and Semiquantitative Evaluation
Estimation of global ventricular function is accomplis-hed by evaluating the degree of endocardial inward motion and ventricular wall thickening for each myo-cardial segment and integrating the information from multiple tomographic planes.
For the evaluation of regional function, the LV is divided into 17 segments (2): six segments at the cardiac base (mitral valve level), six at the midventricle (papillary muscle level), four at the apical portion of the ventricle (no papillary muscles), and one at the apex (Fig. 3.2).
Regional wall motion is scored according to the recommendations of the American Society of Echocardiography (1) as follows: normal or hyperdynamic function = 1, hypokinesis = 2, akinesis = 3, dyskinesis = 4, and aneurysmal = 5:
A wall motion score index (WMSI) is an index of global LV function and is derived as the sum of segmental scores divided by the number of segments evaluated. Therefore, a normal WMSI is scored as 1.
Increasing WMSI denotes worse global dysfunction and carries a poor prognosis (usually >1.4).
A WMSI of 2 usually corresponds to an LVEF in the range of 30% to 39%.
Requirements for successful estimation of EF or WMSI include adequate endocardial definition, adequate visualization of the cardiac apex, and recognition and avoidance of foreshortening of the ventricle. The same
principles apply during TEE examination (3); however, the cardiac apex during TEE is more difficult to image appropriately.
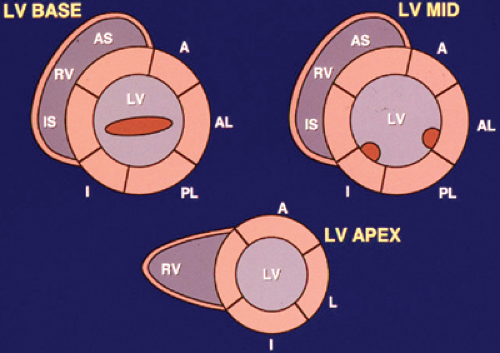
Figure 3.2: Diagrams depicting the segmentation of the LV into 17 cardiac segments. The very tip of the LV apex, as the 17th segment, is not shown in this picture. A, anterior wall; AL, anterolateral wall; AS, anterior septum; I, inferior wall; IS, inferior septum; L, lateral wall; LV, left ventricle; PL, posterolateral wall; RV, right ventricle.
Additional parameters to consider in estimating LV function also include the size and shape of the ventricle and the descent of the cardiac base. For example, for the same extent of endocardial excursion, a small ventricle has a higher EF than a large ventricle.
Descent of the cardiac base during systole is an index of global ventricular function. The magnitude of this motion reflects the extent of LV longitudinal shortening:
Healthy subjects have a descent of the base >8 mm (mean, 12 ± 2 mm).
A mitral annulus descent <8 mm identifies patients with EF <50%, with a sensitivity of 98% and a specificity of 82% (4).
The degree of LV systolic dysfunction is usually reported as follows:
Mild when EF is 45% to 54%.
Moderate when EF is 30% to 44%.
Severe when EF <30%.
An experienced observer can estimate EF in incremental intervals of 5% to 10%.
Pitfalls and Challenges
Interpreter’s experience:
The accuracy of the qualitative estimation of EF largely depends on the experience of the reader.
Derivation of WMSI is more reproducible than qualitative estimation of LVEF.
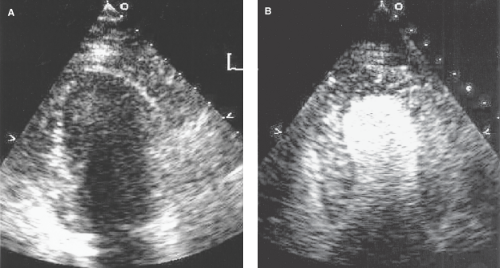
Figure 3.3: Example of poor LV endocardial resolution (A) with enhancement of LV endocardial border with contrast echo (B).
Inadequate endocardial border definition:
The accuracy of assessment of EF depends on adequate visualization of the endocardium.
Foreshortening:
Foreshortening is a limitation in tomographic imaging in which the imaging plane does not transect the ventricle through its center. Although this can be seen from any view, it occurs frequently with apical imaging.
The true cardiac apex may not be seen, and the ventricle then appears smaller than observed from other windows. This may lead to underestimation of LV volumes and overestimation of global function.
Apical foreshortening can be suspected and avoided by using a combination of apical (four- and two-chamber views) and several short-axis views.
On TEE examination, because the true apex may not be adequately visualized, a limited TTE, focused on apical views, could complete a thorough evaluation if apical motion or pathology is in question.
Asynchrony and asymmetry of contraction:
The integration of wall motion obtained from multiple tomographic views is challenging with dyssynchrony (e.g., intraventricular conduction delay or ventricular paced rhythm) and asymmetry of contraction (localized or multiple regional abnormalities).
Evaluation of Right Ventricular Function
Evaluation of RV systolic function includes integration of information on RV size, endocardial motion, and descent of the tricuspid annulus in systole.
Because the geometry of the RV is complex, evaluation of RV size and function from multiple tomographic planes is recommended:
There is no accepted method for quantitation of RV function.
Available methods are those of modified Simpson’s rule or fractional area change from the four-chamber window (see Method of Discs section).
Septal motion gives a clue to the etiology of RV dilatation:
A flattened septum in both diastole and systole supports systolic pressure overload.
Flattening of the septum in diastole only, with resolution of the deformation in systole, supports other etiologies, such as volume overload or states of elevated RV diastolic pressure (e.g., RV infarction) or both.
Quantitative Evaluation of Systolic Performance
Quantitative evaluation of systolic performance is performed by calculating the change in estimated LV volumes or areas from end diastole to end systole.
Method of Discs
LV volumes can be calculated using the modified Simpson’s rule or method of discs from orthogonal apical views (apical four- and two-chamber views) (1).
In the method of discs, the LV is cut into a number (n) of cylinders or discs of equal height, perpendicular to the long axis of the ventricle (Fig. 3.4).
The volume of each cylinder is calculated as V = π (ai × bi) L/n, where L/n is the height of the cylinder, and ai and bi are the diameters of the cylinder from the two orthogonal views.
Ventricular volume is then derived as the sum of the volumes of the cylinders. EF (%) is therefore derived as

where EDV and ESV are the end-diastolic and end-systolic volumes, respectively.
If only one apical view is available, a single plane method is used.
The LV endocardial borders can be traced manually or detected automatically using acoustic quantification (Fig. 3.5).
Care should be taken to ensure adequate tracking of the endocardium, however, since automatic border delineation currently is still gain dependent.
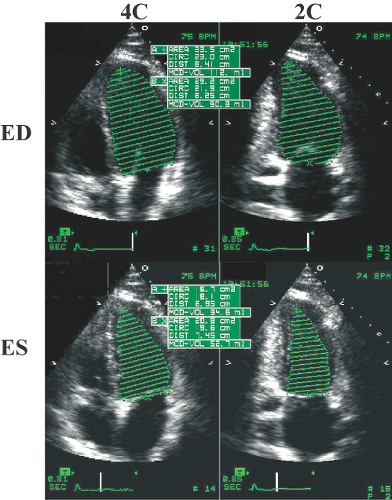
Figure 3.4: Use of the method of discs or modified Simpson’s rule in determination of LV volumes and EF from the four-chamber (4C) and two-chamber (2C) views at end diastole (ED) and end systole (ES). This example is from a healthy individual with an EF of 56%.
Multiple Diameter Method
The multiple diameter method is based on a simplification of the area-length method (6,7) and has the
advantage of using all available tomographic longitudinal views, including the parasternal views (Fig. 3.6), and avoiding areas of endocardial dropout.
Figure 3.6: Example of the multiple diameter method in determination of LV ejection fraction. The advantage of this method is the incorporation of parasternal windows, particularly if the apical views are technically difficult. This method can also be used with TEE.Related posts:

Stay updated, free articles. Join our Telegram channel

Full access? Get Clinical Tree


