KEY POINTS
Cardiac pump dysfunction may be due to ventricular dysfunction, compression by surrounding structures (eg, cardiac tamponade), increased afterload, valvular dysfunction, and/or abnormal heart rate and rhythm.
Ventricular dysfunction may be due to decreased systolic contractility and/or increased diastolic stiffness and may involve right and/or left ventricles.
Systemic vascular factors controlling venous return, and their interaction with cardiac pump function, must be considered in order to identify and treat causes of inadequate cardiac output.
Myocardial ischemia, relative to demand, is the most common acute reversible contributor to depressed contractility but exogenous toxins and drugs (β-blockers, Ca2+ channel blockers, etc), a myocardial inflammatory response (due to ischemia-reperfusion, sepsis, etc), hypoxemia, acidosis, ionized hypocalcemia and other electrolyte abnormalities, and hypo- and hyperthermia also contribute.
Management of acute-on-chronic heart failure progressively includes oxygen; optimizing preload with diuretics, morphine, and nitrates or fluid infusion for hypovolemia; afterload reduction (including positive pressure ventilation); increasing contractility using catecholamines or phosphodiesterase inhibitors; antiarrhythmic drugs and resynchronization using biventricular pacing; intra-aortic balloon counterpulsation, ventricular assist and ECMO devices; and cardiac transplantation.
This chapter emphasizes how critical illness disturbs ventricular function and the systemic factors governing venous return. This does not diminish the possibility that occult ischemic heart disease (see Chap. 37) might be unmasked by the stress imposed by multisystem organ failure or its diverse treatments. To avoid redundancy, I refer liberally to other chapters in this book that discuss ischemic heart disease (Chap. 37) and mechanisms for ventricular dysfunction in the context of other diseases (see Chaps. 25, 26, 33, 36, 38, and 64).
ASSESSMENT OF CARDIAC DYSFUNCTION
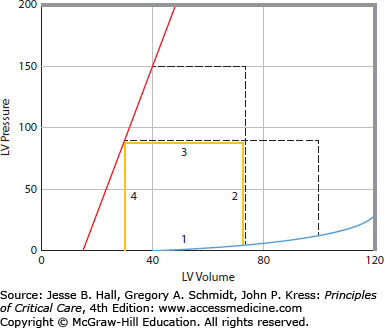
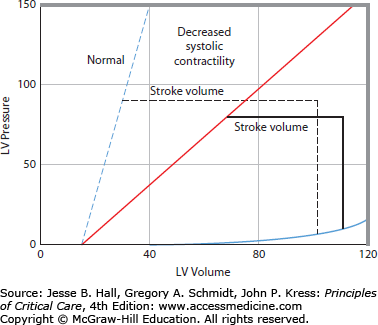
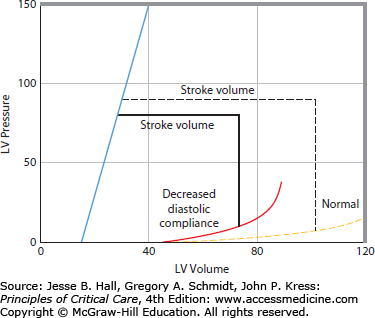
Depressed cardiac pump function may be due to (1) right and/or left ventricular dysfunction, (2) external compression (eg, cardiac tamponade), (3) excessively elevated right or left ventricular afterload, (4) valvular dysfunction, and (5) abnormal heart rate or rhythm. This chapter focus on right and left ventricular dysfunction because cardiac tamponade is discussed in Chap. 40, pulmonary embolism in Chap. 38, valvular dysfunction in Chap. 41, and arrhythmias in Chap. 36. Yet in every case one should consider the role of the pericardium, lungs and other surrounding structures, right- and left-ventricular afterloads, valvular function, and heart rate and rhythm. For right and left ventricular dysfunction both decreased systolic contractility (a shift down and to the right of the end-systolic pressure-volume relation [ESPVR]) and increased diastolic stiffness (a shift up and to the left of the diastolic pressure-volume relation) must be considered (Fig. 35-1). How can one determine the presence of ventricular dysfunction, distinguish between right and left ventricular dysfunction, and then identify the specific cause?
FIGURE 35-1
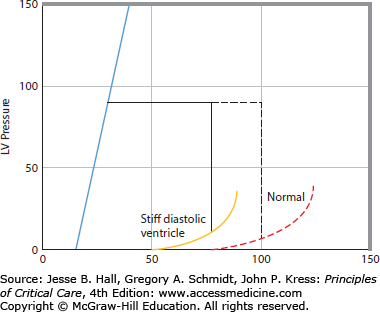
Left ventricular pressure-volume relations, A. The continuous thick lines represent a single cardiac cycle as a pressure-volume loop. During diastole, the ventricle fills along a diastolic pressure-volume relation (1). At the onset of systole, left ventricular pressure rises with no change in volume (2). When left ventricular pressure exceeds aortic pressure, the aortic valve opens, and the left ventricle ejects blood (3) to an end-systolic pressure-volume point. The ventricle then relaxes isovolumically (4). At a higher-pressure afterload, the left ventricle is not able to eject as far (short interrupted lines). Conversely, at a lower afterload, the left ventricle is able to eject farther, so that all end-systolic points lie along and define the end-systolic pressure-volume relation (ESPVR or Emax, sloped solid line). Increased diastolic filling (long interrupted lines) results in increased stroke volume from the larger end-diastolic volume to an end-systolic volume that lies on the same ESPVR; accordingly, increased afterload reduces stroke volume unless preload increases to compensate, B. When systolic contractility is decreased the slope of the ESPVR is decreased. This results in decreased systolic ejection so that stroke volume is decreased (horizontal dashed line is normal stroke volume and horizontal solid line is stroke volume with decreased systolic contractility), C. When diastolic compliance is decreased resulting in a stiff diastolic ventricle, stroke volume is decreased due to impaired diastolic filling.
Left ventricular dysfunction is characterized by high left ventricular filling pressures in relation to cardiac output.1 Likewise, right ventricular dysfunction is characterized by high right ventricular filling pressures in relation to cardiac output. Importantly, there is a close interaction between the left and right ventricles so that, commonly, left and right ventricular dysfunction coexist. Initially, evaluation of heart rate, mean blood pressure, pulse pressure, urine output, mentation, and peripheral perfusion provide a clinical estimate of whether or not cardiac output is decreased (see Table 35-1). Right ventricular filling pressure may be judged by distention of jugular veins while dependent pitting edema may reflect chronically elevated right ventricular filling pressure. Evidence of dependent pulmonary crackles on physical examination due to heart failure suggests that left ventricular filling pressure is elevated, usually above 20 to 25 mm Hg. However, in chronic congestive heart failure, where pulmonary lymphatic drainage increases, crackles may not be present even at filling pressures as high as 30 mm Hg. Interstitial edema clearance lags decreases in left atrial pressure (Pla) by hours, so rapid decreases in Pla are not accurately reflected by pulmonary auscultation. An audible third heart sound suggests an elevated Pla in the presence of a dilated left ventricle.2
Chronic Causes of Decreased Contractility (Dilated Cardiomyopathies)
| Coronary artery disease |
| Idiopathic |
| Inflammatory (viral, toxoplasmosis, Chagas disease) |
| Alcoholic |
| Infection with the human immunodeficiency virus |
| Postpartum |
| Uremic |
| Diabetic |
| Nutritional deficiency (selenium deficiency) |
| Metabolic disorder (Fabry disease, Gaucher disease) |
| Toxic (Adriamycin, cobalt) |
Following a clinical examination that suggests ventricular dysfunction, a screening echocardiographic examination (FOCUS3) generally provides the most useful information in the shortest period of time. This focused screening examination in the emergent or ICU setting evaluates relative chamber size and global ventricular function, determines whether a pericardial effusion is present, and assesses volume status3,4; knowledge that can immediately direct the next diagnostic and therapeutic steps. To separately evaluate systolic and diastolic function or when regional wall motion abnormalities, valvular dysfunction, pulmonary hypertension, and other pathology is suggested by the initial clinical or screening echocardiographic examinations, a comprehensive echocardiographic examination performed by an expert is the next most readily available and useful step (see Chap. 29). Correct interpretation is crucial. Ejection fraction and related fractional shortening measurements are sensitive to changes in preload and afterload.5,6 Ejection fraction should increase with decreased afterload (hypotension) and increase further during catecholamine infusions7 so a “normal” ejection fraction in the setting of catecholamine-treated hypotension is distinctly low. A large end-systolic volume (ESV) when afterload is normal or low indicates that depressed contractility contributes to decreased ventricular pump function. A small end-diastolic volume (EDV) when filling pressures are normal or high indicates that increased diastolic stiffness (including external compression) contributes to decreased ventricular pump function.8 Therefore, end-diastolic and end-systolic diameters should be determined separately and interpreted in the light of measured pressures and flows.
Doppler echocardiographic examination allows measurement of the pressure gradients across valves, which is proportional to four times velocity squared. For example, it is usually possible to estimate Ppa from the tricuspid regurgitation velocity, added to CVP. Valvular insufficiency is also identified using Doppler and color Doppler echocardiographic imaging of blood velocities. The major limitation of conventional transthoracic echocardiographic examinations is that critically ill patients frequently are difficult to optimally position, are often on positive-pressure mechanical ventilation, and have lung disease so lung shadows obscure echocardiographic views, thus making accurate examination difficult. Transesophageal echocardiographic examination circumvents this problem and is therefore an important tool for evaluating ventricular pump function in critically ill patients.9,10
During severe ventricular dysfunction or during critical illness where even mild ventricular dysfunction contributes significantly to severity of illness, more accurate measures of ventricular function than can be determined by clinical examination alone are required. Important tools in the intensive care unit (ICU) that allow for frequent serial measurement to test and titrate therapy are central venous catheterization, pulmonary artery catheterization, or the use of related devices using indicator dilution, pulse pressure assessment, and Doppler ultrasound principles.11 Serial echocardiographic assessment is sometimes also feasible. Central venous catheterization with the catheter tip near the right atrium allows measurement of right ventricular filling pressure (CVP) and central venous oxygen saturation, which can be used to assess the adequacy of whole body oxygen delivery and estimate cardiac output by using the Fick equation.12 Pulmonary artery catheterization can assess cardiac output by using the thermodilution technique and can measure CVP, pulmonary artery pressure (Ppa), and pulmonary artery wedge pressure (Ppw) (with important limitations discussed in Chap. 28), providing a more comprehensive physiologic evaluation. Uncritical use of a pulmonary artery catheter may be associated with no benefit or even increased mortality.13,14 Nonetheless, thoughtful use of a pulmonary artery catheter in the most severely ill may decrease mortality rate.15
IS DECREASED CARDIAC OUTPUT DUE TO CARDIAC DYSFUNCTION OR DECREASED VENOUS RETURN?
Cardiac output is primarily controlled by regulation of venous return—the rate at which blood flows back to the heart. Normally, the heart simply pumps out all of the blood that returns to it, responding to changes in venous return by using the Frank-Starling principle—that is, more filling yields more ejection. Only when cardiac pump function is greatly impaired does the heart become the limiting component in the generation of cardiac output. These principles are illuminated by considering the coupling of cardiac pump function to venous return.
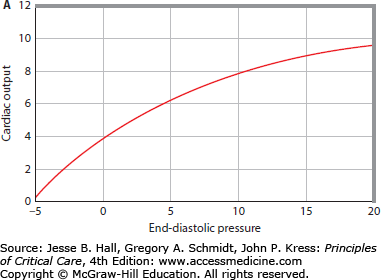
The pump function curve of the entire heart is illustrated as the relation between cardiac output and input (Pra) over a range of values (Fig. 35-2A). Sometimes this relation is called a Starling function curve, although this term has been applied historically to a pump function curve where stroke work is the output.16 The curvilinear relation between cardiac output and Pra importantly illustrates that increasing Pra is more effective in increasing cardiac output at low values than at high values of Pra.
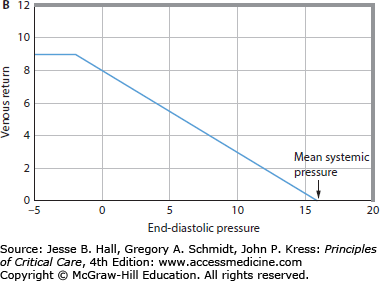
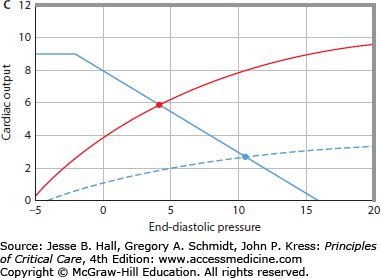
FIGURE 35-2
A. Cardiac pump function can be defined by the relation of the heart’s output to its input.1 Cardiac output is the most important output of the entire heart, and right atrial pressure (Pra) is an easily measured input of the entire heart. The cardiac function curve relates right atrial pressure (Pra) or end-diastolic pressure (EDP; abscissa) to cardiac output (ordinate). As EDP increases, cardiac output increases; however, at high EDPs, further increases cause less increase in cardiac output. B. The relation between EDP (Pra, abscissa) and venous return (ordinate) is illustrated. When EDP equals mean systemic pressure (Pms), there is no pressure gradient (Pms-Pra) driving the blood flow back to the heart, so venous return is zero. As EDP (Pra) decreases, the gradient from the veins to the heart to drive blood flow back to the heart increases, so venous return increases. At very low EDPs (Pra 0 mm Hg), central veins collapse and act as Starling resistors, so further decreases in EDP do not increase venous return. C. The cardiac function curve and the venous return curve are drawn on the same axes (continuous lines). The intersection of the cardiac function curve and the venous return curve defines the operating point of the circulation, here at an EDP (Pra) of approximately 5 mm Hg and a cardiac output of approximately 5 L/min. The interrupted cardiac function curve illustrates decreased cardiac function, causing decreased cardiac output (∼3 L/min) at a higher EDP (Pra = 10 mm Hg).
Most physicians are aware that increased contractility improves cardiac pump function by shifting the pump function curve upward and to the left so that, at the same filling pressure, an increased cardiac output is generated. It is equally important to realize that abnormalities in diastolic filling (influenced by external factors compressing the heart), afterload, valve function, and heart rate and rhythm can shift this relation, and these factors in specific patients can be more important than changes in systolic contractility in modulating cardiac pump dysfunction encountered in the noncoronary care ICU.
Consider the pressure-volume relation of the left ventricle shown in Figure 35-1A. All end-systolic pressure-volume points lie along a line, the ESPVR. All ejections from different diastolic volumes end on the ESPVR.17 The ESPVR shifts down and to the right when contractility decreases (Fig. 35-1B), resulting in decreased stroke volume at any given afterload. Because of these characteristics, the ESPVR is a good index of ventricular contractility independent of changes in preload and afterload; because this slope is maximal at end systole and has the units of elastance (E = ΔP/V), it has been denoted Emax or Ees.17 Stroke volume can also be decreased by impaired diastolic filling simply due to hypovolemia (Fig. 35-1A) or due to decreased diastolic compliance (Fig. 35-1C). The cause of decreased diastolic compliance may be an intrinsically stiff diastolic ventricle (eg, due to ischemia or restrictive cardiomyopathy) or compression by external structures (eg, pericardial tamponade, constrictive pericarditis, or elevated intrathoracic pressure from lungs, chest wall, or from abdominal distention). The sloped characteristic of the ESPVR means that increased afterload also decreases stroke volume (Fig. 35-1A).
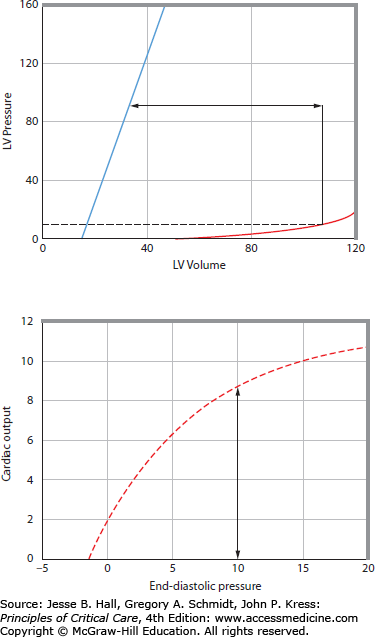
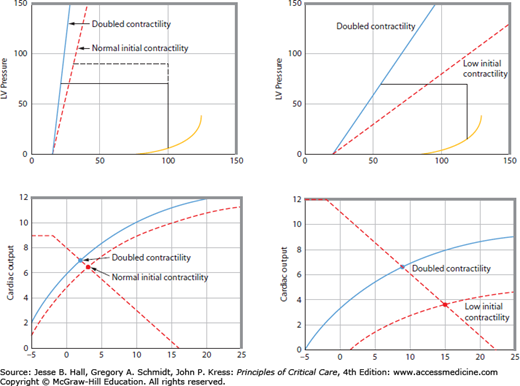
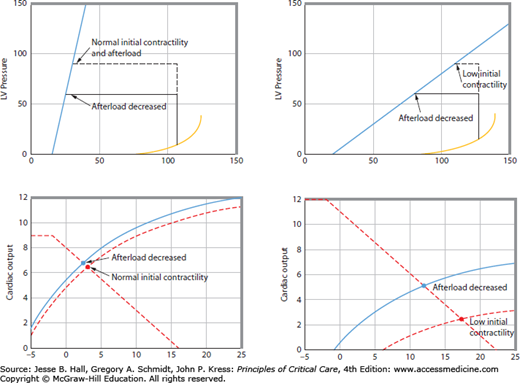
This pressure-volume representation of ventricular function is related to the ventricular pump function curve in a straightforward manner (Fig. 35-3). Stroke volume (arrow in Fig. 35-3, top panel) multiplied by heart rate yields cardiac output (arrow in Fig. 35-3, bottom panel). Accordingly, an increase in ventricular contractility results in a leftward and upward shift of the ventricular pump function curve. An increase in contractility from a normally steep ESPVR does not decrease ESV much and therefore does not improve ventricular pump function much (Fig. 35-4). This explains why increased contractility is only a minor contributor to regulation of cardiac pump function in normal human beings. In contrast, when ventricular contractility starts off depressed, as indicated by a decrease in slope of the ESPVR, an increase in contractility significantly decreases ESV to improve ventricular pump function (see Fig. 35-4), thereby explaining why positive inotropic agents are useful in acute treatment of dilated cardiomyopathies.
FIGURE 35-3
The cardiac function curve (bottom) is related to the left ventricular pressure-volume relations (top). Top. Stroke volume (double-headed arrow) is the difference between end-systolic volume (ESV) and end-diastolic volume (EDV). EDV at end-diastolic pressure (EDP = 10 mm Hg) is illustrated on the diastolic pressure-volume relation; ESV is determined by the end-systolic pressure (ESP) and the end-systolic pressure-volume relation (ESPVR or Emax). Therefore, for any EDP, cardiac output can be calculated if heart rate is known. Bottom. An increase in EDP increases EDV and cardiac output. At an EDP of 510 mm Hg, an increase in contractility would result in an increased stroke volume because the ESPVR shifts to the left; therefore, cardiac output increases at the same EDP and the cardiac function curve shifts up.
FIGURE 35-4
The bottom two panels show cardiac function curves derived (see Fig. 35-3 for derivation) from the pressure-volume relations illustrated in the top panels. The left-hand panels show that when contractility is initially normal, then greatly increasing it does not improve cardiac function very much (dashed and solid cardiac function curves in the lower left-hand panel are similar). Flogging a normal heart with inotropic agents is ineffective, although vasoactive agents with effects on the venous circulation can increase venous return without correcting underlying pathophysiology. Conversely, the right-hand panels show that when contractility is initially low, then inotropic agents substantially improve cardiac function (from the dashed cardiac function curve to the solid cardiac function curve in the lower right-hand panel). For the same venous return curve (dashed biphasic line in the lower right-hand panel), cardiac output increases at a lower left ventricular end-diastolic pressure (blue dot versus red dot in lower right-hand panel).
A decrease in pressure afterload will result in a decrease in ESV, so stroke volume and cardiac output increase, all else being constant.17 Thus, decreased afterload also improves ventricular pump function by shifting the ventricular pump function curve up and to the left. Analogous to the effects of changing contractility, normal hearts with steep ESPVRs do not eject substantially further with a decrease in afterload because ESV does not decrease much (Fig. 35-5). This explains the observation that decreasing afterload in normal patients does not substantially increase cardiac output even when it leads to frank hypotension. However, in patients with depressed contractility, as signaled by a decreased slope of the ESPVR, a small decrease in afterload causes greater ejection to a smaller ESV so that stroke volume and cardiac output are substantially increased at the same ventricular filling pressure (see Fig. 35-5). Therefore, in patients with depressed systolic contractility, afterload reduction is an effective means for improving ventricular pump function.18
FIGURE 35-5
The bottom two panels show cardiac function curves derived (see Fig. 35-3 for derivation) from the pressure-volume relations illustrated in the top panels. The left-hand panels show that when contractility is initially normal, then afterload reduction does not improve cardiac output or cardiac function (dashed and solid cardiac function curves in the lower left-hand panel are similar) and serves only to produce hypotension. Conversely, the right-hand panels show that when contractility is initially reduced (dashed cardiac function curve in the lower right-hand panel), then afterload reduction substantially improves cardiac function (solid cardiac function curve in the lower right-hand panel). For the same venous return curve (dashed biphasic line in the lower right-hand panel), cardiac output increases at a lower left ventricular end-diastolic pressure (blue dot versus red dot in the lower right-hand panel).
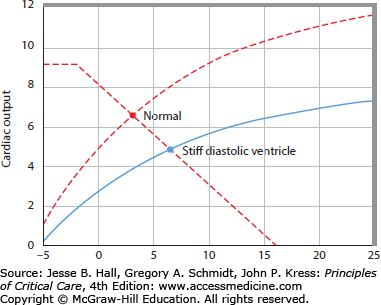
Increased stiffness of the diastolic pressure-volume relation reduces stroke volume because EDV is decreased at the same ventricular filling pressure (Fig. 35-6). Therefore, an increase in stiffness of the diastolic left ventricle leads to a rightward and downward shift of the ventricular pump function curve.19 This may be erroneously interpreted as decreased systolic contractility when, in this case, depressed ventricular function is completely accounted for by a stiff diastolic ventricle. A change in heart rate may also shift the ventricular pump function curve. However, this effect is generally small because when heart rate increases, stroke volume decreases because there is less time for the ventricle to fill during diastole. Thus over a wide range, heart rate does not substantially change cardiac output.20 At very fast heart rates exceeding 150 beats/min diastolic filling becomes markedly impaired and cardiac output decreases as heart rate quickens further. Very low heart rates (<40-50) also decrease cardiac output because the diastolic ventricle is maximally full before end-diastole so prolonging diastole further does not increase stroke volume. Then cardiac output becomes directly proportional to heart rate.
FIGURE 35-6
The right panel shows a cardiac function curve derived (see Fig. 35-3 for derivation) from the pressure-volume relations illustrated in the left panel. An increase in diastolic stiffness results in a decrease in end-diastolic volume (EDV) and in stroke volume at the same EDP, end-systolic pressure, and end-systolic pressure-volume relation, so increased diastolic stiffness shifts the cardiac function curve down and to the right (dashed cardiac function curve to the solid cardiac function curve in the right panel).
Cardiac function is tightly coupled to venous return, and many patients with low cardiac output due to presumed cardiac dysfunction instead have abnormalities of the factors driving venous return.21 Pra and cardiac output define the cardiac function curve and define the venous return relation.22Figure 35-2B shows that as Pra is decreased, venous return increases, because the pressure driving venous blood back to the heart, mean systemic pressure (Pms) minus Pra, increases. The factors that determine venous return are Pms, Pra, and resistance to venous return (RVR).
In steady state, the cardiac function curve and the venous return curve are necessarily coupled because the flow of blood out of the heart must equal the flow in. Thus the operating point of the heart is not defined by the cardiac function curve or by the venous return curve but by the intersection of these two curves (see Fig. 35-2C). Accordingly, patients with cardiovascular dysfunction having abnormal values of heart rate, Pra, aortic pressure, and cardiac output may have cardiac dysfunction that accounts for these abnormalities or may have abnormalities of venous return. It follows that, in every patient with suspected abnormal cardiovascular function, one should consider cardiac function and venous return in attempting to understand the abnormality.21,23
In health, cardiac output is controlled by mechanical properties of the systemic vessels adjusted by neurohumoral reflexes; when output and blood pressure decrease, baroreceptor reflexes act to increase flow by raising Pms by sympathetic nervous and humoral output. The importance of factors driving venous return is evident during exercise or even during the act of standing up. Without increased venous tone (as can occur with some spinal cord injuries) or increased muscle activity aided by venous valves, cardiac output and therefore blood pressure decrease precipitously in changing from a recumbent to an upright position. As an extension of normal physiology, in critically ill patients without a previous history of cardiac dysfunction, the major factor limiting cardiac output is often limited venous return. Only in patients with marked ventricular dysfunction is cardiac output limited by decreased pump function. Knowing this avoids incorrect diagnosis and treatment. For example, positive inotropic drugs (dopamine and epinephrine) increase cardiac output even in patients with no ventricular dysfunction by increasing venous return due to increased Pms and decreased RVR (by redistributing blood flow to vascular beds with short transit times). This improvement in cardiovascular function is often attributed to improved cardiac function. Yet this interpretation is often incorrect and may delay therapy aimed at correcting factors governing venous return, such as plasma volume expansion, whereas the vasoactive drugs ineffectively flog the empty heart.
In summary, a complete evaluation of the contribution of ventricular dysfunction to cardiovascular performance in critical illness acknowledges that cardiac output and ventricular filling pressures depend as much on factors driving venous return as on cardiac function. Most critically ill patients without a history of cardiac disease have abnormalities of venous return in excess of abnormalities of cardiac function. Accordingly, cardiac output is limited by the heart only in patients with marked ventricular dysfunction, and the ventricular pump function curve is dependent not only on contractility but also on the diastolic ventricular pressure-volume relation, afterload, valvular function, and heart rate.
MECHANISMS AND MANAGEMENT OF LEFT VENTRICULAR DYSFUNCTION
This section addresses the diverse acute and chronic etiologies of left ventricular dysfunction and concludes with principles of management for each.
Chronic Causes: Dilated cardiomyopathies are the best-known chronic causes of decreased left ventricular contractility.24 Dilated cardiomyopathy is often idiopathic with evidence that viral, immune, and genetic factors contribute.24 Dilated cardiomyopathy may also be associated with coronary artery disease, presumably due to previous ischemic events and subsequent adverse remodeling and apoptosis of cardiomyocytes leading to a dilated, poorly functional left ventricle.25 Alcoholic cardiomyopathy is an important cause of chronic dilated ventricular dysfunction to be considered in critically ill patients.24 Particularly in younger patients, inflammatory cardiomyopathy (myocarditis), usually viral, is an important cause of acute dilated cardiomyopathy that may lead to a chronic dilated cardiomyopathy in 10% of cases. Evidence of familial occurrence of similar disease is common, suggesting a genetic contribution in up to 25% of cases.24,26 Rare causes such as the glycogen storage diseases may also be found in young patients. Multiple, less common causes may be encountered (Table 35-1).
These multiple, different etiologies of dilated cardiomyopathy lead to decreased ventricular contractility in a number of ways. Loss of myocardium with degradation of the normal collagen architecture by matrix metalloproteinases and replacement with fibrous connective tissue leads to remodeling and decreased contractility.24,27 Increased levels of circulating renin, angiotensin II, endothelin, and norepinephrine promote cardiomyocyte hypertrophy, apoptosis, myocardial fibrosis, and vascular cell hypertrophy. Myocardial norepinephrine stores are depleted and β-receptor density is reduced in chronic dilated cardiomyopathy.25,27,28 Biochemical changes that may contribute to decreased contractility include decreased efficiency of the sarcoplasmic reticulum calcium pump, decreased actin-myosin adenosine triphosphatase activity, and change in myosin isoenzyme composition.
Acute Causes: In the ICU, acute causes of decreased left ventricular contractility are important because the acute causes are potentially reversible (Table 35-2). Acute causes of depressed left ventricular contractility include ischemia, exogenous toxins such as alcohol and drugs, and an intramyocardial inflammatory response following ischemia-reperfusion or due to inflammatory mediators of sepsis or systemic inflammation. In addition hypoxemia, respiratory acidosis, metabolic acidosis, ionized hypocalcemia, and hypo- and hyperthermia may contribute.
Acute Reversible Contributors to Decreased Contractility
| Ischemia |
| Hypoxia |
| Respiratory acidosis |
| Metabolic acidosis |
| Hypocalcemia |
| Hypophosphatemia |
| Possibly other electrolyte abnormalities (Mg2+, K+) |
| Exogenous substances (alcohol, β-blockers, calcium channel blockers, antiarrhythmics) |
| Endogenous substances (endotoxin, histamine, tumor necrosis factor, interleukin 1, platelet-activating factor) |
| Hypo- and hyperthermia |
Myocardial Ischemia Transient ischemic episodes occur frequently in critically ill patients. The onset of ischemia is due to myocardial oxygen demand exceeding the ability of the myocardium to extract oxygen from the oxygen supply (coronary blood flow multiplied by arterial oxygen content). Myocardial oxygen demand is increased by increasing heart rate, contractility, afterload, preload, and the basal metabolic rate of the myocardium (which increases with increased sympathetic tone and catecholamines).29
Stay updated, free articles. Join our Telegram channel

Full access? Get Clinical Tree


