KEY POINTS
Pressure and flow waveforms reveal a wealth of information regarding the patient’s physiologic derangement.
Distinguishing the contributions of resistive and elastic pressures allows tailoring and monitoring of therapy.
AutoPEEP should be sought in all mechanically ventilated patients.
Ventilator waveforms show how adequately the physician has accommodated the ventilator to the patient.
Patient effort confounds interpretation of pressures and flows.
Attention to ventilator waveforms can improve the accuracy of hemodynamic interpretation and is essential for judging the validity of dynamic predictors of fluid-responsiveness.
Intensive care ventilators generate tidal ventilation by applying to the endotracheal tube or mask a pressure higher than the alveolar pressure. This is true whether the mode of ventilation is volume-preset (volume assist-control [ACV], synchronized intermittent mandatory ventilation [SIMV]); pressure-preset (pressure support ventilation [PSV], pressure-control ventilation [PCV]); or more complex modes (pressure-regulated volume control [PRVC], proportional assist ventilation [PAV], airway pressure release ventilation [APRV], volume support ventilation [VSV]). The capability to display waveforms turns modern ventilators into sophisticated probes of the patients’ respiratory mechanics and of patient-ventilator interaction. Respiratory system mechanics and waveform analysis should be integrated into routine ventilator management of the critically ill patient. The fundamental aims are to (1) determine the nature of the mechanical derangement of the respiratory system; (2) assay the response to therapy and time; (3) reveal autoPEEP; and (4) determine the patient-ventilator interaction to guide adjustment of ventilator settings. In addition, respiratory muscle activity must be considered when measuring hemodynamic pressures such as the pulmonary artery occlusion pressure (wedge pressure, Ppw) or the right atrial pressure (Pra), since these pressures are determined at end-expiration or when judging the validity of dynamic fluid-responsiveness predictors (such as pulse- or stroke-volume variation), since these depend on a passively ventilated patient. The timepoint of end-expiration, as well as the presence of inspiratory and expiratory effort (both of which can greatly confound interpretation of hemodynamic pressures) can be readily discerned by analyzing ventilator waveforms.
It is easiest to derive clinically useful information about the patient’s respiratory system when volume-preset modes such as ACV or SIMV are used. At least when the patient is passive, the pressure at the airway opening (Pao) and the pressure versus time waveform reflect the mechanical properties of the respiratory system, yielding valuable clinical information. During pressure-preset modes, such as pressure-support ventilation (PSV) and pressure-control ventilation (PCV), some information can be derived from the flow versus time waveform, but this information is generally less readily interpreted than that obtained during volume-preset ventilation. Below we review the determinants of the pressure and flow versus time waveforms during volume-preset, then pressure-preset, ventilation, including how to recognize and quantitate autoPEEP as well as a method for using this information to adjust the ventilator. Volume-pressure loops are reviewed in terms of how they may aid management of the patient with acute lung injury (ALI) or acute respiratory distress syndrome (ARDS) but we also review the simpler use of the stress index for this same purpose. The potentially confounding effect of patient effort on the pressure and flow waveforms is discussed. Finally, examples of problems revealed through careful interpretation of waveforms are presented.
PRESSURE AT THE AIRWAY OPENING
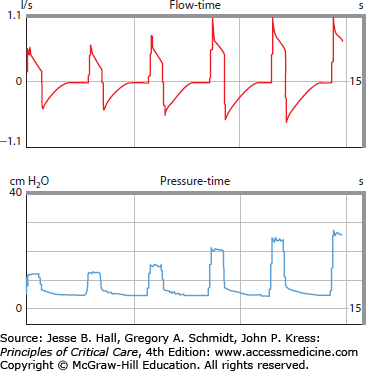
Gas is driven to and from the lung by a pressure difference between alveolus and airway opening. The majority of adult patients are ventilated, at least initially, with a volume-preset mode (ie, ACV or IMV),1 allowing ready determination of the respiratory system mechanics. When a muscle-relaxed patient is mechanically ventilated at constant inspiratory flow, the inspiratory Pao consists of three components: one to drive gas across the inspiratory resistance, the second to expand the alveoli against the elastic recoil of the lungs and chest wall, and the third equal to the alveolar pressure present before inspiratory flow begins (PEEP or autoPEEP) (Fig. 48-1).
where Pao is the airway opening pressure, Pres is the resistive pressure component, Pel (Pel = Pplat − Total PEEP) is the elastic pressure term, Rrs is inspiratory resistance, ΔV is the increment in lung volume, Ers is elastance of the respiratory system, and Total PEEP is applied PEEP or autoPEEP, whichever is higher.
FIGURE 48-1
During constant flow, volume-preset ventilation of a passive patient, Pao is composed of resistive and elastic elements, the latter consisting of the end-expiratory pressure (PEEP or autoPEEP) and a component proportional to the change in volume and the respiratory system compliance. The second breath includes an inspiratory pause allowing determination of the components of Pao.
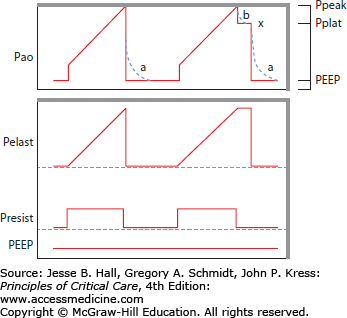
Diagnostic and therapeutic information can be gleaned by distinguishing the individual components of the peak Pao (Ppeak), as follows. First, PEEP is set on the ventilator and this value can be used when autoPEEP is absent. AutoPEEP is present, however, in most ventilated critically ill patients,2 and methods for quantitating it are described below. The Ppeak can be apportioned between its two remaining components, Pres and Pel, by stopping flow (end-inspiratory pause3) and allowing the Pres term to fall to 0. When flow is 0, Pao drops to a lower Pplat. Then:
The final component (Pel = Pplat − Total PEEP) is proportional to the elastance of the respiratory system and the tidal volume.
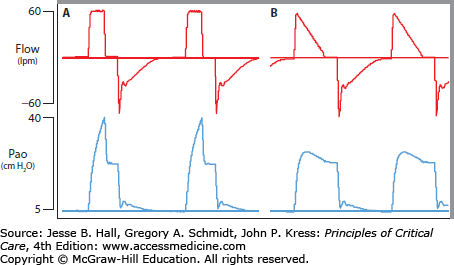
At normal inspiratory flow rates in the range of 1 L/s, Pres is typically between 4 and 10 cm H2O. Elevated Pres is found with high inspiratory flow or increased inspiratory resistance. At constant flow, a rise in Pres may indicate, for example, increased bronchospasm or partial endotracheal tube obstruction. Conversely, falling Pres may correspond to a response to bronchodilators. Because the Pres depends on ventilator flow rate, as well as inspiratory resistance, when interpreting its value, one must be careful to take the set flow rate into consideration. The most dramatic example of potential error in this regard is when the inspiratory flow is set to a decelerating profile (Fig. 48-2). Since Pel = ΔV × Ers, elevated Pel indicates excessive tidal volume or increased elastic recoil of the lungs or chest wall, as in pulmonary fibrosis, acute lung injury, or abdominal compartment syndrome. Respiratory system static compliance (Crs) is the inverse of Ers:
normally about 70 mL/cm H2O.
FIGURE 48-2
This is a passive patient with modest airflow obstruction ventilated with a volume-preset mode and square wave flow (panel A) at 60 lpm or decelerating flow (panel B) beginning at 60 lpm. A 0.4-second end-inspiratory pause is set in order to allow determination of Pplat. Notice that there is a significant difference between Ppeak and Pplat (40-22) during square wave ventilation but not during decelerating flow (27-22) because flow is so low during the later parts of the breath.
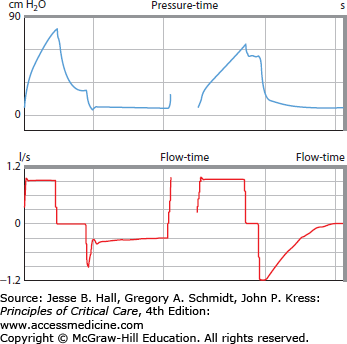
When the tidal volume is a typical 400 mL, Pel should be only about 6 cm H2O (400 mL/70 mL/cm H2O). Thus a ventilated healthy patient should have a Ppk of roughly 16 consisting of Pres (5 cm H2O), Pel (6 cm H2O), and applied PEEP (5 cm H2O). Oftentimes the cause of ventilatory failure has not been determined by the time of endotracheal intubation. If the Ppeak is not increased in a passive, ventilated patient, the physician should suspect impaired drive, neuromuscular weakness, or a transient, now resolved, problem (eg, upper airway obstruction bypassed by the endotracheal tube) as the cause for ventilatory failure. When the Ppeak is high, partitioning its components into the resistive pressure (Pres), the elastic pressure (Pel), and PEEP can aid the physician to narrow the differential diagnosis (Fig. 48-3; Table 48-1).
FIGURE 48-3
Both patients have elevated airway pressures. A brief pause inserted at end-inspiration reveals a striking difference between the two records: the left-hand tracing shows that Pao falls dramatically when flow is stopped, indicating elevated Pres (this patient had status asthmaticus); the right-hand tracing shows that Pao falls quite modestly, since Pel is elevated (this patient had a massively distended abdomen and abdominal compartment syndrome). Note also that expiratory flow differs substantially between the two, with low and prolonged expiratory flow in the left hand tracing.
Differential Diagnosis of Elevated Peak Airway Pressure
| Increased Pres | Increase Pel | Increased Total PEEP |
|---|---|---|
| High flow | High tidal volume | High applied PEEP |
| Bronchospasm | Chest wall | AutoPEEP |
| COPD | Kyphoscoliosis | Expiratory limb malfunction |
| Secretions | Rib deformity | |
| Kinked or obstructed tubing | Pleural disease | |
| Airway edema | Obesity | |
| Airway tumor/mass | Abdominal distention | |
| Airway foreign body | Lung | |
| Interstitial lung disease | ||
| Lung resection | ||
| Atelectasis | ||
| Pulmonary edema | ||
| Pneumonia | ||
| Mainstem intubation |
In addition, such analysis may allow therapy to be tailored specifically to the cause of ventilatory failure. For example, in a patient with COPD and congestive heart failure who fails extubation following colon resection, bronchodilators will not be helpful if Pres is normal and autoPEEP is zero. Similarly, if autoPEEP is greatly elevated, measures to decompress the abdomen are not likely to get the patient off of the ventilator.
The inspiratory pressure waveform during pressure-preset modes, such as PSV and PCV, reflects ventilator settings only and reveals nothing of the respiratory system physiology. These waveforms serve mostly to reveal the current ventilator settings as a snapshot (Fig. 48-4) or to demonstrate the impact of certain complex modes on ventilator actions (Fig. 48-5).
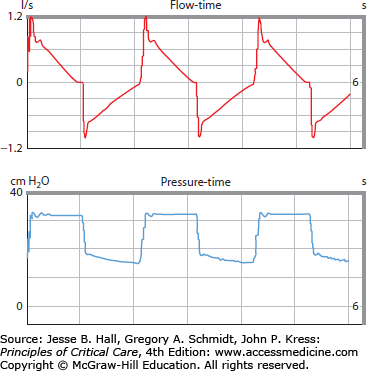
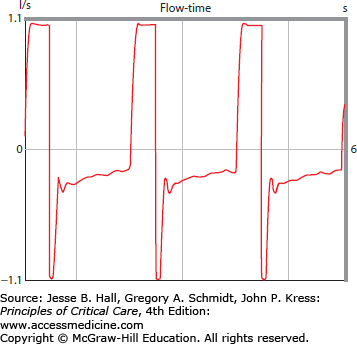
FIGURE 48-5
These waveforms of flow and pressure demonstrate the effect during pressure-regulated volume control mode of increasing the target tidal volume. Over the course of several breaths, pressure gradually rises, driving more flow and increasing the tidal volume, until the new tidal volume is reached.
During either volume-preset or pressure-preset ventilation, analyzing the expiratory pressure [Paw(ex)] is substantially less useful than the inspiratory pressure, since Paw(ex) is largely determined by characteristics of the mechanical ventilator, not the patient.
where PEEP is the applied PEEP (not autoPEEP), FlowE is expiratory flow rate, and Rexlimb is the resistance of the expiratory limb of the ventilator. It is important to realize that Paw(ex) does not reflect expiratory alveolar pressure or autoPEEP, and relates to the patient’s respiratory system only indirectly through the expiratory flow. Although some ventilators display inspiratory and expiratory pressure-volume plots, only the inspiratory segment gives useful information about the patient.
FLOW WAVEFORMS
Expiratory flow depends largely on patient features, such as end-inspiratory lung volume, lung elastic recoil, and characteristics of the airways, rather than ventilator settings. For this reason, expiratory waveforms can be analyzed without respect to mode of ventilation. Look again at Figure 48-3. Notice the striking difference in the expiratory flow between these two patients, the first having airflow obstruction, the second restriction.
The most valuable information to come from the expiratory flow tracing is evidence suggesting airflow obstruction, signaled by low or prolonged expiratory flow, often with flow at end-expiration. In addition, there may be two distinct components to the expiratory flow decay, rather than a single exponential one (Fig. 48-6), in patients with airflow obstruction.
FIGURE 48-6
Flow waveform in a patient with emphysema. The initial expiratory flow is quite high, but quickly falls off to a much lower (and abnormally low) flow rate, persisting until the next breath. These two components reflect initial airway collapse at the onset of expiration (high flow) followed by much lower flow driven by the reduced elastic recoil of the emphysematous lung.
Pressure-Preset Modes: It is more difficult to infer the mechanical properties of the respiratory system during pressure-preset ventilation than when using constant-flow, volume-preset ventilation, because flow (and, therefore, Pres) is continuously changing. Information regarding the combined respiratory resistance and elastance can be gained by examining the slope of the inspiratory flow waveform (Fig. 48-7). Assuming a passive patient, during PCV the flow falls throughout inspiration as the rising alveolar pressure reduces the driving pressure for flow (since the Pao is maintained constant by the ventilator). The rate of fall of the flow is related to how fast Palv rises, itself a function of the mechanical properties of the respiratory system. Thus resistance and compliance can be calculated from slope of the flow decay,4 but this is not measured readily at the bedside. Further, because the information it contains lumps features of elastance and resistance, it may be useful to turn patients from PCV to ACV periodically to determine the respiratory mechanics.
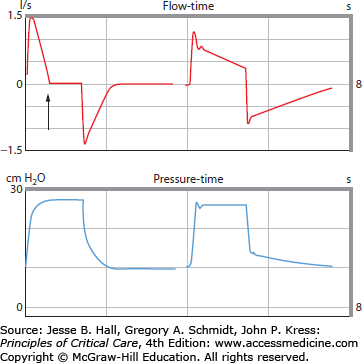
FIGURE 48-7
These two passive patients were ventilated with identical settings on PCV. The patient shown on the left had reduced lung compliance but normal airways while the patient on the right had normal compliance and increased airways resistance. The slope of the flow waveform reveals these mechanical differences. Note that flow ceases completely in the first patient (arrow) well before the ventilator cycles to the expiratory pressure.
Flow may or may not terminate before end-inspiration depending on the inspiratory time (Ti) and the time-constant of the respiratory system (Fig. 48-8). If inspiratory flow terminates in a passive patient, the peak alveolar pressure equals the ventilator PI. Flow waveform displays facilitate adjustments of TI and respiratory rate as discussed below.
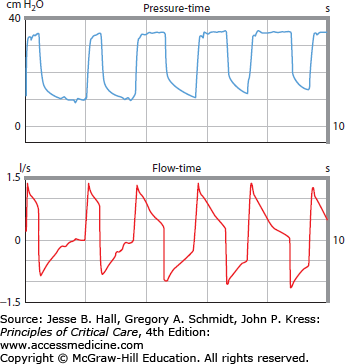
FIGURE 48-8
Pressure control ventilation as TI is progressively increased. The first two breaths are characterized by short TI and cessation of inspiratory flow well before Palv and PI are equal. Expiratory flow ceases just before the subsequent breaths, showing that the lung has returned to functional residual capacity. Increasing TI (2nd pair of breaths) lengthens the time of flow (thereby increasing tidal volume) but shortens TE sufficiently that there is now flow at end-expiration (ie, there is dynamic hyperinflation or autoPEEP). The final pair of breaths shows end-inspiratory cessation of flow (indicating that PI = Palv), but now TE is so short that dynamic hyperinflation worsens.
When patients are breathing spontaneously on PSV, thereby determining their own TI and rate, waveform analysis aids the identification of patient-ventilator asynchrony. This may be especially important during noninvasive ventilation (NIV). Common problems during NIV include failure of the ventilator to recognize the onset of patient inspiration (generally due to autoPEEP, as described below) and excessive TI (related to respiratory mechanics and the threshold at which inspiratory pressure switches off).5
Volume-Preset Modes: During ACV and SIMV, flow is set by the physician either directly or indirectly through the choice of minute ventilation and rate. Flow may also be altered by changes in rise time, inspiratory plateau, inspiratory to expiratory ratios, and other settings, depending on the particular ventilator in use. Flow waveforms can reveal the effects on flow of other setting changes, as discussed below, and also whether the flow profile (square, decelerating, or sine) has been inadvertently changed.
Related posts:


Stay updated, free articles. Join our Telegram channel

Full access? Get Clinical Tree


