INITIAL THERAPY
- If Sv̄O2 is low in association with a low CO, optimization procedures with fluids or inotropic agents should occur immediately. When titrating inotropic infusions, a lack of response (Sv̄O2 does not increase) suggests inadequate therapy. CO should be reassessed and treatment augmented.
- In cases of respiratory dysfunction, arterial saturation (SaO2) should respond to therapies such as increased fraction of inspired oxygen (FiO2) and positive end-expiratory pressure (PEEP) within 8 to 10 minutes. If SaO2 does not increase or if Sv̄O2 decreases, either respiratory therapy has been ineffective or CO may be compromised.
- After improvement in respiratory function, if the patient is receiving a high FiO2, the FiO2 may be decreased every 10 to 20 minutes if arterial and venous saturation remain stable. Increased difference in (SaO2 – Sv̄O2) usually correlates with a sudden decrease in CO.
- A decrease in the arterial-venous oxygen concentration difference (SaO2 – Sv̄O2) in response to measure to alter CO indicates a successful intervention.
PHYSIOLOGY OF OXYGEN TRANSPORT
The process of O2 transport includes loading O2 into the red blood cells (hemoglobin) and delivering it to the tissue by the heart (CO), as well as utilization of the O2 in the periphery and the return of deoxygenated blood to the right side of the heart. Several terms must be defined to understand the components of O2 transport (absolute values should be indexed to body surface area):
- Oxygen delivery (D.O2) is the volume of oxygen delivered (mL/min) from the left ventricle each minute:

Arterial content of oxygen (CaO2) is the mL of O2 in 100 mL of arterial blood:

Mixed venous content of oxygen (Cv̄O2) is mL of O2 in 100 mL of mixed venous blood:

where Pv̄O2 is the mixed pulmonary venous oxygen partial pressure.
- Oxygen demand is the cellular O2 requirement to avoid anaerobic metabolism. Oxygen demand is the amount of O2 required by the body tissues to function under conditions of aerobic metabolism. Because O2 demand is determined at the tissue level, it is difficult to quantify clinically.
- Oxygen consumption (V̇O2) is the amount of O2 consumed by the tissue, usually calculated by the Fick equation (Table 24.2):

| TABLE 24.2 Derivation of Sv̄O2 from Fick Equation | |
 | |
V̇O2 is a mechanism by which the body “protects” the O2 demand created at the tissue level. Increased V̇O2 in early stages of shock is associated with increased survival. Oxygen consumption may increase by increasing CO, widening the arterial–venous O2 content difference, or both. In the normal state, both CO and arterial–venous O2 difference may increase by about threefold, providing a total increase of V̇O2 during times of stress to about ninefold above the resting state. Normally, V̇O2 and O2 demands are equal; however, in times of great O2 demand or times in which either CO or arterial–venous O2 content difference cannot increase to meet the O2 demand of the cells, demand may exceed V̇O2. When this occurs, an O2 debt accumulates and anaerobic metabolism and lactic acidosis ensue (15).
- Oxygen uptake is the measured volume of O2 removed from inspired gas each minute (using indirect calorimetry/metabolic gas monitor). Oxygen uptake differs slightly from V̇O2 in that the latter is a calculated value (from the Fick equation) and the former is the measured volume of O2 taken up by the patient each minute. Oxygen uptake is measured by analyzing inspired and expired gas concentrations and inspired and expired volumes. Measurement of O2 uptake may be useful for metabolic studies in assessing variations in V̇O2 as well as determining caloric needs.
- Oxygen utilization coefficient (OUC) or extraction ratio (O2ER) is the fraction of delivered O2 that is consumed:
OUC or O2ER = V̇O2/D.O2
- Therefore, the OUC defines the balance between O2 supply (delivery) and demand (consumption) (Fig. 24.1).
- Oxygen transport is the process contributing to O2 delivery and oxygen consumption.

FIGURE 24.1 The physiology of oxygen transport and utilization.
ASSESSMENT OF OXYGEN TRANSPORT BALANCE
Oxygen transport balance may be assessed on several levels. First, examination of the patient may reveal signs of hypoperfusion, including altered mentation, cutaneous hypoperfusion, oliguria, tachycardia, and, when all compensatory systems have failed, hypotension. Unfortunately, these clinical signs are often late, nonspecific, and at times uninterruptible in critically ill patients. A more physiologic approach is to assess the determinants of O2 transport balance individually by using the Fick equation. The arterial–venous O2 content difference may be used to assess the relative balance between CO and V̇O2. An increase in the arterial–venous O2 content difference indicates that either flow is decreased or consumption is increased.
When the Fick equation is solved for Sv̄O2 (see Table 24.2), it becomes apparent that an inverse linear relation exists between Sv̄O2 and O2 utilization coefficients (11) if SaO2 is maintained constant. Sv̄O2 measured continuously is, therefore, an online indicator of the adequacy of the O2 supply and of the demand in perfused tissues. The determinants of Sv̄O2 are V̇O2, Hgb, CO, SaO2, and, to a small degree, PaO2. Sv̄O2 represents the flow-weighted average of the venous O2 saturations from all perfused tissues (Fig. 24.2). Therefore, tissues that have high blood flow but relatively low O2 extraction (kidney) will have a greater effect on Sv̄O2 than will tissues with low blood flow, although the O2 extraction of these tissues may be high (myocardium) (16,17).

FIGURE 24.2 Venous oxygenation saturations of various organs. (From Reinhart K, Rudolph T, Bredle DL, et al. Comparison of central-venous to mixed-venous oxygen saturation during changes in oxygen supply/demand. Chest. 1989;95(6):1216–1221.)

FIGURE 24.3 Variables that affect Sv̄O2. (Adapted from Rivers EP, Ander DS, Powell D. Central venous oxygen saturation monitoring in the critically ill patient. Curr Opin Crit Care. 2001;7(3):204–211.)
The interpretation of Sv̄O2 requires consistent and intact vasoregulation (5). When vasoregulation is altered—as in sepsis—O2 uptake may be severely altered, causing a marked increase in Sv̄O2. Septic patients can have a normal Sv̄O2 while the hepatic venous saturation can be up to 15% lower (18,19). This reduced O2 saturation was noted to arise from an increased regional metabolic rate rather than reduced perfusion. Flow-limited regional O2 consumption may potentially exist despite the presence of a normal Sv̄O2. Therefore, a normal Sv̄O2 should not be considered as sole criteria to ensure optimal O2 delivery in critically ill patients (Fig. 24.3) (20,21).
Although O2 demand cannot be measured, the relative balance between consumption and demand is best indicated by the presence of excess lactate in the blood. Lactic acidosis implies that demand exceeds consumption, or O2 supply dependency, and anaerobic metabolism is present (Fig. 24.4) (15,22,23). The relative balance between O2 supply and demand can be assessed by the OUC (1). Calculation of this coefficient, however, requires the measurement of CO, Hgb, SaO2, PaO2, Sv̄O2, and Pv̄O2; the latter, a reflection of both PaO2 and CO, is a better predictor of hyperlactatemia and death than either arterial PaO2 or CO alone. A Pv̄O2 below 28 mmHg is usually associated with hyperlactatemia and increased mortality (24). Blood lactate concentrations greater than 4 mmol/L are unusual in normal and noncritically ill hospitalized patients and warrant concern. In hospitalized, non-ICU, nonhypotensive subjects, as well as in critically ill patients, a blood lactate concentration greater than 4 mmol/L portends a poor prognosis (25). Since serum lactate is a global measurement, a normal lactate is not a guarantee that all tissue beds are adequately perfused.

FIGURE 24.4 The relationship of oxygen transport variables and lactate levels.
ARTERIAL VENOUS OXYGEN CONTENT DIFFERENCE
From the Fick principle, we learned that CO was equal to O2 consumption divided by arterial venous O2 content difference (CaO2 − CvO2). Even in the critically ill patient, it is unlikely that Hgb or total body O2 consumption can change sufficiently minute to minute to affect the calculations. Therefore, (Ca − v̄)O2 usually reflects changes in CO. In addition, immediate response to therapy—or lack thereof—can help tailor therapy more precisely and rapidly (26). Since the contribution of dissolved O2 is minute (0.0031 × PaO2), and the factor (Hgb × 1.39 mL O2/g Hgb) occurs in both sides of the equation, (Ca − v̄)O2 can be estimated by subtracting the values of pulse oximetry and continuous mixed venous oximetry (SaO2 − Sv̄O2).
INTRAPULMONARY SHUNT
Although PaO2 is affected by changes in respiratory function (intrapulmonary shunt), PaO2 is also affected by changes in CO if there is a moderate intrapulmonary shunt (≥20%). For example, if 20% of CO is not involved with gas exchange—a shunt—and blood goes to the left side of the heart deoxygenated, any decrease in Sv̄O2 will decrease PaO2. Thus, although no change in pulmonary function has occurred, a decrease in CO—or even any factor that decreases venous O2 content—lowers PaO2 and increases the alveolar-to-arterial O2 tension gradient (27). This nonpulmonary effect on PaO2 is important to understand since treatment of intrapulmonary shunt is to increase PEEP, which would be disastrous if low CO was the cause for low PaO2. The equation for intrapulmonary shunt is as follows:

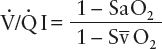
where Q.sp/Q.t is physiologic shunt (% of cardiac output), Cc is capillary oxygen content, Ca is arterial oxygen content, and Cv̄ is venous oxygen content. We can simplify the shunt equation by ignoring the calculation of Hgb-carried oxygen by dropping (Hgb × 1.39) and substituting saturations of 100% for the pulmonary capillary saturation, pulse oximetry for arterial content, and mixed venous oximetry for venous content. The entire equation for pulmonary capillary content can be replaced by the term 1 (or 100% Hgb saturation). Because we have already substituted Sa for arterial content and Sv̄ for venous content, this estimation of physiologic shunt (the (V./Q. I) can be represented by Eq. [28]:
For instance, if arterial saturation were 90% (or 0.9) and venous saturation were 60% (or 0.6), the Qs/Qt calculation would be

This estimation does not reflect the severity of respiratory failure as judged by the need to use, potentially, a higher FiO2; thus, the equation needs to specify the patient’s FiO2 to be meaningful.
THE CONSEQUENCES OF TISSUE HYPOXIA
When compensatory mechanisms such as increased systemic O2 extraction are exceeded, tissue hypoxia results with pathologic significance not only seen in vitro (4); low Sv̄O2 is associated with the generation of inflammatory mediators and the impairment of mitochondrial O2 use (29). The accumulation of global tissue hypoxia over time leads to O2 deficits; the magnitude and duration of this O2 debt has been associated with the generation of inflammatory biomarkers, morbidity, and mortality (Fig. 24.5) (8,29–33). Monitoring the Sv̄O2, therefore, provides early and continuous data that may be acted upon immediately rather than waiting for laboratory results or markers of tissue hypoxia that signify an insult which has already occurred.
MONITORING OXYGEN TRANSPORT
Critically ill patients in the emergency department (ED), operating room (OR), and intensive care units (ICUs) may be grouped into three categories. Category 1 consists of patients requiring intensive observation or monitoring. These patients may have major risk factors or may be admitted because of the nature of their illness or the nature of the therapy they are receiving. Category 2 patients require intensive nursing care and often specialized technology and care facilities to direct therapy for major systemic illness. Category 3 patients need continuous physician intervention for hemodynamic and other instabilities. Continuous venous oximetry may have clinical applications in each of these broad classes of patients. The three major objectives of monitoring critically ill patients are to ensure that the patient is stable, to provide an early warning system regarding untoward events, and to evaluate the efficiency and efficacy of interventions performed.
Category 1 patients undergoing hemodynamic and O2 transport monitoring only because of underlying risk factors, who have a normal and stable Sv̄O2, have an intact balance between O2 supply and demand. Further assessment of CO and arterial and mixed venous blood gas analysis to reach that conclusion can be eliminated, and there is “safety in no (other) numbers.” If the patient becomes unstable as manifested by a decreasing Sv̄O2, the monitoring system will meet the second objective by providing an early warning of the imbalance in O2 supply and demand. In this situation, although an alert has been given, the cause of the O2 transport imbalance is not necessarily clear. The change in Sv̄O2 is sensitive but not specific. In this clinical situation, it may be necessary to measure CO, SaO2, and Hgb. When the cause of the imbalance is identified, specific therapy may be instituted to restore the O2 supply–demand balance. While interventions are applied, the continuous assessment of supply–demand balance may be used to evaluate the efficacy of the intervention with instant feedback. Continuous CO methodology should supplement but not supplant mixed venous oximetry. This is particularly important in critical illness, defined as a nonsteady state, when changes in all elements of O2 transport and use can be expected (33).
CONTINUOUS MIXED VENOUS MONITORING
Sv̄O2 can be monitored continuously using infrared oximetry, based upon reflection spectrophotometry. Light is transmitted into the blood, and reflected off red blood cells and read by a photodetector in the receiving fiber-optic bundle (11). The amount of light reflected at different wavelengths varies depending on the concentration of oxyhemoglobin and hemoglobin (Fig. 24.6). The microprocessor uses the relative reflectances to calculate the oxyhemoglobin and total Hgb, the fraction of which represents Sv̄O2. The catheter used to measure venous O2 saturation can be a pulmonary artery or a modified central venous catheter.

FIGURE 24.5 The concepts of oxygen debt (30–32).

FIGURE 24.6 The technology of spectrophotometry. (Adapted from Rivers EP, Ander DS, Powell D. Central venous oxygen saturation monitoring in the critically ill patient. Curr Opin Crit Care. 2001;7(3):204–211.)
The continuous oximetry system must be calibrated before use by a co-oximetry measured sample (34). This may be done in vitro by positioning the catheter tip next to a target that reflects the transmitted light in such a manner that the microprocessor can be calibrated. After in vitro calibration, the O2 saturation of the central venous system, right atrium, right ventricle, and PA can be measured while the catheter is being floated into the proper position. These measurements during the insertion of the catheter may be useful to rule out intracardiac left-to-right shunts.
Once the PAC—if this is the tool used—is in proper position, blood may be sampled through the distal port to calibrate or to verify the calibration of the system. The first in vivo calibration is usually done at 24-hours post-PAC insertion. A mixed venous sample is withdrawn and analyzed by laboratory co-oximetry. Blood drawn from the PA should be aspirated slowly (1 mL over 20 seconds) to prevent contamination by the highly oxygenated pulmonary capillary blood. The value obtained by the microprocessor at the time the blood sample is drawn is retained by the system. This may be compared against the value obtained from the laboratory sample, and, if a significant (>2%) difference exists, the instrument may be recalibrated to the laboratory co-oximeter value. The calibration should be verified at any time the optical module is disconnected from the catheter, whenever the measurement is suspected of being erroneous, and every 24 hours to ensure stability of the system.
Because it is crucial that red blood cells be flowing past the tip of the catheter, proper positioning in the PA is necessary. Distal migration of the PA catheter tip is a common source of error. When the catheter tip advances into the distal segments of the PA, a high or increased Sv̄O2, a decreased light intensity signal, or damping of the PA tracing may become evident. If these signs are encountered, the distal lumen of the catheter should be irrigated with flush solution to remove fibrin on the catheter tip. If the pressure waveform is not restored to a proper PA tracing by irrigation, the catheter should be slowly withdrawn until the PA pressure tracing is restored. At this point, the PAC balloon may be slowly inflated until the pulmonary artery occlusion pressure (PAOP) tracing is observed. If this tracing is not produced by inflation of the balloon to maximum volume (1.5 mL), the catheter should be slowly advanced until an occlusion pressure tracing is observed. At that point, the balloon can be deflated again and then slowly reinflated until a PAOP tracing occurs. The volume required to restore this tracing should be at least 75% of the total capacity of the balloon. Using the maximum balloon volume to attain a PAOP tracing ensures that the catheter is in the proximal section of the PA and is, in fact, a physiologic confirmation of the catheter tip position.
Distal migration of the PAC may cause artifactually high O2 saturation because highly saturated (approximately 100%) pulmonary capillary blood is sampled. The catheter tip may be lodged against a vessel wall or bifurcation, causing an alteration in the light intensity received by the fiber-optic bundles. A low-light intensity alarm must be corrected before the venous saturation measurement is considered reliable or before the system is recalibrated. Large fluctuations in the light intensity signal may indicate that the catheter tip is malpositioned but also may indicate a condition of intravascular volume deficit that allows compression or collapse of the pulmonary vasculature, especially during positive pressure ventilation (35).
CONTINUOUS CENTRAL VENOUS MONITORING
Early management of the critically ill patient is frequently performed outside the ICU. The time between the onset of critical illness and definitive ICU intervention may be prolonged and have outcome implications (36–38). Measurement of Sv̄O2 requires placement of a PAC, which may not be feasible early in the resuscitation of adult, pediatric, and neonatal patients. However, central venous assess can be obtained in both ICU and non-ICU settings, making continuous ScvO2 monitoring a convenient surrogate for Sv̄O2.
Numerous animal and human models have examined the relationship between Sv̄O2 and ScvO2 obtained from the superior vena cava (SVC) and right atria (RA) (Fig. 24.7). SVC ScvO2 is slightly lower and more accurately reflects Sv̄O2 when patients are not in shock (39,40). The lower value of ScvO2 in a nonstressed state can be explained by the low O2 extraction of the kidneys which drain into the IVC and contribute to the Sv̄O2 but not the ScvO2 (41). RA ScvO2 has a better correlation than SVC saturation and is not significantly different from Sv̄O2 whether in shock or not (39). In patients in shock, a consistent reversal of this relationship occurs, with the ScvO2 being greater than Sv̄O2; this difference can range from 5% to 18% (39,40,42). Redistribution of blood flow away from the splenic, renal, and mesenteric bed toward the cerebral and coronary circulation, including more desaturated blood (<30%) from the coronary sinus contribute to this observation (39). Thus, ScvO2 will consistently overestimate the true Sv̄O2 under shock conditions. An interesting variation on this concept was recently demonstrated in liver transplant patients. A study of 30 patients undergoing liver transplant, in which samples from the RA and pulmonary artery were taken at several points during the procedure, found that the central venous and mixed venous O2 saturation measurements were only concordant during the hepatectomy phase of the procedure and differed once the graft was in place. The proposed mechanism behind this finding is that increased V̇O2 of the graft after reperfusion, causes the Sv̄O2 to decrease relative to the ScvO2, which is relatively unaffected by this change (43).

FIGURE 24.7 Central versus mixed venous oxygen saturation.
There has been considerable debate regarding whether ScvO2 is a satisfactory substitute for Sv̄O2, particularly in ranges above 65% (44–53). Although the absolute values of ScvO2 and Sv̄O2 differ, studies have shown close and consistent tracking of the two sites across a wide range of hemodynamic conditions (Figs. 24.8 and 24.9), thus making it clinically useful (46,54–66). The clinical utility or value of Sv̄O2/ScvO2 is in the lower ranges. The presence of a pathologically low ScvO2 value—implying an even lower Sv̄O2—is more clinically important than whether the values are equal. Goldman et al. (54) found that ScvO2 below 60% showed evidence of heart failure or shock or a combination of the two. Hyperdynamic septic shock ICU patients seldom exhibit Sv̄O2 levels <60% to 65%, which, if present and sustained, are associated with increased mortality (12,67). Studies examining the clinical utility of ScvO2 early in the course of disease presentation routinely encounter values less than 50%, which are considered critical (3,68,69). At these values, venous saturations are actually 5% to 18% lower in the pulmonary artery (39,42) and 15% lower in the splanchnic bed (20). Thus, although not numerically equivalent, these ranges of values have similar pathologic implications (54) and are associated with high mortality (24). Conversely, it has also been reported that patients with an ScvO2 > 90% also had increased mortality (70); this can be explained by cellular injury resulting in lack of oxygen consumption.

FIGURE 24.8 Central versus mixed venous oxygen saturation. (Adapted from Reinhart K, Rudolph T, Bredle DL, et al. Comparison of central-venous to mixed-venous oxygen saturation during changes in oxygen supply/demand. Chest. 1989;95(6):1216–1221.)
The clinical utility of an end point of resuscitation is determined by whether it changes clinical practice and morbidity or mortality. Irrespective of whether the ScvO2 equals Sv̄O2, the presence of a low ScvO2 in early sepsis portends increased mortality and correcting this value by a treatment algorithm (71) improves morbidity and mortality. The concept of the approximately 5% numeric difference between Sv̄O2 and ScvO2 (13) prompted the Surviving Sepsis Campaign to recommend reaching a Sv̄O2 of 65% and/or ScvO2 of 70% goal in the resuscitation portion of its severe sepsis and septic shock bundle (72,73). An ScvO2 value of less than 70% has also been demonstrated to suggest a need for blood transfusion when accompanied by a hemoglobin of less than 10 g/dL and a central venous pressure (CVP) of 8 to 12 mmHg (13).
INTERPRETATION OF VENOUS OXYGEN SATURATION
The algorithm is presented in Figure 24.10. Mixed venous O2 saturation values within the normal range (65% to 75%) indicate a normal balance between O2 supply and demand, provided that vasoregulation is intact and a normal distribution of peripheral blood flow is present. Dysoxia usually develops when Sv̄O2 decreases to 40% to 50%, though it may occur at higher values if oxygen extraction is impaired (13). Values of Sv̄O2 greater than 75% indicate an excess of D.O2 over V̇O2 and are most commonly associated with syndromes of vasoderegulation, such as cirrhosis and sepsis. High values also are seen in states of low V̇O2—hypothermia, muscular paralysis, sedation, coma, hypothyroidism, or a combination of these factors—hyperoxygenation, high CO, inability to consume O2 and, rarely, cyanide toxicity.
Uncompensated changes in any of the four determinants of Sv̄O2 may result in a decrease in the measured value, but in complex, critically ill patients, the correlation between changes in Sv̄O2 and changes in any of the individual determining factors is low (74). In a study of the patients in a surgical ICU, no statistical correlation existed between changes in either PaO2 or SaO2 and Sv̄O2. Although there was a statistically significant correlation between changes in Sv̄O2 and CO and D.O2, the coefficients of determination (r2) were too low to allow prediction of CO, V̇O2, or D.O2, from Sv̄O2. Also, no statistical correlation existed between Sv̄O2 and either arterial–venous O2 content difference or calculated V̇O2. There was a significant inverse correlation between Sv̄O2 and O2 utilization coefficients, confirming the accuracy of the measurement and the reliability of Sv̄O2 as an estimation of the O2 utilization ratio—as long as SaO2 is near 100%. The determinants of Sv̄O2 are multifactorial, and, in critically ill patients, the degree of compensation for changes in one variable cannot be predicted (74). Patients with chronically impaired O2 transport appear to tolerate very low Sv̄O2 values better than acutely ill patients, presumably due to adaptive changes in the former group. Delayed lactate presentation may be seen in this group of patients (75,76).

FIGURE 24.9 Central versus mixed venous oxygen saturation. HES, hydroxyethyl starch. (Adapted from Reinhart K, Rudolph T, Bredle DL, et al. Comparison of central-venous to mixed-venous oxygen saturation during changes in oxygen supply/demand. Chest. 1989;95(6):1216–1221.)
It is useful, however, to appreciate the magnitude of change in Sv̄O2 that would occur with an isolated change in any of the individual determinants. The relationship between the variables that contribute to Sv̄O2 may not be linear (77). If no compensatory changes occur in V̇O2 or CO, Hgb must decrease by almost 50% (13 to 7.5 g/dL/L) before Sv̄O2 decreases below the lower limit of the normal range (Table 24.3). The Sv̄O2 changes would be even smaller because CO should increase in response to the acute anemia. However, if CO is fixed because of underlying cardiovascular disease, a decrease in Hgb will be reflected by a decrease in Sv̄O2. Similarly, a small change in a patient with a low CO will have a greater effect on Sv̄O2 than a larger change in a patient with a high CO (77).
The effect of arterial O2 tension on Sv̄O2 in the absence of other compensatory changes is demonstrated in Table 24.4. As long as SaO2 is maintained in a relatively normal range, the direct effect on Sv̄O2 is minimal. However, when there is sufficient arterial hypoxemia to produce arterial desaturation, the Sv̄O2 falls in direct proportion to the change in SaO2. Similarly, changes in CO (Table 24.5) and V̇O2 (Table 24.6) may be shown to affect Sv̄O2, although the magnitude of change in any of these individual parameters does not predict the magnitude of change in Sv̄O2 because compensatory factors are usually involved. A decrease in Sv̄O2 greater than 10% is likely to be clinically significant regardless of the initial value. A change from 70% to 60% may be associated with a large fractional change in CO if other factors did not change. On the other hand, a change from 60% to 50% is associated with a much smaller fractional change in CO but in the range of limited O2 transport reserve and should raise more concern (Table 24.7).

FIGURE 24.10 Diagnostic algorithm of ScvO2/Sv̄O2.
| TABLE 24.3 Effect of Changes in Hemoglobin Concentration on Sv̄O2 |
 |
When demand exceeds consumption, anaerobic metabolism must occur, and the eventual result is lactic acidosis. The lactate level, therefore, defines the balance between V̇O2 and O2 demands. An elevated lactate implies either ongoing anaerobic metabolism (shock) or prior anaerobic metabolism and O2 debt. A normal Sv̄O2 implies the latter and a low Sv̄O2, the former, in states of lactic acidosis, except in situations in which unloading cellular uptake or mitochondrial utilization are impaired.
CLINICAL USES OF MONITORING
ScvO2 values have been used extensively in various clinical scenarios in critically ill patients. These include during and after cardiac arrest (CA) (78,79), in cardiac surgery patients (80), during and after cardiac failure (81), shock (82), acute myocardial infarction (54,84), general medical ICU conditions (85–87), postoperative cardiovascular procedures (87), trauma (88–90), vascular surgery (91,92), septic shock (9,12,67), hypovolemia (93,94), pediatric surgery (81), in neonates (95), lung transplantation (96), liver transplant (43), cardiogenic shock (97,98) and ECMO (99).
Cardiac Arrest
Management of the CA patient by advanced cardiac life support (ACLS) guidelines include physical examination (i.e., palpation of a pulse) and electrocardiographic monitoring. ScvO2 monitoring during CA has been shown to be a diagnostic and therapeutic adjunct (100–102); CA patients routinely have ScvO2 values of 5% to 20% during cardiopulmonary resuscitation (CPR). Failure to reach an ScvO2 of at least 40% during the management of CA carries a 100% mortality even if the patient has an intermittent measurable blood pressure. These values are consistent with animal models (Sv̄O2 < 43%) using cardiopulmonary bypass (103). ScvO2 has also been used to confirm the presence or absence of sustainable cardiac activity during electromechanical dissociation (EMD) or a pulseless idioventricular rhythm where over 35% of these patients have been shown to have spontaneous cardiac activity (pseudo-EMD) (104). If the ScvO2 is greater than 60% during CPR, return of spontaneous circulation (ROSC) is likely, and the pulse should be frequently rechecked if EMD was present. Between ScvO2 values of 40% and 72%, there is a progressive increase in the rate of ROSC. When an ScvO2 greater than 72% is obtained, ROSC has likely occurred. Continuous ScvO2 monitoring also provides an objective measure to confirm the adequacy or inadequacy of CPR in providing D.O2.
| TABLE 24.4 Effect of Variation in PaO2 on Sv̄O2 |
 |
Related posts:


Stay updated, free articles. Join our Telegram channel

Full access? Get Clinical Tree


