Key Clinical Questions
How does the resting electrocardiogram (ECG) assist in the diagnosis and management of acute coronary syndrome (ACS)?
What are the key differentiating electrocardiographic features of ACS versus acute pericarditis and versus early repolarization?
How does the ECG assist in the diagnosis of acute pulmonary embolism?
How does the ECG assist in determining the cause of syncope?
What are the characteristic ECG findings of electrolyte disturbances?
What are the characteristic ECG findings of hypothyroidism, stroke, and drug effects?
Introduction
A graphic recording of electrical potentials generated by the heart, the electrocardiogram is the most commonly performed cardiovascular laboratory procedure in the United States. As a noninvasive, versatile, reproducible, and inexpensive test, the ECG has utility in the evaluation of a range of signs and symptoms encountered by the hospitalist, including acute chest discomfort, breathlessness, syncope, and palpitations. While the ECG is useful in the detection of myocardial ischemia, arrhythmias, structural changes of the myocardium, and conduction system disease, clinicians should also be able to recognize normal variants that may mimic cardiac disease and electrocardiographic manifestations of noncardiac illness. Guidelines for the use of electrocardiograms in patients with and without preexisting heart disease have been published by the American College of Cardiology and American Heart Association (ACC/AHA) and have changed little in recent years. An understanding of the clinical context and availability of prior electrocardiograms for comparison improves diagnostic accuracy when interpreting electrocardiograms.
The Normal Resting Electrocardiogram
The electrocardiogram is a graphical recording of the difference in potential between electrodes placed on the body surface. Twelve conventional leads that generate such a recording include the six extremity (limb) and six chest (precordial) leads. The chest leads (V1–V6) record electrical activity in a horizontal plane, and the limb leads (bipolar leads I, II, and III; and unipolar leads aVR, aVL, and aVF) record potentials transmitted on the frontal plane. Right-sided precordial leads (V1R–V6R) and electrode locations posterior to V6 (V7–V9) may be useful in the assessment of right ventricular and posterior-lateral infarctions, respectively. If a wave of depolarization spreads toward the positive pole of a lead, a positive deflection is recorded in that lead. Conversely, if a wave of depolarization spreads toward the negative pole of a lead, a negative deflection is recorded in that lead. The components of the normal resting electrocardiogram are the P wave, generated by atrial contraction; the PR interval, representing conduction through the AV node; the QRS complex, generated by biventricular contraction; and the ST-T wave, reflecting biventricular recovery.
Acute Chest Discomfort
The initial diagnostic evaluation of the patient with acute chest discomfort centers on the recognition of life-threatening conditions, including acute coronary syndrome and pulmonary embolism.
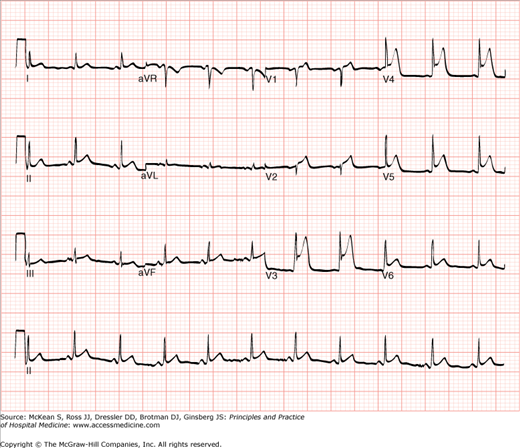
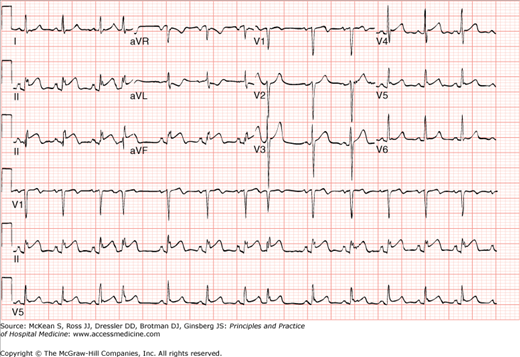
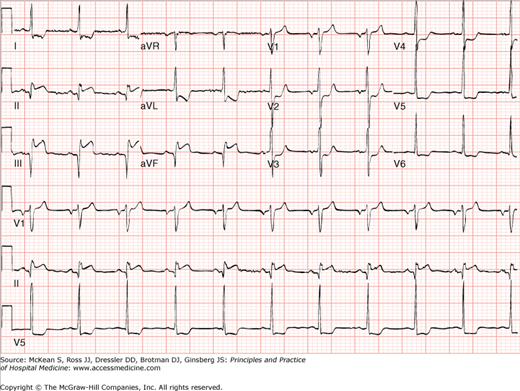
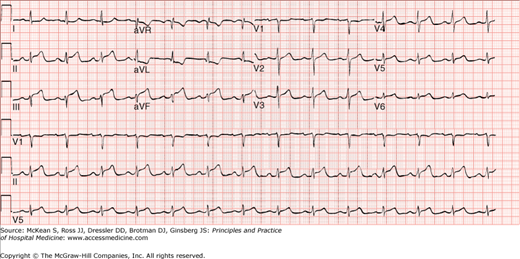
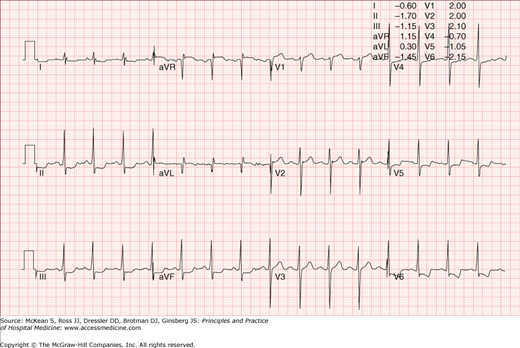
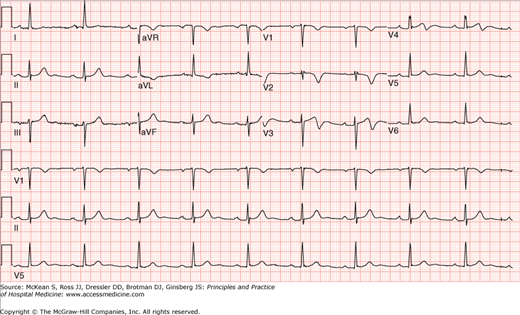
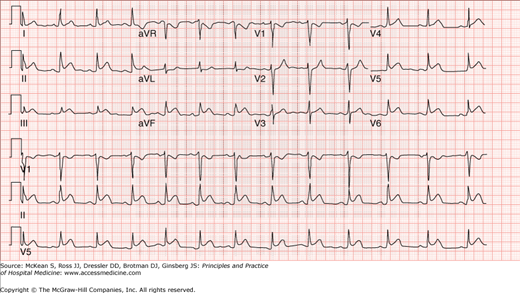
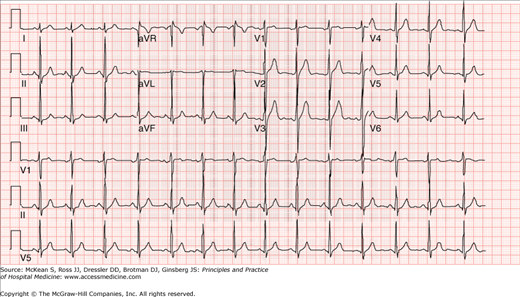
Electrocardiography is an indispensable tool in the diagnosis and management of acute coronary syndromes (ACS). Deviation of the ST-segment is generally the earliest electrocardiographic manifestation of myocardial injury. Elevation of the ST-segment is produced over the ischemic zone when acute ischemia is transmural and may be preceded by the appearance of tall, positive, hyperacute T waves and accompanied by often prominent reciprocal STsegment depressions on leads overlying the contralateral surface of the heart. Within a period of hours to days, electrocardiographic changes evolve with T-wave inversions and Q-wave formation in the leads that demonstrated ST-segment elevations (Figures 102-1, 102-2, and 102-3).
Chest pain Acute Myocardial infarction
Prior Myocardial infarction
Early repolarization syndrome
Acute pericarditis
Pericardial effusion
|
Patterns of ST-segment elevations may be useful in localizing the region of involved myocardium and may suggest the site of occlusion within the coronary arterial tree (Table 102-1).
| Region(s) of Myocardium Affected | Location of Culprit Stenosis or Lesion(s) | Electrocardiographic Changes |
|---|---|---|
| Anterolateral wall and septum | Proximal left anterior descending artery | ST-segment elevations in leads V1–V6 and limb leads I and aVL with reciprocal ST-segment depressions in limb leads III and aVF |
| Anterior and inferior walls | “Wrap around” left anterior descending artery that extends onto the inferior wall or multivessel disease | ST-segment elevations in leads V1–V6, accompanied by ST elevations in limbs leads II, III, and aVF |
| Inferior | Right coronary or circumflex arteries | ST-segment elevations in limb leads II, III, and aVF (and greater in lead III than lead II), along with elevation in lead V1 suggestive of occlusion of proximal or mid-right coronary artery. |
| Posterior wall | Right coronary or circumflex arteries | ST-segment depressions in leads V1 and V2 with eventual appearance of prominent R waves. Posterior leads V7–V9 (V7, posterior axillary line; V8, posterior scapular line; and V9, left border of spine) may show ST-segment elevations. |
| Right ventricle | Right coronary artery | ST-segment elevations in V1R–V6R (particularly V4R) and limb leads II, III, and aVF, along with reciprocal ST-segment depressions in limb leads I and aVL |
Pathophysiologically, ST-segment elevations do not necessarily signify atherosclerotic plaque rupture and occlusive intraluminal thrombus formation. In fact, transient ST-segment elevations may indicate vasospasm from sympathomimetic effects (Figure 102-4).
When ischemia is primarily subendocardial, ST-segment depressions appear in the overlying leads (Figure 102-5).
Although hyperacute T waves may precede or accompany ST-segment elevations, inversion of the T wave or pseudonormalization of previously inverted T waves may also indicate ischemia. Deep and symmetrically inverted T waves in the anterior precordial leads, in particular, may indicate high-grade stenosis in the proximal left anterior descending artery, an exception to the rule that leads in which T-wave inversions are present do not correlate with the location of coronary stenoses (in contrast to localization allowed by ST-segment elevations or pathologic Q waves) (Figure 102-6).
Figure 102-6
Prominent and new T-wave inversions in the anterior precordial leads (a.k.a. Wellen sign) may indicate a high-grade proximal stenosis within the left anterior descending artery. This 70-year-old gentleman had a 90–95% thrombotic and ulcerated obstructive lesion within the left anterior descending artery.
Symmetric giant T waves (amplitude > 10 mm in two or more leads) may be associated with pericarditis, pheochromocytoma, severe aortic insufficiency, myocarditis, and cerebrovascular disease. Commonly inverted in all precordial leads at birth, T waves may remain inverted in the right precordial leads in normal persons in a persistent juvenile pattern. Inversion of the T waves may also be normal in leads III, aVR, and V1.
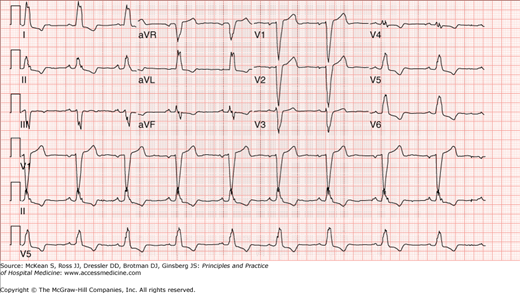
While a normal ECG throughout the course of an acute infarct is uncommon, the ECG has limited sensitivity and specificity in the diagnosis of acute coronary syndromes. Clinicians should recognize that changes in the ST-segment and T wave are not specific for myocardial ischemia and/or infarction and should, in particular, distinguish the changes associated with acute pericarditis and the normal variant of early repolarization from those seen with myocardial ischemia and infarction. In contrast to the regional ST-segment elevations created by myocardial infarction, acute pericarditis creates diffuse ST-segment elevations, often in the presence of PR segment elevation in aVR and reciprocal PR segment depressions in the other leads (Figure 102-7).
Also in contrast to the appearance of T-wave inversions while the ST-segments remain elevated, T-wave inversions in acute pericarditis generally do not develop until the ST-segments have returned to isoelectric baseline. The electrocardiographic signature of early repolarization is ST-segment elevation, especially in the midprecordial leads and more commonly at slow heart rates and among young adult men (Figure 102-8).
Figure 102-8
The ST-segment elevation of early repolarization may mimic acute ischemia. In contrast to the convexity seen in ST-segment elevations associated with myocardial ischemia, ST-elevations seen with early repolarization are generally concave in form and associated with notching of the R wave at its junction with the QRS complex, as in this tracing from a healthy 23-year-old gentleman. During exercise, the ST-segment elevations of early repolarization may return to baseline.
In contrast to the convexity seen in ST-segment elevations associated with myocardial ischemia, those seen with early repolarization are generally concave in form and associated with notching of the R wave at its junction with the QRS complex. Biphasic T-wave inversions may also accompany the ST-segment elevations seen with early repolarization.
Among patients with acute coronary syndrome, the electrocardiogram also offers utility in the recognition of ischemia-related benign and malignant arrhythmias and postinfarct complications. Accelerated idioventricular rhythm (AIVR) is a regular wide-complex ventricular rhythm, generally at a rate of 50–100.
Ventricular aneurysm may be suggested by ST-segment elevations that persist despite reperfusion.
New left bundle branch block (LBBB) in the setting of symptoms consistent with acute MI may indicate a large, anterior wall acute MI (Figure 102-9).
With preexisting LBBB, the diagnosis of acute STEMI may be obscured, but the presence of the following may be suggestive of acute ischemia: ST-segment elevation ≥1 mm concordant with the QRS complex; ST-segment depression ≥mm in lead V1, V2, or V3; or ST-segment elevation ≥5 mm discordant with the QRS. Right bundle branch block (RBBB) may obscure the diagnosis of an acute anterior MI by interfering with the interpretation of ST-segment elevations in leads V1-3, but the pseudonormalization of the normally discordant T waves (ie, normally opposite the terminal deflection of the QRS complex) may suggest acute ischemia. Because RBBB itself may produce a large R wave in V1, it is generally difficult to diagnose a posterior infarct in the presence of a RBBB.
Pulmonary embolism ECG in pulmonary embolism is clinically helpful mainly in patients with no history of heart or lung disease.
Stay updated, free articles. Join our Telegram channel
Full access? Get Clinical Tree
 Get Clinical Tree app for offline access

|
