KEY POINTS
Left ventricular (LV) stroke volume (SV) creates arterial pulse pressure (PP) by distending conducting vessels during systole, and systemic vascular resistance (SVR) preserves diastolic pressure (DP) by impeding SV from flowing through arterioles during diastole.
This coupling of ventricular and vascular elements allows rapid clinical separation of hypotensive patients into those with increased SV and cardiac output (˙Qт) demonstrating bounding pulses with large PP, low DP, and warm digits (low SVR, high ˙Qт hypotension, or septic shock) from those who demonstrate thready pulses with small PP and cool digits signaling low SV and ˙Qт with increased SVR, as in cardiogenic or hypovolemic shock.
LV pumping function is described by relating LV end-DP as estimated by pulmonary wedge pressure (Ppw) to SV; LV dysfunction is signaled by increased Ppw and decreased SV and may be due to systolic or diastolic dysfunction.
Systolic dysfunction, or decreased contractility, connotes increased LV end-systolic volume for a given LV end-systolic pressure that is approximately the mean blood pressure (BP); common causes of acute systolic dysfunction in critical illness are myocardial ischemia, hypoxia, acidosis, sepsis, intercurrent negative inotropic drugs (β or calcium blockers), and acute-on-chronic systolic dysfunction in cardiomyopathies.
Diastolic dysfunction connotes decreased LV end-diastolic volume despite increased Ppw because the heart cannot fill normally; common causes of diastolic dysfunction in critical illness are pericardial tamponade or constriction, positive end-expiratory pressure (PEEP), or other causes of increased pleural pressure as in pneumothorax, pleural effusion, or abdominal distention, ventricular interdependence in acute right heart syndromes, and chronic LV stiffness as in LV hypertrophy.
Early differentiation between diastolic and systolic dysfunctions in critical illness is aided by a questioning approach and dynamic imaging such as echocardiography; this avoids inappropriate and ineffective therapy for the wrong etiology of LV dysfunction.
Venous return (VR) to the right atrium is controlled by mechanical characteristics of the systemic vessels (unstressed volume, vascular capacitance, vascular volume); together these determine the mean systemic pressure (Pms) responsible for driving VR back to the right atrium (Pra) through the resistance to VR.
For a given Pms, VR increases as Pra decreases to define the VR curve of the circulation, whereas SV and ˙Qт from the heart increase as Pra and preload increase to define the cardiac function curve that intersects the VR curve at a unique value of Pra where VR=˙Qт.
When ˙Qт is insufficient, volume infusion, baroreceptors, or metabolic receptors can increase Pms to increase VR and Pra; this effect is mimicked by venoconstricting drugs such as norepinephrine or phenylephrine; alternatively, VR can be increased by positive inotropic (dobutamine) or afterload-reducing (sodium nitroprusside, fenoldopam) drugs that decrease Pra by enhancing cardiac function.
In hypovolemic shock, hemostasis and volume resuscitation are essential, whereas arteriolar constricting agents such as norepinephrine may be used briefly to provide a window of higher BP; in septic shock, considerable volume resuscitation is needed due to nitric oxide–mediated venodilation and decreased Pms, positive inotropic agents such as dobutamine treat the myocardial depression, and arterial vasoconstrictors such as norepinephrine may be needed to maintain BP despite high ˙Qт due to very low SVR.
In cardiogenic shock, preload reduction (morphine, nitroglycerin, furosemide) is effected by venodilation and decreased Pms, but VR often increases because cardiac function improves to decrease Pra; arterial dilating drugs often increase ˙Qт from the injured LV, so BP may even increase despite impaired contractility and ˙Qт without increasing myocardial O2 consumption when heart rate does not increase.
Early airway control and continuous mechanical ventilation decrease oxygen consumption and prevent respiratory acidosis but may decrease VR further in hypovolemic patients by raising pleural pressure and Pra; in cardiogenic shock, continuous mechanical ventilation and PEEP have less effect on VR and may increase ˙Qт by decreasing LV afterload.
Cardiogenic and low-pressure pulmonary edema are decreased by decreasing Ppw, and ˙Qт and oxygen delivery can be maintained at low Ppw with vasoactive drugs and blood transfusion; arterial oxygenation can be supported with PEEP without decreasing ˙Qт and oxygen delivery by effecting PEEP and tidal volumes that achieve 90% O2 saturation of an adequate hematocrit on a nontoxic fraction of inspired O2 without profound acidosis.
This chapter reviews several essential concepts of normal cardiovascular function as a basis for approaching and correcting disturbed circulation in critical illness. It begins with a discussion of left ventricular (LV) pumping function and an approach to ventricular dysfunction. Then follows a review of the mechanisms by which the venous return (VR) to the heart is controlled by the systemic vessels as a basis for diagnosis and treatment of hypoperfusion states. The pulmonary circulation and factors governing lung liquid flux are described through measurements obtained by right heart catheterization to provide an approach to treating pulmonary edema without compromising adequate peripheral perfusion. Along this discussion pathway, common mechanical interactions between respiration and circulation are highlighted as a basis for understanding the cardiovascular diseases discussed in the following chapters in this section and in the next section on pulmonary disorders in critical illness.
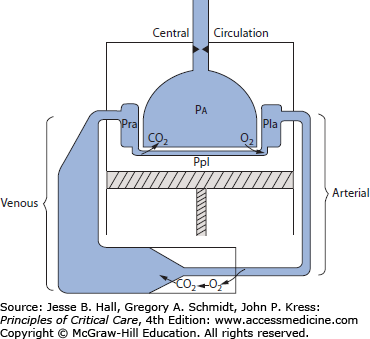
A primary role of the cardiovascular system is to deliver energy sources from the gut and liver and oxygen from the lungs to all systemic organ systems for their aerobic metabolism; effluent from these tissues removes the waste products of metabolism and delivers them to the lungs, kidney, and liver for excretion. This process is facilitated by return of the entire circulation through the lungs, where CO2 is eliminated and O2 is taken up to arterialize the blood. As depicted in Figure 31-1, this central circulation is located within the thoracic cavity; movement of gas between the atmosphere and the alveolar space is caused by the respiratory muscles, especially the diaphragm, depicted as a piston at the floor of the thoracic cavity. Beyond effecting ventilation to permit pulmonary gas exchange, active movement of the piston decreases the pleural pressure (Ppl), which approximates the pressure on the outside of extra-alveolar vessels including the right and left hearts (depicted as chambers labeled Pra [right atrial pressure] and Pla [left atrial pressure]); changes in alveolar pressure (Pa) affect pressures within alveolar vessels. Once the blood leaves the lung and enters the left heart, the ventricular pumping function ejects blood into the stiff, high-resistance arterial circulation to perfuse the systemic capillary beds, where O2 is consumed and CO2 is taken up before the venous blood returns to the right heart through the large-volume, very compliant, low-resistance venous circuit.1,2
FIGURE 31-1
Schematic showing circulation proceeding from the left atrium (Pla, left atrial pressure) through a high-pressure arterial system (low volume, low compliance, high resistance) to peripheral tissues (where oxygen leaves the vessels to produce energy and CO2, shown entering the vessels) and through the low-pressure venous system (high volume, high compliance, low resistance), which returns blood to the right atrium (Pra, right atrial pressure). The circuit is completed by perfusing the lung back to the left atrium; the pulmonary vessels are shown in close apposition with the alveoli (Pa, alveolar pressure), facilitating gas exchange. This central circulation is enclosed in the thorax, the floor of which is the diaphragm (indicated by the piston). Between the lungs and the thorax is the pleural space (Ppl, pleural pressure). Ppl approximates the pressure on the outside of all extra-alveolar vessels within the central circulation, including the heart, whereas Pa is the pressure outside the alveolar vessels. The anatomic arrangement accounts for the many mechanical interactions between respiration and circulation in critical illness described throughout this chapter.
VENTRICULAR DYSFUNCTION IN CRITICAL ILLNESS
Figure 31-2 illustrates the typical events in the two phases of ventricular activity: active contraction (systole) and relaxation (diastole). In diastole, the left ventricle fills through the open mitral valve from the left atrium while the aortic valve is closed. After electrical stimulation and contraction of the left ventricle in systole, a stroke volume (SV) is ejected into the proximal arterial chamber. Because more blood is being ejected than runs off through the peripheral resistance located in the distal arterioles, the arterial walls are distended outward, thus raising the pressure (P) in inverse proportion to the capacitance (C = ΔV/ΔP) of the walls of the larger arteries proximal to the resistance vessels. As the ventricle’s volume (V) decreases, its ability to generate pressure decreases, as dictated by the length-dependent activation of actin and myosin cross-bridges in the cardiac myocytes,3 until ventricular systolic pressure (SP) falls below the simultaneous arterial pressure. Then the aortic valve closes, as indicated by the dicrotic notch on the arterial pressure pulse (Fig. 31-3). As the ventricle relaxes, the mitral valve opens, and the ventricle fills along its diastolic volume-pressure (V-P) curve; this diastolic filling is aided by atrial contraction and by suction by the ventricle relaxing from its low end-contraction volume. During diastole, the part of the SV stored in the distended arterial bed continues to run off through the peripheral resistance, associated with a progressive decrease in arterial pressure until the next contraction.
FIGURE 31-2
During ventricular systole, the stroke volume ejected by the ventricle results in some forward capillary flow, but most of the ejected volume is stored in the elastic arteries. During ventricular diastole, the elastic recoil of the arterial walls maintains capillary flow through the remainder of the cardiac cycle. Accordingly, pulse pressure is proportional to stroke volume, and diastolic pressure increases with peripheral resistance, heart rate, and vascular capacitance, all of which reduce the diastolic runoff of the ejected volume. (Reproduced with permission from Berne RM, Levy MN, eds. Physiology. St. Louis, Mosby; 1988.)
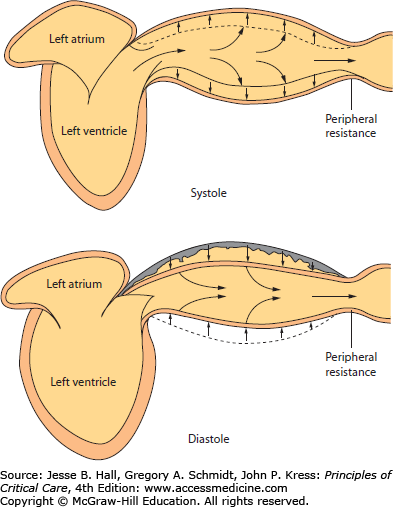
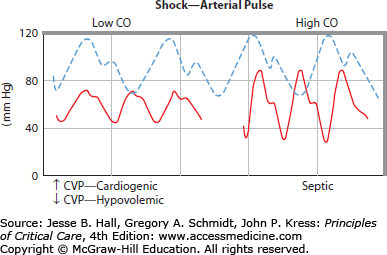
FIGURE 31-3
Schematic illustrations of the normal arterial pressure waveform (interrupted pulse pressure); the continuous pressure waves in low cardiac output ( ) hypotension (left) and in high (
 ) hypotension (right) illustrate key differences from the normal pulse. Ordinate, arterial pressure (mm Hg); abscissa, time (seconds). The lower-left panel illustrates the difference between cardiogenic shock (increased central venous pressure = 20 mm Hg) and hypovolemic shock (central venous pressure = 0 mm Hg). For discussion, see text.
This ventricular-vascular coupling acts as a hydraulic filter to convert the intermittent ejection of an SV into a continuous organ flow, the cardiac output (˙Qт). It also decreases the work of the heart by allowing some of the energy imparted by the systolic ventricle to the blood to be stored in distention of the arterial chamber and returned to the circulation by continued flow while the ventricle is resting in diastole. The systemic vascular resistance (SVR) representing the integrated peripheral resistances into which (˙Qт) flows is also essential to the control of blood pressure (BP=˙Qт×SVR) and to the distribution of blood flow among, or within, organs according to tissue needs. For example, in conditions of hypovolemic or cardiogenic shock, reflex sympathetic output constricts arterioles, especially in the mesenteric, renal, and skin vascular beds, to preserve flow to vital organs such as the heart and brain by maintaining aortic BP; alternatively, during pyrexia and tachypnea, the increased metabolic need demands a high ˙Qт associated with dilation of the coronary and respiratory muscle vessels induced by accumulation of anaerobic metabolites (eg, adenosine, H+, and K+) and by local tissue hypoxia, to maintain adequate O2 flow to these vital pumps.
Clinical evaluation of the cardiovascular system in patients with critical illness is much aided by interpretation of the diastolic pressure (DP), the pulse pressure (PP), and indices of SVR such as the rate of color return to the nail bed after releasing pressure on the fingernail and digital temperature. For example, a hypotensive patient with a heart rate (HR) of 110 beats/min, a SP/DP of 100/40 mm Hg, and warm extremities with good color return to the nail bed has a high ˙Qт and a low SVR (see Fig. 31-3). This is because the large PP (60 mm Hg) signals a large SV, which, when multiplied by the increased HR, produces increased ˙Qт, and the low DP indicates rapid peripheral runoff through low SVR confirmed by digital examination and low mean BP (60 mm Hg) in the face of the high ˙Qт. In contrast, a second hypotensive patient with the same HR and mean BP but an SP/DP of 80/65 mm Hg and cold extremities with very slow return of color to the nail bed has a low ˙Qт with increased SVR indicated by the small PP (hence, low SV and ˙Qт), preserved DP, and constricted digital vessels. As indicated in the lower-left panel of Figure 31-3, this low ˙Qт hypotension is cardiogenic when the central venous pressure (CVP) is high and hypovolemic when the CVP is low. Of course, the relation between PP and SV is not quantitative, because it is proportioned by an unknown constant—the vascular capacitance. Nevertheless, in a given critically ill patient whose vascular capacitance changes minimally in a course of acute interventions, a change in PP is the earliest indicator of a change in SV. This correlation of PP with SV is evident in one method of assessing the likelihood of arterial BP augmentation in response to volume infusion in a mechanically ventilated patient.4 As described below, increases in intrathoracic pressure during positive pressure mechanical ventilation in a hypovolemic patient can result in a reduction of VR to the heart from the peripheral circulation. This, in turn, results in a reduction in the stroke volume of the heart (SV), which can be observed as a narrowing of the PP on the arterial tracing (not shown; see Chap. 34.).
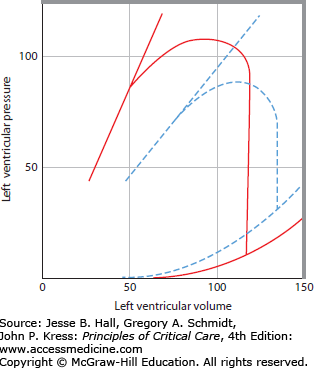
Figure 31-4 presents Starling relations of the heart.2,3 On the abscissa is plotted Pla, which approximates the filling pressure of the left ventricle (ie, left ventricular end-diastolic pressure [LVEDP]). On the ordinate is plotted SV (in milliliters); this volume ejected per heartbeat is one measure of ventricular output. Another measure of output can be expressed by multiplying stroke volume by the pressure developed during each beat to obtain stroke work (SV × [BP − Pla]). As filling pressure of the heart increases, the ejected volume and the work done by the heart increase in a curvilinear manner; at higher filling pressures, there is less increase in SV per increase in Pla than at lower values of Pla. On the continuous Starling curve shown in Figure 31-4A, the normal Pla (10 mm Hg) is associated with a normal SV (75 mL) calculated from ˙Qт (6.0 L/min) divided by HR (80 beats/min). When hypovolemia decreases the Pla to 5 mm Hg, SV decreases to 40 mL, thus decreasing ˙Qт; if therapeutic expansion of the circulating volume increases Pla to 20 mm Hg, SV increases to 100 mL, thus increasing ˙Qт above normal. These relations comprise a common framework for understanding ventricular function in critical illness. A shift up and to the left of the Starling curve generally indicates enhanced ventricular function, with greater SV for a given filling pressure (see interrupted curve in Fig 31-4A). Conversely, a shift down and to the right with reduced SV at a given filling pressure (see dotted Starling curve through points A and B) indicates depressed ventricular function. The lower SV for a Pla of 10 mm Hg at point A could be due to reduced contractility, or secondary to increased LV afterload from an elevated BP, allowing the same stroke work to eject a smaller SV at point A, or to a stiffer ventricle allowing a smaller LV end-diastolic volume (LVEDV) at a Pla of 10 mm Hg. This variety of mechanisms to explain the same data is a limitation of the analysis of hemodynamics by the Starling curve, so a more complete description of ventricular function is helpful.
FIGURE 31-4
A. Starling function curves. Stroke volume (SV, in milliliters; ordinate) is plotted against left atrial pressure (Pla, in mm Hg; abscissa). The middle continuous line depicts a normal Starling function curve for comparison with a depressed curve (dotted line AB) and with a curve depicting enhanced ventricular function (interrupted curve); all three curves may have the same systolic function (contractility) if diastolic volume-pressure (V-P) relations or afterload differs from each other. B. Corresponding left ventricular volume (milliliters; abscissa) versus pressure (mm Hg; ordinate) relations; the break in the ordinate scale emphasizes the normal diastolic V-P relation (continuous line 1,2) and the end-systolic V-P relation (continuous line up and to the left). For discussion of the three V-P loops originating from the diastolic curve, see text. The interrupted diastolic V-P curve depicts a more compliant chamber such as the right ventricle, where there is less diastolic pressure for each volume.
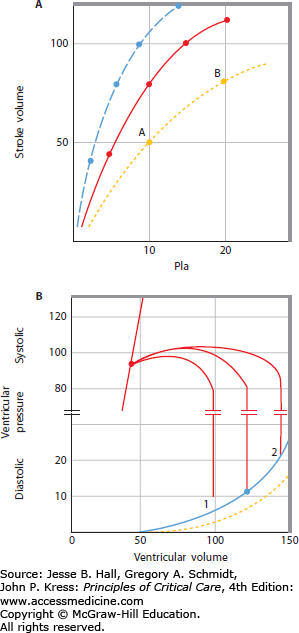
The ventricular function shown by the Starling relation is based on the mechanical properties of the relaxed (diastolic) or contracting (systolic) V-P relations of the ventricle. This section reviews the factors that influence the diastolic and systolic mechanics in health and in critical illness and relates these mechanics to the corresponding Starling function curves of the heart. In Figure 31-4B, LV end-diastolic pressure (LVEDP) and LV end-systolic pressure (LVESP) are plotted against the corresponding volumes (LVEDV and LV end-systolic volume [LVESV]). The continuous end-diastolic V-P curve is marked with a dot at an LVEDP of 10 mm Hg, where the normal LVEDV is 120 mL. When the ventricle contracts, pressure increases at the same volume until the aortic valve is opened, and blood is ejected until the valve closes at an LVESV of 45 mL. The SV (LVEDV − LVESV) is 75 mL, as plotted on the continuous Starling curve shown in Figure 31-4A. When hypovolemia decreases the LVEDV (1 in Fig. 31-4B), LVEDP and SV decrease along the Starling curve above; if volume expansion increases the LVEDV to position 2, SV and LVEDP increase along the Starling curve. Intracardiac pressures such as Pla are measured with respect to atmospheric pressure, so they do not represent true transmural, or filling, pressures of the heart chamber when the pressure on the outside of the heart is not atmospheric.5,6 Pericardial pressure is most often equal to Ppl, which is subatmospheric during spontaneous breathing (−3 to −10 mm Hg) and can become very negative in airflow obstruction or very positive with mechanical ventilation and positive end-expiratory pressure (PEEP). For convenience, the following discussion refers to the intravascular pressures as transmural, or filling, pressures, and any cause for altered pericardial or pleural pressure is noted.
Common Causes of Diastolic Dysfunction in Critically Ill Patients Signaled by High Left Atrial Pressure and Low Ventricular End-Diastolic Volume
| External compression |
| Pericardial effusion or constriction |
| Positive pressure ventilation with PEEP, auto-PEEP |
| Tension pneumothorax, massive pleural effusions |
| Greatly increased abdominal pressure |
| Myocardial stiffness |
| LV hypertrophy—aortic stenosis, systemic hypertension |
| Infiltrative diseases—amyloidosis |
| Ischemic heart disease |
| Ventricular interdependence and right-to-left septal shift |
| Pulmonary hypertension |
| RV infarction |
| High levels of PEEP |
| Severe acute hypoxic respiratory failure |
| Intraventricular filling defects |
| Tumor |
| Clot |
| Rhythm or valvular impediments to filling |
| Tachycardia |
| Heart block |
| Atrial fibrillation, flutter |
| Mitral stenosis |
Figure 31-4B plots LVEDV against LVEDP. As ventricular volume increases from zero, the transmural pressure of the ventricle does not exceed zero until about 50 mL (the unstressed volume) is added. Then LVEDP increases in a curvilinear manner with ventricular volume (the stressed volume) first as a large change in volume for a small change in pressure and then as a small change in volume for a large change in pressure. If the pericardium is removed, these V-P characteristics are more linear such that the large change in LVEDP at higher values of LVEDV is no longer evident. Thus the pericardium acts like a membrane with a large unstressed volume loosely surrounding the heart up to a given ventricular volume, but at greater LVEDV the pericardium becomes very stiff. At higher heart volumes, most of the pressure across the heart is across the pericardium, accounting for the very steep rise in the diastolic V-P relation. In the presence of pericardial effusion, the volume at which the pericardium becomes a limiting membrane is reduced by the volume of the effusion. When the effusion is large enough, reduced end-diastolic volumes are associated with quite large end-DPs (see Chap. 40). In turn, pericardial pressure decreased VR by increasing Pra, thus keeping end-diastolic volume and ˙Qт abnormally low. Tension pneumothorax, massive pleural effusions, high levels of PEEP, and greatly increased abdominal pressures can increase pressure outside the heart (Ppl) and thus reduce LVEDV and SV despite high values of LVEDP (Table 31-1). Intercurrent LV hypertrophy or infiltrative diseases (amyloidosis) occasionally stiffen the relaxed ventricle such that high filling pressures are needed to maintain an adequate SV, and inadequate filling time or poorly coordinated atrial contraction also impairs ventricular filling.7
A right-to-left shift of the interventricular septum can also restrict diastolic filling. Presumably, the distention of the right ventricle causes the interventricular septum to bulge from right to left, thereby reducing the unstressed volume and compliance of the left ventricle.2,8 This effect of ventricular interdependence is much less marked when the pericardium is removed, perhaps because the limiting membrane of the pericardium restricts freedom of motion of the left ventricle, making it more vulnerable to displacements of the septum. Accordingly, conditions in which the right ventricle is abnormally loaded (eg, acute pulmonary embolism or acute-on-chronic respiratory failure due to obstructive or restrictive lung disease) may impede the emptying of the right ventricle, causing it to work at a higher end-diastolic volume. Then LV filling pressures will be higher than expected for the end-diastolic volume. This provides one possible explanation for why PEEP is often associated with increased filling pressure to maintain a normal SV even when LVEDP is corrected to the true filling pressure by subtracting the increase in Ppl (ΔPpl) measured when PEEP is applied.5,6,9,10 Acute myocardial ischemia also displaces the diastolic V-P curve of the left ventricle up and to the left (Fig. 31-5). Conceivably, myocardial injury and ischemia alter the elastic properties of the relaxed ventricle as diastolic relaxation is an active process requiring ATP to allow cycling of actin-myosin cross-bridges.6,11 Therefore, a higher ventricular filling pressure is required at each end-diastolic volume. This accounts in part for the often noted observation that patients with acute myocardial injury need values of LVEDP as high as 30 mm Hg to maintain adequate ˙Qт, whereas normal patients need filling pressures below 10 mm Hg.
FIGURE 31-5
Schematic representation of left ventricular end-diastolic volume (LDEDV) and pressure (LVEDP) and end-systolic (ES) volume and pressure relations before (continuous curves) and after (interrupted curves) acute myocardial infarction. The myocardial injury depresses the contractility to increase ES volume despite the decrease in pressure afterload; accordingly, LVEDV increases to accommodate venous return, whereas LVEDP increases even more due to the diastolic dysfunction of the myocardial injury. Accordingly, LV dysfunction is signaled by reduced stroke volume and cardiac output despite a large elevation in LVEDP; therapy aims to reduce preload, enhance contractility, and reduce afterload. For further discussion, see text.
The normal diastolic V-P relation is demonstrated by the continuous line in the lower right-hand portion of Figure 31-5. Consider the effects when the ventricle contracts during systole without ejecting any blood, as if the aortic valve could not open. A very large pressure is generated during this isovolumic contraction from a normal LVEDV, but when the LVEDV is reduced, the pressure generated during a similar isovolumic contraction is much less, as a manifestation of the force-length characteristics of the myocardium.2,3,12,13 That is, the less the muscle is stretched, the less force it can generate, a manifestation of the length-dependent activation of actin-myosin cross-bridges. The units of force in the hollow sphere of myocardium are the units of pressure, or force per unit area. A line connecting the end-systolic V-P points is linear and extrapolates toward the origin (see the continuous end-systolic V-P line in Fig. 31-5, upper left).
Of course, the aortic valve does open in early systole when the isovolumic pressure exceeds the aortic DP; then LV volume decreases as the SV is ejected (see Fig. 31-5). The contracting ventricle shortens against the aortic afterload pressure until its volume reaches the end-systolic volume; at that lower volume, the maximum pressure that can be generated is equal to the afterload pressure, so the aortic valve closes and ejection is over. If the afterload pressure were decreased, the ventricle could eject further to a lower end-systolic volume, where the maximum generated pressure equals the reduced afterload; hence, SV would increase.
The line connecting all end-systolic V-P points is an indicator of the pumping function or contractility of the heart because this line defines the volume to which the ventricle can shorten against each afterload for a given contractile state.12-15 Agents that enhance contractility (eg, epinephrine, calcium, dobutamine, and dopamine) shift the end-systolic V-P relation up and to the left; then the ventricle can shorten to a smaller end-systolic volume for each afterload, thereby increasing SV at a given LVEDV/ LVEDP.12,13 Conversely, negative inotropic agents such as metoprolol, myocardial ischemia, hypoxia, and acidemia depress the end-systolic V-P relation down and to the right, as indicated by the interrupted end-systolic V-P line shown in Figure 31-5.14,15 Then end-systolic volume is increased for a given pressure afterload, thereby reducing the SV at a given filling pressure. Such a reduction in contractility is a common cause for the depressed Starling curve AB shown in in Figure 31-4.
These concepts provide a framework for understanding the pathophysiology and therapy of acute myocardial infarction (see Chap. 37). Figure 31-5 depicts normal diastolic and systolic V-P relations and indicates a normal systolic ejection (continuous lines). From an LVEDV of 120 mL and an LVEDP of 10 mm Hg, the ventricle contracts isovolumically until the aortic valve opens at a DP of 80 mm Hg. Blood is then ejected as SP increases to 110 mm Hg and decreased toward an LVESP of 90 mm Hg and an LVESV of 50 mL, when the aortic valve closes to generate the dicrotic notch on the arterial pressure trace. Accordingly, SV is 70 mL at a Pla of 10 mm Hg and ˙Qт is 5.6 L/min when HR is 80 beats/min. Acute myocardial infarction depresses the end-systolic V-P relation so that the end-systolic volume is increased to 90 mL at a reduced LVESP of 75 mm Hg (interrupted lines). At the same time, the end-diastolic volume is increased to 130 mL to accommodate the VR, and end-DP is increased even more than expected (LVEDP = 30 mm Hg) due to the shift up and to the left of the end-diastolic V-P relation (interrupted line). Thus SV (40 mL) and ˙Qт (4.4 L/min) are reduced despite reflex tachycardia (HR = 110 beats/min) at an increased LV filling pressure, and BP is decreased (SP/DP = 90/70 mm Hg) despite the reflex increase in SVR.
Conventional therapy consists of preload reduction, inotropic agents, and afterload reduction, in addition to measures to reestablish and maintain coronary blood flow (see Chap. 37). Interventions such as morphine, furosemide, and nitrates decrease VR by dilating venous capacitance beds to increase the unstressed volume and decrease mean systemic pressure (Pms; see below). These actions in turn decrease LVEDV and LVEDP. The reduction in end-diastolic volume tends to decrease LVEDP along the steep diastolic V-P curve so that there is a large reduction in LVEDP for a small reduction in LVEDV and SV. Further, the potential adverse effect of reduced SV is often offset by increased contractility and reduced afterload when myocardial wall stress is decreased by the reduction in LVEDV and LVEDP (see Chaps. 35 and 37). Reduced afterload and reduced myocardial O2 consumption improve ventricular pumping function by shifting the end-systolic V-P relation up and to the left, so LVESV decreases and SV increases. Further, the decreased end-DP reduces the complication of cardiogenic pulmonary edema.
Positive inotropic agents such as dopamine and dobutamine act directly on the myocardium to reduce end-systolic volume at a given end-SP, thereby increasing SV (see Chaps. 35 and 37). Dopamine also causes venoconstriction by increasing Pms and VR, so the increase in SV is often associated with increased LVEDV, whereas dobutamine tends to increase SV and decrease LVEDV.16 Afterload-reducing agents such as nitroprusside dilate peripheral arteries to decrease end-SP and afterload; in turn, end-systolic volume decreases along the depressed end-systolic V-P relation to increase SV.16 Nitroprusside and other arteriolar vasodilating agents also decrease end-DP without changing end-diastolic volume; this effect appears to enhance ventricular function viewed on the Starling relation, as discussed above.17 The decrease in LVEDP decreases pulmonary edema and may decrease myocardial oxygen demands by decreasing ventricular wall stress. To the extent that it decreases ventricular wall stress, end-systolic V-P relations may shift to the left due to enhanced contractility. In some patients with cardiogenic shock, vasodilator therapy appears to increase SV and ˙Qт without decreasing or even increasing arterial BP, that is, arterial dilation appears to reduce end-systolic volume at a given end-SP as if contractility were enhanced.16,17
Noninvasive bilevel mechanical ventilation (or continuous positive airway pressure, CPAP) lowers both preload and afterload, in addition to beneficial effects on gas exchange and work of breathing.18˙Qт is not reduced despite decreased transmural pressures, indicating improved pump function.
Other concomitant effects of critical illness cause ventricular dysfunction characterized by reduced SV at increased Pla (see Table 31-1). Arterial hypoxemia14 and acidemia15 depress the end-systolic V-P curve and increase diastolic stiffness, as shown by the interrupted curve in Figure 31-5. Acute arterial hypertension raises the pressure afterload, so SV decreases as end-systolic volume increases along the continuous end-systolic V-P curve in Figure 31-5. Then LVEDV increases to accommodate VR, so LVEDP increases, often more than expected, due to diastolic stiffness, in turn due to LV hypertrophy in the hypertensive patient. Accordingly, pulmonary edema is a common complication, and it responds to vasodilator therapy when BP is decreased. In some or all of these conditions, diastolic dysfunction merits special management.7 When acute or acute-on-chronic congestive heart failure is present, decreasing LVEDP and LVEDV, maintaining atrial contraction, increasing the duration of diastole, and minimizing myocardial ischemia are helpful. Each of these therapeutic measures is also helpful in managing hypoperfusion states associated with diastolic dysfunction.7
Valvular dysfunction mimics systolic and diastolic dysfunctions such that LVEDV is much increased and the forward SV is reduced (see Chap. 41). With aortic regurgitation, after a vigorous systolic ejection, aortic blood runs off forward and backward in diastole such that LVEDP increases and arterial DP decreases toward equal values at 40 mm Hg. The large LVEDV then ejects a large SV to increase SP to 120 mm Hg, causing a bounding PP of 80 mm Hg, but the aortic regurgitation reduces forward SV and ˙Qт to a low value. Consider also mitral valve incompetence. During systole, a large fraction of the blood ejected from the ventricle regurgitates to the left atrium, thereby reducing forward SV and ˙Qт but increasing LVEDV and LVEDP when the left atrium fills the ventricle in diastole. In this circumstance, PP and BP are decreased. In both cases, the ventricular mechanics resemble the interrupted curves shown in Figure 31-5 and improve toward the normal continuous curves when forward flow is increased by vasodilator therapy that lowers SVR to allow more peripheral runoff and less regurgitant flow (see Chap. 41).
CONTROL OF CARDIAC OUTPUT BY THE SYSTEMIC VESSELS
The heart is a mechanical pump that generates flow in the circulation. Because ˙Qт is the product of HR and SV, it is often erroneously assumed that the heart controls ˙Qт. In fact VR to the right heart is controlled by the systemic vessels,1,2 so the heart is more accurately described as a mechanical pump having diastolic and systolic properties that determine how it accommodates the VR. This section reviews the mechanical characteristics of the systemic vessels as a basis for understanding control of ˙Qт in health and in critical illness.
We use the classical Guyton view that mean systemic pressure (Pms), right atrial pressure (Pra), and resistance to venous return (RVR) govern VR.1,2 This conceptual model draws attention to how the resistance (R) and capacitance (C) of systemic vessels and their distribution exert control on the VR, especially through baroreceptor reflexes.19,20 This model also provides a graphical solution for the unique values of Pra and VR at the intersection of cardiac function and VR curves (see below) in health and in diverse critical illnesses.
We choose to downplay several potential shortfalls of this interpretation, which some regard as fatal flaws.21,22 Their analyses and interpretation of Guyton’s experiments suggest that Pra is not the “back pressure” impeding VR, that Pms is an imaginative concept that ought not be interpreted as the pressure driving VR, and that Pms − Pra is the result of VR, not its cause.21 Our comparison of these two viewpoints reveals that the first provides more useful concepts for explaining the pathophysiology and treatment of the circulation in critical illness, so we build our discussion on Guyton’s view.
When the heart stops beating (see Fig. 31-1), pressure equalizes throughout the vascular system, and its new value is the Pms (10-15 mm Hg). This pressure is much lower than the arterial pressure and is closer to the Pra. When flow stops, blood drains from the high-pressure, low-volume arterial system into the high-volume, low-pressure venous system, which accommodates the displaced volume with little change in pressure. When the heart begins to beat again, the left heart pumps blood from the central circulation into the systemic circuit, thus increasing pressure there. At the same time, the right heart pumps blood into the lungs, thereby decreasing its pressure (Pra) with respect to Pms, so blood flows from the venous reservoir into the right atrium. Pressure on the venous side decreases slightly below Pms, whereas pressure on the arterial side increases considerably above Pms with succeeding heartbeats. This continues until a steady state is reached, when arterial pressure has increased enough to drive the whole SV of each succeeding heartbeat through the high arterial resistance into the venous reservoir. The Pms does not change between the state of no flow and the new state of steady flow because neither the vascular volume nor the compliance of the vessels has changed. What has changed is the distribution of the vascular volume from the compliant veins to the stiff arteries; this volume shift creates the pressure difference driving flow through the circuit.1,2,19,20
Pms is the driving pressure for VR to the right atrium when circulation resumes. It can be increased to increase VR by increasing the vascular volume or by decreasing the unstressed volume and compliance of the vessels.2,19 The latter two mechanisms are mediated by baroreceptor reflexes responding to hypotension by increasing venous tone and usually occur together. The unstressed volume may also be reduced by raising the legs of a supine patient or applying military antishock trousers; both methods return a portion of the unstressed vascular volume from the large veins in the legs to the stressed volume, thereby increasing Pms and VR. When the heart has an improvement in inotropic state or a reduction in afterload, blood is shifted from the central compartment to the stressed volume of the systemic circuit, thereby increasing Pms and VR20; moreover, improved ventricular pumping function decreases Pra to increase VR further (see below).
Before the heart was started in the discussion above, Pra was equal to the pressure throughout the vascular system, Pms. With each succeeding heartbeat, Pra decreases below Pms and VR increases. This sequence is repeated in a more controlled, steady state by replacing the heart with a pump set to keep Pra at a given value while VR is measured.2 Typical data are plotted in Figure 31-6. As Pra is decreased from 12 to 0 mm Hg (indicated by the thin continuous line), VR is progressively increased with the driving pressure (Pms − Pra). The slope of the relation between VR and Pms − Pra is the resistance to VR (RVR = Δ[Pms − Pra]/ΔVR). When Pra falls below zero, VR does not increase further because flow becomes limited while entering the thorax. This occurs when the pressure in these collapsible great veins decreases below the atmospheric pressure outside the veins. Further decreases in Pra and CVP are associated with progressive collapse of the veins rather than with an increase in VR.
FIGURE 31-6
Control of cardiac output by systemic vessels. Venous return (VR) or cardiac output ( ) is plotted on the ordinate against right atrial pressure (Pra) on the abscissa. A, B. The thin continuous VR curve shows that VR increases as Pra decreases below Pra equal to mean systemic pressure (Pms, where VR = 0), so the inverse of the slope of this VR curve ([Pms − Pra]/VR) is the resistance to VR (RVR). The thick continuous cardiac function curve shows that
  increases as Pra increases because ventricular end-diastolic volume increases. The intersection (shown in A) marks the unique value of Pra where VR equals
  in A and B. When this value of
  is insufficient, VR can be increased by increasing Pms without changing RVR, indicated by the interrupted VR curve intersecting the unchanged cardiac function curve at a higher
  and Pra (shown in B, left panel). In the right panel, VR is increased from point A to point B by increased cardiac function (see interrupted cardiac function curve intersecting the original VR curve at point B). Accordingly, inotropic agents that increase contractility (dobutamine) can produce modest increases in VR by lowering Pra, but further increases in VR are limited by compression of the great veins at lower values of Pra (right panel); such an enhanced cardiac function displaces central blood volume into the peripheral circulation, tending to increase Pms and thus promote further increases in VR (left panel). Often, other inotropic agents (dopamine, epinephrine) also raise Pms and VR by venoconstriction.
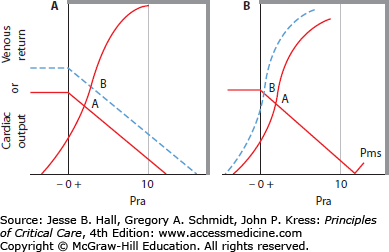
For a given stressed vascular volume and compliance, Pms is set and RVR is relatively constant. In the absence of pulmonary hypertension or right heart dysfunction, LV function will determine Pra and, hence, VR to the right heart, along the VR curve. The corresponding cardiac function curve is drawn as the thick line. ˙Qт is described by the cardiac function curve, drawn as a thick continuous line relating Pra (abscissa) to ˙Qт (ordinate), in Figure 31-6. The heart is able to eject a larger SV and ˙Qт when the end-DP is greater because more distended ventricles eject to about the same end-systolic volume as less distended ventricles do. Accordingly, as Pra decreases, ˙Qт decreases along the cardiac function curve. However, VR increases as Pra decreases until VR equals ˙Qт at a unique value of Pra, indicated by the intersection of the cardiac function and VR curves in Figure 31-6 (see point A in both panels).
When ˙Qт is insufficient, VR can be increased in several ways. A new steady state of increased VR is achieved by increasing Pms with no change in RVR, indicated by the interrupted VR curve in the left panel of Figure 31-6. This new VR curve intersects the same cardiac function curve at a higher value of ˙Qт at point B. This method of increasing VR is associated with an increase in Pra. Due to the steep slope of the cardiac function curve in normal hearts, large increases in VR occur with only small increases in Pra. Alternatively, VR can be increased by enhanced cardiac function by increasing contractility or decreasing afterload of the heart. This is depicted as an upward shift of the cardiac function curve, as in the right panel of Figure 31-6, such that greater ˙Qт occurs at each Pra. The increase on each VR curve by this mechanism is associated with a reduction in Pra. Further, in the normal heart, only a small change in VR is possible (from point A to point B in the right panel), and greater reductions in Pra do not increase ˙Qт further because VR becomes flow limited as Pra decreases to below zero. This explains why inotropic agents that enhance contractility are ineffective in hypovolemic shock.
When cardiac pumping function is depressed, as depicted by the interrupted line in Figure 31-7, VR is decreased from point A to point B for the same value of Pms as Pra increases. The patient must then retain fluid or initiate cardiac reflexes to increase Pms toward the new value required to maintain adequate ˙
Related posts:


Stay updated, free articles. Join our Telegram channel

Full access? Get Clinical Tree


