KEY POINTS
Type I respiratory failure, characterized by severe, oxygen-refractory hypoxemia, is caused by a portion of the total pulmonary blood flow (˙Qѕ/˙Qт) traversing the lung without picking up oxygen due to airspace filling.
When blood transport of oxygen is inadequate, treatment includes optimizing cardiac output, hemoglobin concentration, and arterial saturation, and lowering oxygen consumption.
Optimizing does not mean maximizing, and the end point of each therapeutic approach is the least intervention achieving the goal of that treatment and needs to be selected for the individual patient.
Type II respiratory failure is characterized by alveolar hypoventilation and increased PCO2, caused by loss of CNS drive, impaired neuromuscular competence, excessive dead space, or increased mechanical load.
Type III respiratory failure typically occurs in the perioperative period when factors that reduce functional residual capacity combine with causes of increased closing volume to produce progressive atelectasis.
Type IV respiratory failure ensues when the circulation fails and resolves when shock is corrected, as long as one of the other types of respiratory failure has not supervened.
Liberation from mechanical ventilation is enhanced by identifying and correcting the many factors contributing to increased respiratory load and decreased neuromuscular competence.
Respiratory failure (RF) is diagnosed when the patient loses the ability to ventilate adequately or to provide sufficient oxygen to the blood and systemic organs. Urgent resuscitation of the patient requires airway control, ventilator management, and stabilization of the circulation, while effective ongoing care for the patient with RF necessitates a differential diagnosis and therapeutic plan derived from an informed clinical and laboratory examination supplemented by the results of special ICU interventions. Recent advances in ICU management and monitoring technology facilitate early detection of the pathophysiology of vital functions, with the potential for prevention and early titration of therapy for the patient’s continual improvement. The purpose of this chapter is to provide an informed, practical approach to integrating established concepts of pathophysiology with conventional clinical skills. This chapter does not provide a course in pulmonary physiology nor a comprehensive review of how to treat RF. Rather, it attempts to provide a conceptual framework of principles useful in approaching the patient with RF, first by discussing an approach to tissue hypoxia, and then by describing the mechanisms causing four types of RF, showing how correcting each derangement allows the patient to resume spontaneous breathing effected by respiratory muscles that are not fatigued.
AN APPROACH TO INADEQUATE BLOOD TRANSPORT OF OXYGEN
Randomized controlled trials have confirmed the importance of aggressive early resuscitation in the face of inadequate oxygen delivery (shock),1 Measurement of ˙QO2 and ˙VO2 in critically ill subjects prior to initial resuscitation demonstrates increases in ˙VO2 in response to augmentation of severely reduced ˙QO2, indicating that oxygen supply dependence plays a role in early sepsis prior to initial resuscitation.2,3 Following initial resuscitation, however, a subset of patients demonstrate what appears to be ongoing evidence of inadequate oxygen delivery to peripheral tissues as evidenced by the presence of lactic acidosis despite adequate resuscitation.4 While early trials using flow directed pulmonary artery catheters suggested that ˙VO2 was supply dependent (see below),5-7 subsequent studies demonstrated that this apparent supply dependence was an artifact of covariant measurements.8,9
Patients with RF are susceptible to anaerobic metabolism, either because they deliver inadequate O2 to their systemic organs or because their tissues develop an abnormal inability to extract oxygen from the blood.10 During air breathing, arterialized blood leaves the normal alveoli with a partial pressure of oxygen (PaO2) of about 100 mm Hg. When the hemoglobin concentration is 15 g/dL, arterial O2 content (CaO2) is about 20 mL per 100 mL blood on the fully saturated hemoglobin and about 0.3 mL in physical solution. Accordingly, a cardiac output (˙Qт) of 5.0 L/min transports approximately 1000 mL/min of O2 to the tissues (transport of oxygen; ˙QO2). There, tissue metabolism (oxygen consumption; ˙VO2) extracts 250 mL/min, so 5.0 L/min of mixed venous blood returns to the lungs with 750 mL/min of O2, or a mixed venous O2 content (CˉvO2) of 15 mL per 100 mL blood. Accordingly, the normal extraction fraction [EF=˙VO2/˙QO2=(CaO2−CˉvO2)/CaO2] is 0.25. Because this O2 content corresponds to 75% O2 saturation (15/20), mixed venous PO2 (PˉvO2) is 40 mm Hg, as determined by the oxyhemoglobin dissociation curve for normal venous pH, partial pressure of carbon dioxide (PCO2), and temperature. Figure 43-1 plots the relationships between ˙VO2 (left ordinate) and EF (right ordinate) with ˙QO2 (abscissa) as continuous lines.
FIGURE 43-1
Oxygen consumption ( , left ordinate) depends on oxygen delivery (
 , abscissa) when low
  exceeds the limits of tissue oxygen extraction (EF, right ordinate). In patients with normal metabolism (
 = 250 mL/min),
  is maintained as
  is progressively decreased from 1000 to 400 mL/min (continuous line drawn through x’s), due to a progressive increase in EF (continuous hyperbolic line drawn through closed circles). Below this critical
  (
( ),
),  decreases due to anaerobic metabolism, leading to lactic acidemia because tissue O2 extraction cannot compensate for the low
  indicated by the dotted line departing from continuous hyperbolic EF line at the critical extraction fraction (EFc = 0.6). When
  is increased (interrupted lines drawn through closed circles) by several common manifestations of critical illness (eg, work of breathing, burns, fever, sepsis, and trauma), EF is increased at each value of
  , and supply dependence of O2 consumption begins at a value of
  greater than for the patient with normal
  despite normal EFc = 0.6. Accordingly,
  must increase with
  to maintain aerobic metabolism, or
  must be reduced. See text for discussion.
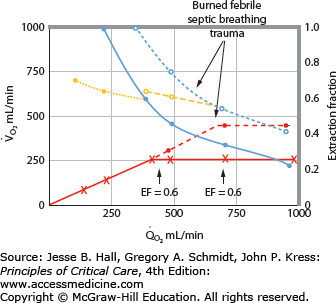
In many patients with RF, the O2 transport to the tissues is reduced by abnormally low cardiac output, hemoglobin, or O2 saturation. Consider the effects of acute myocardial injury or hypovolemia that reduces ˙Qт to 2.5 L/min and ˙QO2 to 500 mL/min. To maintain the ˙VO2 necessary for aerobic metabolism, the tissues must extract 250 mL/min from half the blood flow, so CˉvO2 decreases to 10 mL O2 per 100 mL blood and EF increases to 0.50. Because this value corresponds to 50% saturation (10/20) of the normal hemoglobin concentration, PˉvO2 is 27 mm Hg. When cardiac output is returned toward normal with vasoactive drug or volume therapy, PˉvO2 rises again. In another patient with normal cardiac output (5 L/min) but severe arterial hypoxemia (PaO2 = 40 mm Hg, O2 saturation = 75%, CaO2 = 15 mL O2/100 mL blood), Cv–O2 must decrease to 10 mL per 100 mL blood to provide the tissues with 250 mL/min of O2; again, PˉvO2 decreases to 27 mm Hg. When cardiac output increases in response to hypoxia, PˉvO2 increases again. In a third patient with normal ˙Qт and PaO2 but with reduced concentration of hemoglobin (7.5 g/100 mL blood), CaO2 is reduced to 10 mL per 100 mL blood. Accordingly, CˉvO2 and PˉvO2 must decrease to 5 mL per 100 mL blood and 27 mm Hg, respectively, to maintain aerobic metabolism, and these venous values increase again with greater cardiac output or hemoglobin concentration. In each case, ˙VO2 was maintained as ˙QO2 decreased, creating the horizontal continuous line in Figure 43-1 indicating that ˙VO2 is independent of O2 delivery in this range; ˙VO2 was constant because EF increased in the hyperbolic manner indicated by the continuous line relating EF to ˙QO2.
These considerations illustrate that one end point of reduced O2 transport in the blood is reducedPˉvO2. Since PˉvO2 approximates the PO2 adjacent to the exchange vessels in the tissues, it is the driving pressure for O2 diffusion from the capillaries to the metabolizing cells. When PˉvO2 falls too low, insufficient O2 diffuses to maintain aerobic metabolism, and the cells begin to produce lactic acid as the end point of anaerobic metabolism.11 This is illustrated in Figure 43-1 by the decrease in ˙VO2 as ˙QO2 is reduced below 400 mL/min; this supply dependency of ˙VO2 occurs when EF exceeds 0.6 and tissue O2 extraction can no longer increase along the hyperbolic continuous line relating EF to ˙QO2. Accordingly, reduced PˉvO2 and increased serum lactate (or falling pH with unchanged partial pressure of arterial carbon dioxide [PaCO2]) are indications of tissue hypoxia. This improves with therapy increasing CaO2 (by increasing hemoglobin or O2 saturation) and increasing cardiac output. In many critically ill patients, two or three of these factors reducing O2 transport to the tissues coexist, so attention to optimizing all these (˙Qт, hemoglobin concentration, and O2 saturation) is reasonable in the hypoxic patient. This description of the effects of diminished ˙QO2 on PˉvO2 and hence the utility of PˉvO2 as a monitor of the adequacy of ˙QO2 helps one understand the benefits of early goal-directed therapy guided by this measurement in the treatment of patients with shock1 (see Chap. 64).
Of course, optimizing does not mean maximizing, and the end point of each therapeutic approach needs to be selected for the individual patient. Patients with low cardiac output due to heart disease may not tolerate infusions of packed erythrocytes even though their tissue hypoxia is made worse by concurrent anemia. Yet, thoughtful integration of packed cells within the therapy of plasma volume reduction may prevent anaerobic metabolism at a time when cardiac output cannot be increased to adequate levels. This use of PRBC in stabilization is not meant to ignore the study on restrictive use of PRBC by the Canadian Critical Care Trials Group.12 However, significant differences in outcomes in this trial were seen only in patients with APACHE scores of <20 and may not apply to individuals where ˙QO2 is severely impaired. Additionally administration of packed red blood cells may have additional adverse consequences such as immunosuppression.13,14
In other patients with severe arterial hypoxemia and O2
Related posts:


Stay updated, free articles. Join our Telegram channel

Full access? Get Clinical Tree


