The Normal Echocardiogram
Carlos A. Roldan
Although echocardiography (echo) plays a major role in the detection, stratification, and management of cardiovascular diseases, its role in determining the absence of heart disease or defining a specific cardiac structure as normal is equally important (1,2,3,4). Therefore, the purpose of this chapter is to delineate all structural and functional echo parameters that are consistent with a normal heart structure or an overall normal heart.
A complete transthoracic echo (TTE) or transesophageal echo (TEE) study includes M-mode, two-dimensional (2D), and real-time three-dimensional (RT3D) images; pulsed and continuous wave Doppler; tissue and color Doppler images; color M-mode, and in selected cases saline contrast or cavity-enhancing contrast echo (1,2,3,4,5).
These techniques allow assessment of the size of cardiac chambers, left ventricle (LV) and right ventricle (RV) wall thickness and wall motion, LV and RV systolic and diastolic function, estimation of atrial and pulmonary artery (PA) pressures, structure and function of the heart valves, intracardiac shunts, intracardiac masses, and assessment of the aorta and pericardium (1,2,3,4,5,6).
Left Ventricle
Size and Volume
Best Imaging Planes
Two-dimensional or 2D guided M-mode TTE parasternal long-axis and TEE transgastric long-axis views just below the level of the mitral leaflet tips to measure LV anteroposterior diameters.
Two-dimensional and wide-angle volume RT3D TTE apical and TEE midesophageal four- and two-chamber views to measure minor and long-axis LV diameters and LV volumes.
Diagnostic Methods
The most commonly used anteroposterior LV end-diastolic (onset of QRS or frame after mitral valve closure) and end-systolic (frame preceding mitral valve closure) diameters are measured from the inner edge of the interventricular septum to the inner edge of the posterior wall by TTE and from the anterior to posterior walls by TEE (Fig. 1.1A).
Normal Values
Normal LV diameters and volumes are larger for men, healthy obese subjects, and athletes, and they correlate positively with BSA, weight, and height (2,7,8,12) (Table 1.1). Therefore, indexing these values to BSA is necessary. Also, these parameters tend to be slightly smaller by TEE due to a decreased preload and afterload during this procedure (8).
Pitfalls
Alignment of the M-mode perpendicular to the long axis of the LV, even with 2D guidance, is frequently difficult and often results in overestimation of LV size.
From the TEE midesophageal four-chamber view, common foreshortening of the LV leads to underestimation of LV volumes and overestimation of ejection fraction (EF).
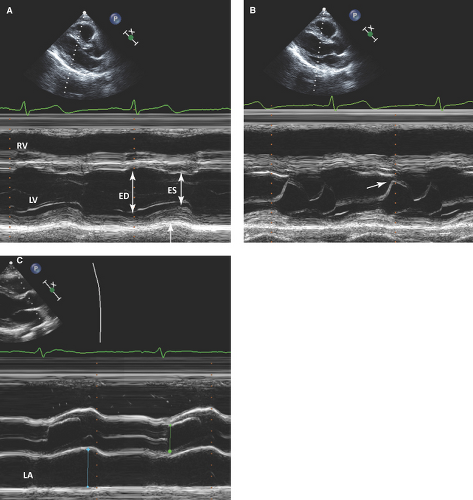
Figure 1.1: Normal M-mode echocardiogram. Two-dimensional guided M-mode echo sweep demonstrates: normal left ventricular (LV) end-diastolic (ED) and end-systolic (ES) dimensions, normal wall thickness, normal myocardial systolic thickening, and normal pericardial thickness and echoreflectance (arrow) (A); normal mitral valve morphology and mobility with normal mitral E-point septal separation (arrow) (B); and normal aortic valve mobility and thickness, normal aortic root motion, and normal LA end-systolic dimension (C). LA, left atrium; RV, right ventricle.
Two-dimensional or RT3D TTE or TEE assessment of LV volumes depend on adequate endocardial resolution and operator experience.
Wall Thickness and Mass
Best Imaging Planes
Two-dimensional guided M-mode or 2D- TTE parasternal or TEE transgastric long- and short-axis views at the level of the mitral leaflet tips to measure end-diastolic septal and posterior wall thickness from leading edge to leading edge of the respective wall.
Two-dimensional TTE parasternal or TEE transgastric short-axis view at the midpapillary muscle level for calculation of myocardial area and TTE apical or TEE midesophageal four-chamber view to obtain the LV semimajor and truncated semimajor axis (1,2,12,13) (Fig. 1.3A,B).
Diagnostic Methods and Formulas
Using M-mode, an LV mass is calculated using the following formula:

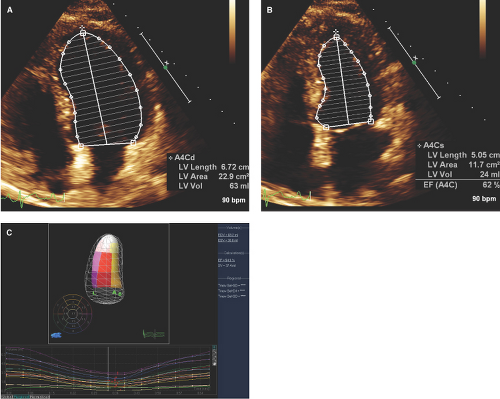
Figure 1.2: Normal LV volumes. Normal LV end-diastolic (63 mL) (A) and end-systolic (24 mL) (B) volumes by the modified Simpson’s rule. In (C), similar volumes (68 mL and 30 mL, respectively) were obtained by RT3D echo.
Using 2D imaging, the most commonly used, practical, and reproducible method is the area-length (A-L) formula:

where A1 indicates the total LV area; A2, LV cavity area; a, semimajor axis; d, truncated semimajor axis; and t, mean wall thickness obtained from the short-axis epicardial and cavity areas (Fig. 1.3A,B).
Normal Values
Wall Motion, Coronary Artery Supply, and Function
Best Imaging Planes
Two-dimensional TTE short-axis and apical four-, two-, and three-chamber views (16).
Normal Wall Motion
Normal resting LV wall motion is best defined by a 30% to 70% increase in systolic endocardial thickening
(better defined by M-mode) and less specifically by ≥0.5-cm inward wall motion (Fig. 1.1A).
Table 1.1 Normal values of left heart chambers
Measurement
TTE
TEE
Men
Women
Left ventricular anteroposterior diameter—end diastole (cm)
4.2–5.9
3.9–5.3
3.3–5.5
Left ventricular anteroposterior diameter/BSA—end diastole (cm/m2)
2.2–3.1
2.4–3.2
2.1–3.1
Left ventricular anteroposterior diameter—end systole (cm)
2.5–4.3
2.3–4.1
1.8–4.0
Left ventricular volume—end diastole (mL)
67–155
56–104
—
Left ventricular volume/BSA—end diastole (mL/m2)
35–75
35–75
—
Left ventricular volume—end systole (mL)
22–58
19–49
—
Left ventricular volume/BSA—end systole (mL/m2)
12–30
12–30
—
Left ventricular area—end diastole (cm2)
18–47
—
Left ventricular area—end systole (cm2)
8–32
—
Left ventricular fractional shortening (%)
25–43
27–45
25–45
Left ventricular ejection fraction (%)
≥55
≥55
Left ventricular IVS thickness—end diastole (cm)
0.6–1.0
0.6–0.9
0.6–1.1
Left ventricular PW thickness—end diastole (cm)
0.6–1.0
0.6–0.9
0.6–1.0
Left ventricular mass (g)*
88–224
67–162
—
Left ventricular mass/BSA (g/m2)*
49–115
43–95
—
Left ventricular outflow tract—midsystole (cm)
1.8–3.4
—
Left atrial anteroposterior diameter—end systole (cm)
3–4
2.7–3.8
—
Left atrial anteroposterior diameter/BSA—end systole (cm/m2)
1.5–2.3
1.5–2.3
—
Left atrial area (cm2)—end systole
≤20
≤20
—
Left atrial volume (mL)—end systole
18–58
22–52
—
Left atrial volume/BSA (mL/m2)—end systole
22 ± 6
22 ± 6
—
Left atrial appendage anteroposterior length (cm)—end systole
—
—
1.5–4.3
Left atrial appendage mediolateral diameter (cm)—end systole
—
—
1.0–2.8
TTE, transthoracic echocardiography; TEE, transesophageal echocardiography; BSA, body surface area; IVS, interventricular septum; PW, posterior wall.
*By M-mode. Values by 2D imaging are similar (96 to 220, 66 to 150, 50 to 102, and 44 to 88, respectively).
A normal wall motion response to exercise or dobutamine demonstrates a hyperdynamic and symmetric systolic endocardial thickening of >30%.
Each of the 16 or 17 (when the apical cap is included) LV wall segments is scored as 1, normal or hyperkinetic; 2, hypokinetic; 3, akinetic; 4, dyskinetic; or 5, aneurysmal (diastolic deformation). Thus, a normal global wall motion score is 16 or 17, and a normal wall motion score index is 1 (6).
With RT3D imaging, segmental and global wall motion can be simultaneously visually assessed from multiple views and for each wall segment a time to end systole and extent of systolic excursion are quantitated and graphically displayed (Fig. 1.5).
Coronary Artery Supply
The basal, mid, and apical anterior and the basal, mid, and apical anterior septum are supplied by the left anterior descending (LAD) artery (Fig. 1.6).
The basal and midanterolateral and apical lateral segments are supplied by the LAD or left circumflex (LCX) arteries.
The basal and midinferior walls and basal inferior septum are supplied by the right coronary artery (RCA).
The midinferior septum and apical inferior segments are supplied by the RCA or LAD.
The basal and midinferolateral segments are supplied by the RCA or LCX artery.
Systolic Function
Ejection Fraction
Normal LVEF defined as ≥55% is accurately assessed by the 2D modified Simpson’s rule and RT3D as end-diastolic volume – end-systolic volume ÷ end-diastolic volume (2,8,9,10,11).
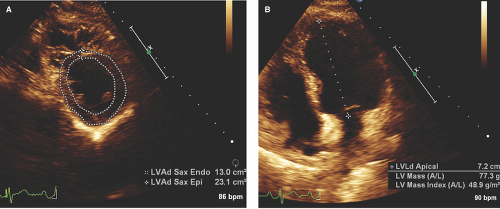
Figure 1.3: Normal LV mass and mass index by the area length method. A. Epicardial and endocardial areas of 23.1 cm2 and 13.0 cm2, respectively, obtained from the parasternal short-axis view at the papillary muscle level. B. LV end-diastolic long axis of 7.2 cm obtained from the apical four-chamber view. The calculated LV mass and index were 77.3 g and 48.9 g/m2, respectively.
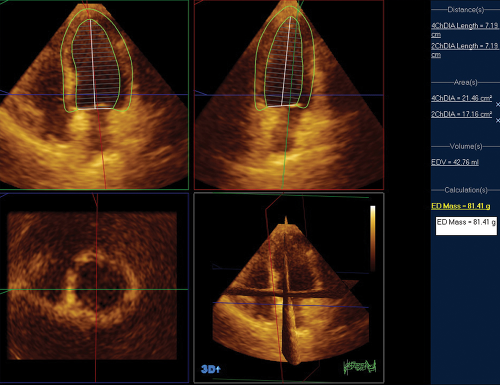
Figure 1.4: Normal LV mass by RT3D TTE. By RT3D TTE using speckle tracking echo and from a wide-angle apical four-chamber view, an LV mass of 81.41 g was obtained.
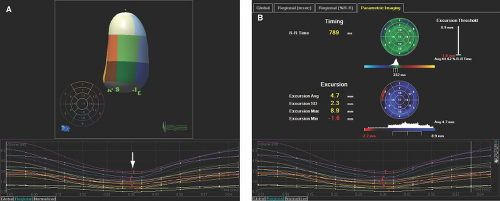
Figure 1.5: Normal LV wall motion by RT3D TTE. A. Using a 17-segment model, a visual assessment from multiple views of the systolic inward motion for each specifically colored segment can be made. Also, corresponding color-coded curves for each wall segment representing the time from end diastole to end systole allows assessment of wall motion synchrony (arrow). B. Bull’s eye graphic representation and quantitative assessment of the range and average ± standard deviation for each and all LV segments of the timing from end diastole to end systole and extent of systolic excursion. Except for a basal segment, note the uniform excursion of all LV segments.
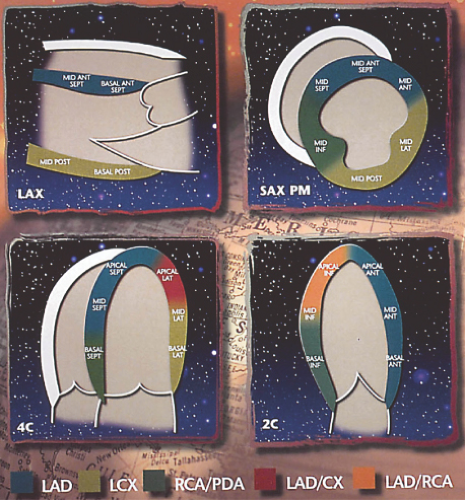
Figure 1.6: Normal 16 LV wall segments and corresponding coronary artery supply. ANT, anterior; INF, inferior; LAD, left anterior descending artery; LAT, lateral; LCX, left circumflex artery; PDA, posterior descending artery; POST, posterior; RCA, right coronary artery; SEPT, septal. (Courtesy of Biosound, Indianapolis, IN.)
Visual estimation of LVEF is more commonly used because is practical, rapid, and relatively accurate when supported by the parameters of LV systolic function described below.
Fractional Shortening
Defined as 100 × (LV end diastolic – LV end-systolic diameter ÷ LV end-diastolic diameter) using M-mode or 2D TTE or TEE and more commonly ranges from 25% to 45%.
E-Point Septal Separation
Mitral Annular Systolic Descent
A systolic descent of the septal or lateral mitral annulus toward the LV apex is normally ≥10 mm and is assessed by M-mode, 2D, 2D automated angle-independent speckle tracking of the septal and lateral annular motion, or RT3D TTE or TEE. The last two methods correlate highly with other quantitative methods of LVEF assessment (2,19,20). Septal wall excursion is lower than that of the lateral wall (Fig. 1.7).
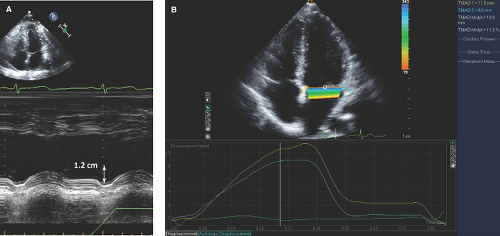 Figure 1.7: Normal LV function by assessment of mitral annular systolic displacement. A. Normal mitral annular lateral systolic displacement (toward the apex) of 1.2 cm by M-mode. B. Using a fast and automated 2D imaging angle-independent speckle tracking motion of the mitral annulus with a color overlay, a normal septal and lateral annular systolic displacement of 9.0 mm and 11.5 mm, respectively, were demonstrated. Also, note the corresponding displayed normal systolic and diastolic curves of the septal and lateral annulus motion. |
Aortic Root Motion
In subjects with normal LV stroke volume (usually but not always associated with normal LV systolic function), the anterior aortic root motion is >1 cm or 30 to 45 degrees from end diastole to its maximal anterior systolic excursion (Fig. 1.1C).
Stroke Volume and Cardiac Output
Stroke volume by 2D (as described previously) and by Doppler imaging is calculated as 0.785 (left ventricular outflow tract diameter [LVOT]) or (r) × LVOT velocity time integral (VTI):
LVOT is measured from TTE long parasternal 2D images during midsystole and within 1 cm from the aortic valve closure point.
LVOT VTI by pulsed Doppler is obtained from a TTE apical five-chamber view within 1 cm from the aortic valve in order to obtain a well-defined laminar flow.
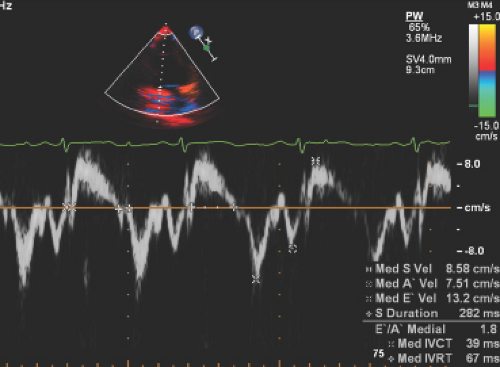 Figure 1.8: Normal LV ejection intervals. From the apical four-chamber view and using tissue Doppler imaging with the sample volume at the basal septum, IVCT measured from end of A’ velocity to onset of S’ velocity of 39 msec, ejection time (ET) measured from onset to end of S’ velocity of 282 msec, and IVRT from end of S’ to onset of E’ velocity of 67 msec were obtained. The calculated myocardial performance or Tei index (IVCT + IVRT/ET) was 38. |
Ejection Intervals
The isovolumic contraction time (IVCT) measured by M-mode (from onset of QRS to aortic valve opening), pulsed wave Doppler (from end of late mitral inflow or A wave to onset of LVOT VTI), or more accurately by tissue Doppler (from end of A velocity to onset of systolic or S velocity) is normally short (<60 msec) (Fig. 1.8).
Ejection time (ET) measured by M-mode (from opening to closing of the aortic valve), pulsed or continuous wave Doppler (from onset to end of LVOT VTI), or tissue Doppler (from onset to end of S wave) is normally <160 msec (Fig. 1.8). The initial period of ejection (time from onset to peak velocity of the aortic VTI) is also short (<60 msec).
Rate of Rise of Left Ventricular Systolic Pressure
The rate of rise of LV systolic pressure (dP/dt) is an index of systolic function and can be assessed in the presence of mitral regurgitation (MR).
Tissue Doppler
Myocardial systolic velocities (S) of the LV basal septal, lateral, anterior, and inferior walls are indicators of LV systolic function (4,22,23,24,25).
The S velocities include an initial higher velocity corresponding to isovolumic contraction and a biphasic velocity corresponding to ejection.
Normal ejection phase peak S velocities range from 9 to 16 cm/second.
Tei or Myocardial Performance Index
Assess both global LV systolic and diastolic function as is calculated as the sum of IVCT + isovolumic relaxation time (IVRT) ÷ ejection time.
Myocardial Deformation
Pitfalls
Simpson’s rule and RT3D accurate calculation of LVEF depend on endocardial resolution and operator experience and are relatively time-consuming.
Systolic strain and strain rate by speckle tracking echo are time-consuming and depend on endocardial resolution and operator experience.
Diastolic Function
Diagnostic Methods
Isovolumic Relaxation Time
IVRT is the time from aortic valve closure to mitral valve opening, reflects the time it takes for the LV pressure to fall below the left atrium (LA) pressure, and is the first phase of LV diastolic function (4,22,25,29).
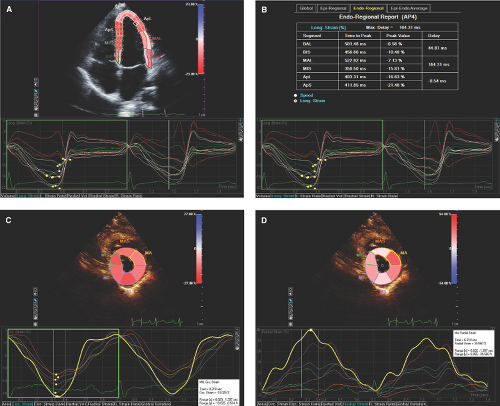
Figure 1.9: Left ventricular myocardial deformation. A. Longitudinal peak systolic myocardial strain curves with corresponding values (yellow dots) for each of the myocardial segments obtained from the apical four-chamber view are depicted. B. Corresponding values for each of the myocardial segments are displayed. Note the variable range from -6.58% for the basal anterolateral (BAL) wall to -21.48% for the apical septal (ApS) wall. Also, corresponding time to peak values are shown. C, D. Circumferential (C) and radial (D) peak systolic myocardial strain curves with corresponding values (yellow dots) obtained from the mid short-axis views are displayed. The yellow curves corresponding to the midanterior segment demonstrate a circumferential and radial strain values of -19.025% and 38.5%, respectively.
By pulsed or continuous wave Doppler, IVRT is obtained from TTE apical or TEE midesophageal five-chamber views with the sample volume between the mitral inflow and LVOT to obtain both velocity patterns. By tissue Doppler images, IVRT is obtained from the apical four- and two-chamber views.
It is measured from end of LVOT VTI to onset of mitral early (E) velocity wave or from end of systolic (S) to onset of early (E) diastolic velocity by tissue Doppler (4,22,23,30) (Fig. 1.8).
IVRT upper normal values for subjects 20 to 40, 40 to 60, and >60 years of age are 83 msec, 88 msec, and 101 msec, respectively (Table 1.2).
Mitral Inflow Pattern
Mitral inflow velocities are best imaged from TTE apical or TEE midesophageal four-chamber views with a sample volume of 1 to 3 mm placed within the LV and between the leaflets’ tip or coaptation point.
Table 1.2 Normal parameters of left ventricular diastolic function
Parameter
Age (years)
21–40 Mean (range)
41–60 Mean (range)
>60 Mean (range)
IVRT (msec)
67 (51–83)
74 (60–88)
87 (73–101)
E/A ratio— (range)
1.53 (0.73–2.33)
1.28 (0.78–1.78)
0.96 (0.6–1.32)
A duration (msec)
127 (101–153)
133 (107–159)
138 (100–176)
E deceleration time (msec)
166 (138–194)
181(143–219)
200 (142–258)
PV S/D ratio
0.98 (0.34–1.62)
1.21 (0.81–1.61)
1.39 (0.45–2.33)
PV Ar velocity (cm/s)
21 (5,6,7,8,9,10,11,12,13,14,15,16,17,18,19,20,21,22,23,24,25,26,27,28,29,30,31,32,33,34,35,36,37)
23 (17,18,19,20,21,22,23,24,25,26,27,28,29)
25 (11,12 Related posts:

Stay updated, free articles. Join our Telegram channel

Full access? Get Clinical Tree

 Get Clinical Tree app for offline access


