The End-Tidal CO2 Monitor is More Than Just a “The Tube is the Airway” Device
Brian Woodcock MB, CHB, MRCP, FRCA, FCCM
Anesthesia providers most commonly use a capnogram to confirm tracheal intubation and to exclude the possibility of esophageal intubation. However, the ETCO2 level shown by the capnogram and the pattern of the capnogram can also indicate many hemodynamic and respiratory conditions. Anesthesia providers should recognize that many conditions may lead to an increased arterial-end-tidal CO2 gradient.
REVIEW OF CAPNOGRAPHY
The most commonly used capnometers are of the infrared (IR) light absorption type. The analysis can occur at the machine or in the ventilator circuit. In the first instance, airway gases can be sampled along a narrow tube to the machine. Alternatively, an adaptor placed in the airway circuit uses IR light absorption to measure the CO2 concentration directly in the gas stream. This second method provides a very fast response time and avoids problems with clogged tubing and water vapor condensation. It has fallen out of favor because of the extra weight near the endotracheal tube, a concern about reusing a device within the circuit, and the fact that the externalization of the sensor makes it more prone to damage during usage.
CAPNOMETRY VERSUS CAPNOGRAPHY
Capnometry is the determination of the end-tidal partial pressure of CO2. Capnography is the graphic display of instantaneous CO2 partial pressure versus time during the respiratory cycle. This relation is displayed as a CO2 waveform or capnogram. The simplest use of measured end-tidal CO2 (ETCO2) is to follow changes in PaCO2 level. Although the ETCO2 level may be lower than the actual PaCO2 level, in the absence of severe dead-space effects, alterations in PaCO2 level will be mirrored by changes in ETCO2 level, and these changes can be continuously monitored. This may be particularly useful when changes in minute ventilation are made and PaCO2 levels are changing.
The waveform produced by the monitor as a capnogram gives further information in addition to the numeric value of the ETCO2.
NORMAL CAPNOGRAM
Dead space (ventilated but unperfused airway) can be divided into apparatus and anatomic (or conductive) dead space, which is in series with the alveoli, and alveolar (or physiologic) dead space, which is in parallel with the alveoli.
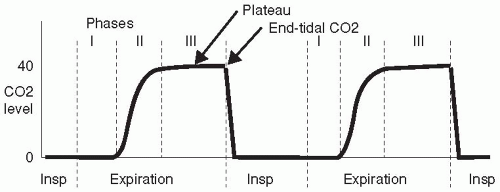
Apparatus and anatomic dead space causes the initial expired gas to have a CO2 level of zero (phase I, Fig 87.1.). As expiration continues, alveolar gas is detected and the capnogram rises rapidly (phase II). In phase III, known as the alveolar plateau, the apparatus and anatomic dead-space gases have been expired and the gas sampled is from alveoli. If all these alveoli were perfused, then the CO2 level would be that of “ideal” alveolar gas, i.e., very close to the PaCO2 level. However, the CO2 level is lower than the PaCO2 level during the plateau because of admixture of gas from unperfused alveoli with a CO2 level of zero (alveolar dead space). This means that the ETCO2 level will be close to the PaCO2 level in patients with low alveolar dead space; however, if alveolar dead space increases (e.g., as in emphysema), then the ETCO2 will be reduced, compared to PaCO2. The difference between end-tidal and arterial CO2 level depends on alveolar dead space and is not altered by changes in apparatus or anatomic dead space.
FACTORS INFLUENCING ALVEOLAR DEAD SPACE
Table 87.1. lists the factors influencing alveolar dead space.
Ventilation-perfusion mismatch increases the arterial-end-tidal CO2 gradient, and studies have shown this increase to be significantly higher in patients with morbid obesity (body mass index >40 kg/m2) and in patients receiving anesthesia in the lateral position. Increased gradients have also been reported in older patients; in patients with a high American Society of Anesthesiologists’ physical status classification system (ASA) score; and in patients having episodes of hemodynamic instability, during such episodes.
TABLE 87.1 FACTORS INFLUENCING ALVEOLAR DEAD SPACE | ||||||||||||||
|---|---|---|---|---|---|---|---|---|---|---|---|---|---|---|
| ||||||||||||||
Stay updated, free articles. Join our Telegram channel

Full access? Get Clinical Tree


