Transesophageal echocardiography (TEE) is remarkably efficient and effective in revealing a wide spectrum of new findings and information during periods of hemodynamic instability. Since TEE technology is now readily accessible in most settings, TEE is increasingly used during noncardiac surgical procedures. However, in contrast to the cardiac surgery setting, little evidence supports the routine use of TEE in noncardiac surgery. This is largely due to the fact that the validated indications for intraoperative TEE are for use as a diagnostic tool, and not a monitor (Table 21–1). The majority of established indications in cardiac surgery directly pertain to the planned surgical procedure, or the assessment of relevant anatomical structures. To date, no large randomized trials have assessed the impact of intraoperative TEE on outcome in noncardiac surgery. Several reviews, however, have debated the use of TEE in noncardiac surgery.1–8
| I. Cardiac and Thoracic Aortic Procedures |
| • Cardiac and Thoracic Aortic Surgery |
| • For adult patients without contraindications, TEE should be used in all open heart (eg, valvular procedures) and thoracic aortic surgical procedures, and should be considered in CABG surgeries as well to: |
| • Confirm and refine the preoperative diagnosis |
| • Detect new or unsuspected pathology |
| • Adjust the anesthetic and surgical plan accordingly |
| • Assess results of the surgical intervention |
| • In small children, the use of TEE should be considered on a case-by-case basis because of risks unique to these patients (eg, bronchial obstruction) |
| • Catheter-Based Intracardiac Procedures |
| • For patients undergoing transcatheter intracardiac procedures, TEE may be used |
| II. Noncardiac Surgery |
| • TEE may be used when the nature of the planned surgery or the patient’s known or suspected cardiovascular pathology might result in severe hemodynamic, pulmonary, or neurologic compromise |
| • If equipment and expertise are available, TEE should be used when unexplained life-threatening circulatory instability persists despite corrective therapy |
| III. Critical Care |
| • For critical care patients, TEE should be used when diagnostic information that is expected to alter management cannot be obtained by TTE or other modalities in a timely manner |
Life-threatening intraoperative hemodynamic collapse is an indication for the use of TEE (ASA/SCA guidelines).9 TEE in this setting could rapidly identify abnormalities and help in establishing a diagnosis, monitor the response to treatment, and may have some prognostic value.
The etiology of precipitating events may be difficult to diagnose, since these are often only transiently manifested. Nevertheless, TEE can be useful in diagnosing the majority of specific cardiovascular abnormalities associated with cardiovascular collapse. These include pulmonary embolism, myocardial ischemia, hypovolemia and pericardial tamponade. Specific conditions that have to be ruled out systematically are listed in Table 21–2. The transgastric midpapillary short-axis view is a useful starting point in the evaluation of acute hemodynamic disturbances. From this view contractility and preload can be readily assessed.
| 1. Right or left ventricular dysfunction (global or regional; systolic or diastolic) |
| 2. Significant valvular disease |
| 3. Hypovolemia |
| 4. Dynamic left ventricular outflow tract obstruction |
| 5. Pulmonary embolism |
| 6. Pericardial tamponade |
| 7. Aortic dissection |
| 8. Intracardiac shunts |
Hypovolemia is a common finding in perioperative hemodynamic decompensation. Several techniques have been validated to objectively quantify left ventricular (LV) chamber dimensions. However, these usually require measurement of LV dimensions in short- and long-axis views to incorporate into a volume formula, which can be time consuming. In the setting where several potential precipitating causes of hemodynamic collapse have to be rapidly ruled out, more accurate volume calculations probably add little additional value over instant qualitative assessment or simple area measurements. Obliteration of the LV cavity is said to provide an instant diagnosis of inadequate LV preload. However, 20% of cases with systolic cavity obliteration may occur in the setting of reduced afterload and/or increased ejection fraction, and not hypovolemia.10 Furthermore, patients with chronic dilated cardiomyopathy may require more filling than patients with normal cardiac function, and hypovolemia is more difficult to recognize in this situation. Taking multiple measurements and evaluating filling in multiple imaging planes can improve the accuracy of TEE estimates of LV volumes. When compared with more traditional hemodynamic parameters of LV volume, such as central venous pressure (CVP) and pulmonary artery wedge pressure (PAWP), which are dependent on compliance, TEE provides a more sensitive and reliable method for detecting hypovolemia.11 Even though it provides a good starting point in rapidly assessing volume status, the transgastric midpapillary short-axis view does not provide a good estimate of right ventricular (RV) volume, and relying on this imaging plane alone in guiding volume replacement can lead to RV distention.
In suspected pulmonary embolism, TEE allows direct visualization of the venae cavae, the right atrium (RA), the RV, the right ventricular outflow tract, and the right pulmonary artery (PA). The two key features of acute pulmonary embolism are thrombus in the right heart (Figure 21–1) and acute right ventricular dysfunction (Figure 21–2 and Table 21–3). Since the right PA is in greater flow continuity with the pulmonary trunk, emboli are consistently found on the right, but in severe cases, the distribution of emboli is most commonly bilateral. Pulmonary embolism cannot be excluded based on absence of thrombus alone. Conversely, pulmonary embolism should always be suspected in the presence of acute right ventricular pressure overload, and hemodynamically significant pulmonary embolism can essentially be ruled out in the absence of right ventricular dysfunction. RV dysfunction has been recognized in the International Cooperative Pulmonary Embolism Registry as an independent predictor of death.12 In prolonged cardiac arrest, about 20 minutes following the initiation of cardiopulmonary resuscitation, intracardiac thrombus could develop as a result of the low flow state.13 This is associated with a very poor prognosis, but should not be confused with thromboembolism.

Figure 21-2.
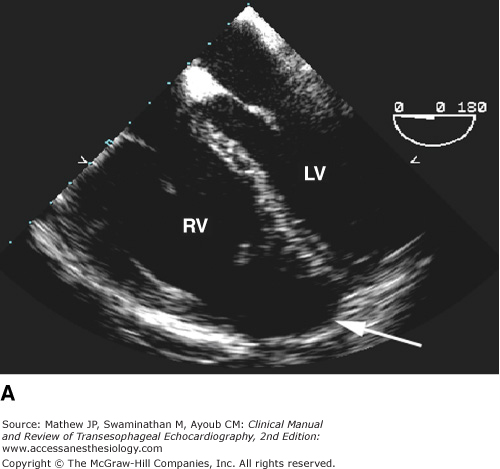

Acute right ventricular failure. A: In the long-axis view, the right ventricle is dilated and appears to be greater than two-thirds the size of the left ventricle, and the apex of the heart includes the right ventricle (arrow). B: In the short-axis view, a small, hyperdynamic left ventricle is seen with a dilated right ventricle. (LV, left ventricle; RV, right ventricle.)
Thrombus | Acute Right Ventricular Dysfunction |
|---|---|
| 1. Distinct edges | 1. Elevated RA/RV pressure gradient (>30 mm Hg) |
| 2. Protrudes into vascular lumen | 2. Dilation of RV, RA, and IVC |
| 3. Visible in multiple planes | 3. Leftward bulging of interatrial septum |
| 4. Moves distinct from vascular wall or blood | 4. Flattening of interventricular septum |
An ideal monitor should have a high sensitivity and specificity, should be easy to learn and use, and should provide real-time continuous and reproducible information. The unique versatility of TEE in rapidly assessing left and right ventricular function, fluid status, and the effect of therapeutic interventions with great precision is unrivaled, and associated risks are minimal. Therefore, it is increasingly utilized as a monitoring device in high-risk patients undergoing all types of surgery. TEE as a complement to invasive monitoring, or as a stand-alone physiologic monitor has not been shown to improve patient outcome. Nevertheless, when it comes to the assessment of myocardial contractility, preload, and ischemia, TEE may offer valuable additional information.
TEE-based ischemia monitoring in patients at increased risk of myocardial ischemia or infarction remains a common indication.9 In addition to appreciating the additional benefit TEE could provide over standard electrocardiographic (ECG) monitoring, the clinician should also have a detailed understanding of the shortcomings of TEE as an ischemia monitor.
The movement of the heart during a cardiac cycle is a complex three-dimensional motion captured in real time by TEE as a two-dimensional or M-mode image. There are two distinct events during normal systole: thickening of the myocardial wall and endocardial excursion (inward movement of the endocardial surface during systole). Normal LV wall motion is defined as 30% to 50% thickening of the myocardium during systole at the midpapillary level. Greater degrees of thickening occur at the apex as opposed to the base. Wall thickening is an important component of evaluation, because it may help distinguish between ischemic and nonischemic (variable loading conditions, rhythm disturbances, etc) wall motion abnormalities.
TEE has been demonstrated to be more sensitive than ECG in detecting ischemia. Wall motion abnormalities have been reported to occur within 15 seconds of coronary occlusion, whereas ST segment elevations are seen after only 30 to 60 seconds. While this time difference may not have much clinical relevance, echocardiography is able to detect reductions (as opposed to total occlusion) in coronary blood flow more readily than surface electrocardiography. ECG changes do not occur until coronary flow is decreased by 75%, whereas segmental contraction abnormalities are evident with a 50% decrease in flow.14 The occurrence of new regional wall motion abnormalities (RWMAs) after cardiopulmonary bypass (CPB) has been correlated with adverse clinical outcomes in patients undergoing cardiac surgery.15–17 In contrast, RWMA in patients undergoing noncardiac surgery correlates poorly with postoperative cardiac complications.18
Although the sensitivity for ischemia detection by TEE is established, the specificity and implications of a transient RWMA are less clear. The normal ventricle displays a wide range of contraction patterns under normal circumstances.19 This is thought to occur in part because different segments of the ventricle reach their peak contraction at different points within the cardiac cycle. Identification of abnormal contraction patterns based solely on a comparison with adjacent ventricular segments may therefore be an inadequate indicator of myocardial ischemia. Further, although dyskinesia and akinesia are rarely found in the normal heart, mild hypokinesia is frequently observed and may represent normal regional heterogeneity. The normal myocardium also displays transmural heterogeneity of contraction, decreasing from endocardium to epicardium.
Apart from normal heterogeneity, other factors that could cause RWMAs should also be considered. Acute alterations in LV loading conditions (decreased preload or increased afterload) may depress LV function without directly affecting coronary flow. Similarly, myocardial “stunning” may result in the persistence of an RWMA well after the restoration of normal coronary blood flow. Moreover, tethering of normal cardiac tissue to an ischemic area of muscle may result in an area of dysfunctional myocardium that appears larger than the actual ischemic zone. Nonischemic causes of RWMAs are listed in Table 21–4.
| Coronary artery disease related: |
| Infarcted myocardium |
| Stunned myocardium |
| Altered loading: |
| Severe increases in afterload |
| Marked reduction in preload |
| Tethering |
| Normal regional heterogeneity: |
| Range of segmental radial shortening: 0% to 100% |
| Range of segmental wall thickening: 0% to 150% |
| Abnormal conduction: |
| Left bundle branch block |
| Paced rhythm |
Additional limitations to the use of TEE as a method for diagnosing myocardial ischemia arise because of variations in coronary artery distribution. Approximately 70% of patients have a right-dominant coronary circulation in which the posterior descending artery arises from the right coronary circulation to supply the inferior and inferoseptal walls. In 10% of patients, the coronary circulation is left dominant, in that the posterior descending artery arises from the circumflex artery, and the remaining 20% are co-dominant. There is also marked individual variability in the blood supply to the LV apex. Although the midpapillary short-axis view is ideal for monitoring ischemia in areas supplied by the major epicardial vessels, it may not reflect ischemia involving more peripheral and smaller coronary arterioles. As a result, basilar, apical, or RV ischemia may go undiagnosed. In fact, the sensitivity and specificity of recognizing intraoperative ischemic episodes echocardiographically in real time are only moderate (76% for both), with substantial variability in evaluating the severity of regional dysfunction.20 This could partly explain the discordance between TEE and ECG changes reported in surgical populations. In studies comparing ECG and TEE, only about 25% of patients had temporal overlap between TEE and ECG ischemic changes,18 and only 15% of patients who developed postoperative myocardial infarction were identified by both modalities.15 Another potential explanation for the observed discordance is that ECG does not readily detect repolarization abnormalities in the inferior wall, an area where RWMAs are commonly observed. Monitoring the long-axis of the left ventricle in addition to the standard short-axis view may increase the detection of ischemia by approximately 40%. Advancements in technology that permit simultaneous multiplane imaging of a coronary distribution (eg, real-time three-dimensional echocardiography) may improve the ischemia detection capacity of TEE (see Chapter 24).
The introduction of the pulmonary artery catheter (PAC) in the 1970s dramatically changed the perioperative management of critically ill patients. The use of the PAC significantly increased diagnostic ability, allowing clinicians to optimize cardiac output (CO) and oxygen delivery, while reducing the risk of pulmonary edema by avoiding excessive increases in PAWP. Although previously established that PAC-guided hemodynamic optimization of high-risk patients, prior to the onset of organ failure, significantly reduces mortality, more recent data have implicated the use of the PAC in increasing mortality.21
The information derived from a PAC is based on pressure and flow measurements. In comparison, TEE allows the anesthesiologist to visualize the heart and measure filling volumes more accurately, while offering a less invasive alternative for measuring CO. TEE provides real-time evaluation of both cardiac anatomy and function that complements invasive hemodynamic monitoring. Its use in patients undergoing major noncardiac surgery may benefit the clinician in making decisions regarding fluid management, initiation of vasoactive infusions, and evaluation of myocardial ischemia. However, whether a TEE-guided treatment algorithm could be used to guide hemodynamic optimization has yet to be determined. It may be difficult to establish an outcome benefit, given the nature of associated complications and the improvement in both intraoperative and postoperative management of high-risk surgical patients in recent years.
The ability to steer a pulsed-wave or continuous-wave Doppler beam parallel to the direction of blood flow makes TEE CO measurement possible in more than 95% of patients.22 The flow volume passing through a vessel or an orifice can be calculated as the product of the velocity-time integral (VTI) and the cross-sectional area (CSA). The preferred sites for determining stroke volume (SV) and CO are the left ventricular outflow tract (LVOT), the aortic annulus, the mitral annulus, and the pulmonic annulus. Of these sites, the LVOT is used most often, since the entire systemic SV traverses the LVOT, flow is usually laminar, and the LVOT is a circular structure with a relatively constant diameter throughout systole. SV is derived as:
SV = CSA × VTI
Related posts:


Stay updated, free articles. Join our Telegram channel

Full access? Get Clinical Tree


