Selection and Interpretation of Diagnostic Tests
Diagnostic tests are often essential to patient care. Although the history and physical examination remain the foundation of a clinical database and sometimes suffice, the limits to what we can know about a patient are continually expanding with the addition of new diagnostic tests. These tests have many uses: (a) to make a diagnosis in a patient known to be sick, (b) to provide prognostic information for a patient with known disease, (c) to identify a person with subclinical disease or at risk for subsequent development of disease, and (d) to monitor ongoing therapy. The ultimate objective is to reduce morbidity and mortality. However, physicians and patients must avoid pitfalls along the way that can result from misuse or misinterpretation of laboratory tests.
Pitfalls are more likely to be avoided if the physician appreciates the inherent uncertainty and probabilistic nature of the diagnostic process and understands the relationship between the characteristics of a diagnostic test and those of the patient(s) being tested. Sometimes a diagnosis is evident when a patient presents with a pathognomonic constellation of signs and symptoms. The proportion of diagnoses that can be so recognized increases with the physician’s experience and knowledge.
In many cases, however, presenting signs or symptoms are not specific. Instead, they can be explained by a number of diagnoses, each with distinctly different implications for the patient’s health. In these cases, on completion of the history and physical examination, the clinician considers a list of conditions, referred to as the differential diagnosis, which might explain the findings. The diagnoses can then be ranked to reflect an implicit assignment of probabilities to each. Such a ranking can be thought of as the physician’s index of suspicion for each condition, based on knowledge and past experience with similar patients. The purpose of subsequent laboratory testing is to refine the initial probability estimates and, in the process, to revise the differential diagnosis. The probability of any particular disease on the revised list will depend on its probability of being present before testing and the validity of the information provided by test results.
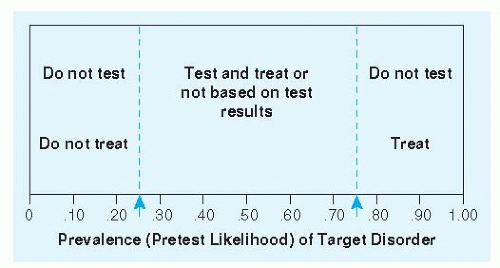
Often the physician will focus on the presence or absence of a single disease. For example, is the chest pain caused by coronary insufficiency or not? Is the sore throat due to pharyngitis caused by group A beta-hemolytic streptococci or not? Elements of the history and physical exam provide a basis for estimating the probability of the condition in question. Dull substernal pain or pressure radiating to the left arm makes coronary insufficiency more likely. Sharp pain and tenderness make it less likely. Fever, tonsillar exudates, or tender anterior lymphadenopathy makes group A beta-hemolytic streptococci infection more likely. Cough makes it less likely. This process may lower the probability below a threshold for action in which the most prudent course is to move on and behave as if the condition is not present. Alternatively, the evolving diagnostic process may raise the probability high enough to simply get on with treatment. If the probability is between these two thresholds, further diagnostic testing is warranted. This threshold approach is illustrated in Figure 2-1. Implicit in the approach are three distinguishable tasks: (a) Estimate the pretest probability of disease based on characteristics of the patient, including symptoms and signs; (b) revise the probability of disease based on new information, including results of diagnostic tests; and (c) know where the probability thresholds are—how low does the probability have to be to behave as if the condition is not present, and how high does it have to be to behave as if it is?
Terminology is important in diagnostic test interpretation. Clinical pathologists often focus on a test’s accuracy and precision. Accuracy is the degree of closeness of the measurement made to the true value, as measured by some alternative gold standard or reference test. Precision is a test’s ability to give nearly the same result in repeated determinations. Clinicians, on the other hand, are more concerned with the ability of a test result to discriminate between persons with and persons without a given disease or condition; this discriminating ability can be characterized by a test’s sensitivity and specificity. Sensitivity is the probability that a test result will be positive when the test is applied to a person who actually has the disease. Specificity is the probability that a test result will be negative when the test is applied to a person who actually does not have the disease. A perfectly sensitive test can rule out disease if the result is negative. A perfectly specific test can rule in disease if the result is positive. Because most tests are neither perfectly sensitive nor perfectly specific, the result must be interpreted probabilistically rather than categorically.
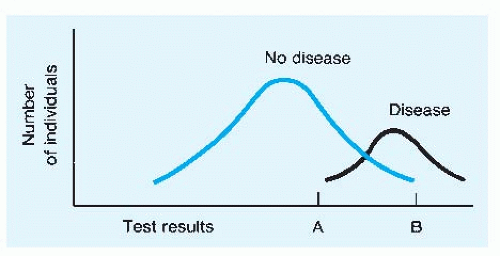
Often there is a trade-off that can be made between the sensitivity and the specificity of a test. More-stringent criteria for making a diagnosis, or behaving as if the condition is present, will have lower sensitivity and higher specificity than less-stringent criteria. The most graphic examples of this principle involve tests that provide quantitative results, such as the measurement
of serum prostate-specific antigen (PSA) when the diagnosis of prostate cancer is being considered. The general case is illustrated in Figure 2-2. Note that the “normal” values for the test results are all too often derived from frequency distributions of results among apparently well persons; the potential trade-off between sensitivity and specificity is not considered.
of serum prostate-specific antigen (PSA) when the diagnosis of prostate cancer is being considered. The general case is illustrated in Figure 2-2. Note that the “normal” values for the test results are all too often derived from frequency distributions of results among apparently well persons; the potential trade-off between sensitivity and specificity is not considered.
Although sensitivity and specificity are important considerations in selecting a test, the probabilities they measure are not in themselves what ordinarily concern the physician and the patient after the test result has returned. Both are concerned with the following questions: If the result is positive, what is the probability that disease is present? If the result is negative, what is the probability that the patient is indeed disease-free? These probabilities are known respectively as the predictive value positive and the predictive value negative. They are determined not only by the sensitivity and the specificity of the test but also by the probability of the disease being present before the test was ordered.
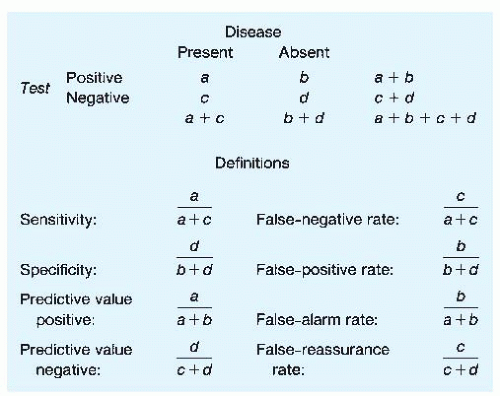
Relationships between sensitivity and specificity and positive and negative predictive values can be better understood by referring to a two-by-two table (Fig. 2-3). The two columns indicate the presence or absence of disease (note that a gold standard of diagnosis is assumed), and the two rows indicate positive or negative test results. Any given patient with a test result could be included in one of the four cells labeled a, b, c, or d. Definitions of sensitivity, specificity, predictive value positive, and predictive value negative can be restated by using these labels. It is important to note that each of these four ratios has a complement. The complement of sensitivity (1 — sensitivity) is referred to as the false-negative rate, whereas the complement of specificity (1 — specificity) is referred to as the false-positive rate. These terms have often been used ambiguously in the medical literature; the false-negative rate is confused with the complement of the predictive value negative, which is best termed the false-reassurance rate; the false-positive rate is confused with the complement of the predictive value positive, which is best termed the false-alarm rate.
When clinicians interpret test results, they usually process the information informally. Rarely is a pad and pencil or a calculator used to revise probability estimates explicitly. However, sometimes the revision of diagnostic probabilities is counterintuitive; for instance, it has been shown that most clinicians rely too heavily on positive test results when the pretest probability or disease prevalence is low.
Attention to the two-by-two table indicates why predictive values are crucially dependent on disease prevalence. This is particularly true when one is using a test to screen for a rare disease. If a disease is rare, even a very small false-positive rate (which is, remember, the complement of specificity) is multiplied by a very large relative number—that is, (b + d) is much greater than (a + c). Therefore, b will be surprisingly large relative to a, and the predictive value positive will be counterintuitively low. Examples of this effect are evident in Table 2-1.
Consider the example of a noninvasive test to detect coronary disease applied to a 50-year-old man with a history of atypical chest pain. Based on test evaluations reported in the literature, the sensitivity and the specificity of the test can be estimated at 80% and 90%, respectively. Based on symptoms and risk factors, the clinician estimates that the patient’s pretest probability of coronary disease is 0.20. (This is the same as saying that the prevalence of coronary disease in a population of similar patients would be 20%.)
According to Figure 2-3, with a pretest probability of 0.20, a + c = 0.20 and b + d = 0.80. Multiplying 0.20 by 0.8 (the sensitivity) gives a value of 0.16 for a (subtraction gives a value of 0.04 for c). Multiplying 0.80 by 0.9 (the specificity) gives a value of 0.72 for d (again, subtraction gives 0.08 for b). The predictive value positive, then, is 0.16/0.24, or 0.67. The predictive value negative is 0.72/0.76, or 0.95.
Stay updated, free articles. Join our Telegram channel

Full access? Get Clinical Tree


