 Most of the O2 transported in blood is bound to hemoglobin, and this combination is sensitive to CO2, pH, temperature, and phosphates. Developmental differences in O2-hemoglobin binding are explained by differences between adult and fetal hemoglobin.
 The first step in O2 transport is alveolar ventilation ([V with dot above]A), which is a function of respiratory rate, tidal volume, and dead space volume.
 Oxygen diffusion from alveolar gas to pulmonary capillary blood is effective at equilibrating alveolar and arterial PO2 (PAO2 = PaO2) under most conditions.
 The four major causes of arterial hypoxemia are hypoventilation, shunt, diffusion limitation, and ventilation-perfusion mismatch, which can be diagnosed by relatively simple tests and measuring the alveolar-arterial PO2 difference (PAO2 – PaO2).
 Pulmonary mechanics is classically modeled as a capacitor (the elastance), a resistor (the airway and tissue resistance), and an inductor (primarily the inertia of the gas in the large airways) as a series circuit.
 The elastic mechanical structure of the lungs, in conjunction with the surfactant system, makes the lung inflate uniformly and retain its end-expiratory volume to promote a good match of ventilation to perfusion. Mechanical ventilation of the immature lungs has special considerations, including surfactant replacement therapy.
 Airflow limitation is a prominent feature of diseased lungs and is usually inferred from spirometric pulmonary function testing. Airflow limitation during mechanical ventilation may depend on the degree of inflation of the lungs, the resistance of the artificial airway, and the pattern of ventilation.
 Recent developments of the forced oscillation technique have provided a deeper insight into the various mechanical components of the lung and may be applied clinically.
 The pulmonary circulation has lower pressures and thinner vessel walls than the systemic circulation. Pulmonary vascular resistance is highly dependent on mechanical forces in the lungs and, in contrast to the systemic circulation, is increased by hypoxia.
 Breathing is controlled by a negative feedback from chemoreceptors sensing arterial blood gas levels and mechanoreceptors from the lungs, airways, and chest wall acting on a respiratory rhythm generator in the brainstem.
 The respiratory rhythm is generated by the integration of network, synaptic, and cellular properties of central neurons but it can be changed voluntarily, as well as being modulated by reflexes and being sensitive to the state of consciousness.
 Developmental changes in respiratory control, and sensitivity to hypoxia, are explained by maturation of the central nervous system (CNS), peripheral sensory processes, the lung, and respiratory muscles.
alveolar gas and arterial blood. The circulation and O2 diffusion from capillaries to tissues cause the large decreases in PO2 between arterial and venous blood, and between blood and mitochondria in the tissues.
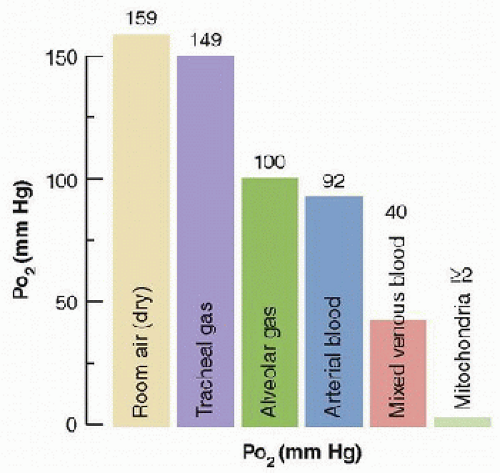 FIGURE 43.1. The “oxygen cascade” in a healthy subject breathing room air at sea level shows the pattern of PO2 decrease between the different steps of O2 transport. The difference between alveolar and arterial PO2 occurs because of pulmonary gas exchange limitations. (From Powell FL. Pulmonary gas exchange. In: Johnson LR, ed. Essential Medical Physiology. 3rd ed. Boston, MA: Elsevier/Academic Press, 2003, with permission.) |
TABLE 43.1 SYMBOLS IN RESPIRATORY PHYSIOLOGY | ||||||||||||||||||||||||||||||||||||||||||||||||||||||||||||||||||||||||||
|---|---|---|---|---|---|---|---|---|---|---|---|---|---|---|---|---|---|---|---|---|---|---|---|---|---|---|---|---|---|---|---|---|---|---|---|---|---|---|---|---|---|---|---|---|---|---|---|---|---|---|---|---|---|---|---|---|---|---|---|---|---|---|---|---|---|---|---|---|---|---|---|---|---|---|
| ||||||||||||||||||||||||||||||||||||||||||||||||||||||||||||||||||||||||||
complicated, nonlinear relationship (Fig. 43.2) but this shape is essential for life as we know it. The normal O2 concentration in arterial blood (CaO2) is ˜20 mL/dL but only 0.3 mL / dL is physically dissolved (note the usual units for O2 and CO2 concentration in blood are mL/dL, also called volume %, and 1 mL/dL ≈ 0.45 mmol/L for ideal gases). If arterial blood only contained dissolved O2, then cardiac output would have to be 100 L/min to deliver enough O2 to the tissues for a normal adult metabolic rate of 300 mL O2/min!
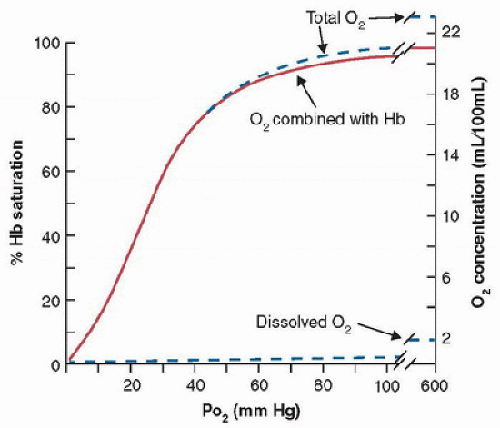 FIGURE 43.2. Standard human O2-blood equilibrium (or dissociation) curve at pH = 7.4, PCO2 = 40 mm Hg, and 37°C. Left ordinate shows O2 saturation of hemoglobin (Hb) available for O2 binding; right ordinate shows absolute O2 concentration in blood. Most O2 is bound to hemoglobin, and dissolved O2 contributes very little to total O2 concentration. (From Powell FL. Oxygen and CO2 transport in the blood. In: Johnson LR, ed. Essential Medical Physiology. 3rd ed. Boston, MA: Elsevier/Academic Press, 2003, with permission.) |
by the stimulation of red blood cell production in bone marrow by the hormone erythropoietin or by transfusion. Erythropoietin transcription is regulated by hypoxia-inducible factors (HIF-1 and 2) released from cells in the kidneys in response to decreases in arterial O2 levels. Polycythemia (increased Hct) occurs with chronic hypoxemia in healthy people (e.g., during acclimatization to altitude) and with disease.
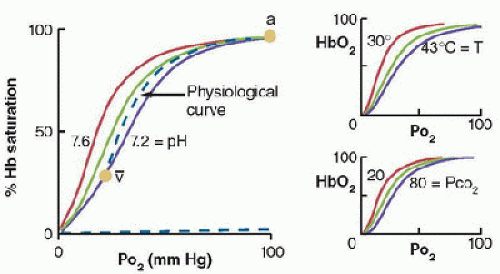 FIGURE 43.3. Effects of pH and PCO2 (i.e., Bohr effect) and temperature on the position of the O2-hemoglobin (HbO2) equilibrium curve. The “physiological” curve connects the arterial (a) and mixed-venous points ([v with bar above]), so that the in vivo curve is steeper than the standard curve at pH = 7.4 (green). (From Powell FL. Oxygen and CO2 transport in the blood. In: Johnson LR, ed. Essential Medical Physiology. 3rd ed. Boston, MA: Elsevier/Academic Press, 2003, with permission.) |
O2-blood equilibrium curves. Blood holds more CO2 than O2, in part because CO2 is carried by blood in three forms (Fig. 43.5). Also, the CO2-blood equilibrium curve is steeper than the O2 curve, resulting in a smaller range of PCO2 values in the body, compared with the range of PO2 values, although the differences between arterial and venous concentrations are similar for CO2 and O2 (˜5 mL/dL of blood). The resulting physiologic CO2 dissociation curve between the arterial and venous points is much more linear than the physiologic O2 dissociation curve (Fig. 43.5).
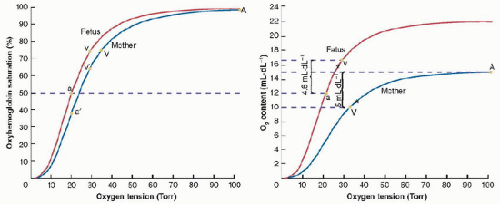 FIGURE 43.4. Oxygen-hemoglobin equilibrium curves for maternal and fetal hemoglobin. A: When PO2 equilibrates between the fetal and maternal circulations, O2 saturation is increased by 10% or more because of the lower P50 in fetal hemoglobin. B: Higher O2 capacity of fetal compared to maternal blood further increases the amount of O2 in blood for a given PO2 and saturation. A, maternal arterial, V, maternal venous; a′, umbilical (maternal) arterial; v′, umbilical (maternal) venous; a, fetal arterial; v, fetal venous. (From Powell FL. Pulmonary gas exchange. In: Johnson LR, ed. Essential Medical Physiology. 3rd ed. Boston, MA: Elsevier Academic Press, 2003, with permission.) |
the cell. The chloride shift (Hamburger shift) is an increased intracellular chloride level with increased CO2, or vice versa. The H+ produced from CO2 reacts with Hb and affects both the O2 equilibrium curve (Bohr effect) and CO2 equilibrium curve, as described next.
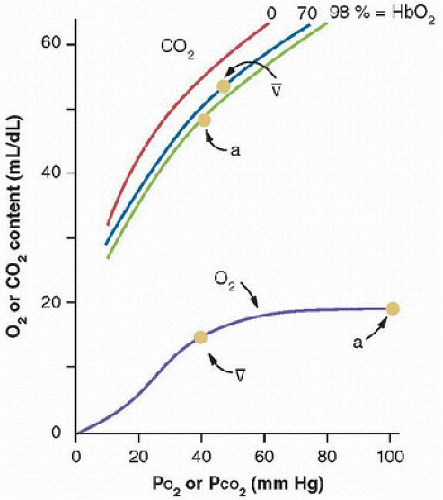 FIGURE 43.5. CO2-blood equilibrium curve shown on same graph with O2 equilibrium curve. Differences between the curves result in higher CO2 concentrations in the blood and smaller PCO2 differences between arterial (a) and venous ([v with bar above]) blood. Hemoglobin-O2 saturation affects the position of the CO2 equilibrium curve (i.e., Haldane effect). (From Powell FL. Oxygen and CO2 transport in the blood. In: Johnson LR, ed. Essential Medical Physiology. 3rd ed. Boston, MA: Elsevier/Academic Press, 2003, with permission.) |
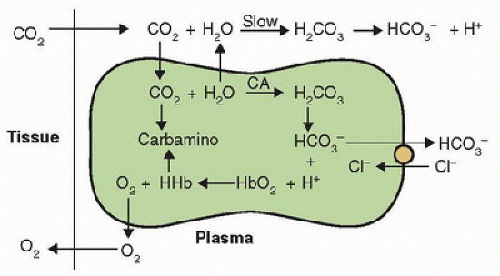 FIGURE 43.6. CO2 and O2 reactions in blood and tissues; the opposite reactions occur in the lungs. CA, carbonic anhydrase; HHb, protonated hemoglobin. (From Powell FL. Oxygen and CO2 transport in the blood. In: Johnson LR, ed. Essential Medical Physiology. 3rd ed. Boston, MA: Elsevier/Academic Press, 2003, with permission.) |
Related posts:

Stay updated, free articles. Join our Telegram channel

Full access? Get Clinical Tree


