Respiratory Monitoring
KEY POINTS
1 Although pulse oximetry is an invaluable clinical tool, it provides a signal-averaged number, the output of which lags behind the actual physiologic value of interest. Pulse oximetry is influenced by extraneous rhythmic vibration, carbon monoxide, and methemoglobin. Even if the recorded pulse rate correlates exactly with an independently measured value, oximetry loses accuracy when true arterial saturation falls to less than 80%.
2 After a step change in ventilation, arterial carbon dioxide concentration approaches steady-state equilibrium less quickly than does the arterial oxygen tension because the storage reservoir of the body for CO2 is far larger than that for O2.
3 The compliance of the respiratory system is influenced by the number of patent alveolar units, by their elasticity, and by the characteristics of the surrounding chest wall. The static and dynamic pressure volume curves of the respiratory system can provide vital information unavailable through computation of simpler indices, such as tidal compliance.
4 The mechanics of breathing (resistance and compliance) are most easily assessed during passive inflation with a known constant flow, using an end-inspiratory pause. During active breathing, the mechanical properties of the lung can be assessed if pleural pressure is recorded using an esophageal balloon.
5 Auto-PEEP, usually a reflection of dynamic hyperinflation, contributes to the work of breathing and patient-ventilator asynchrony. Because auto-PEEP varies from site to site throughout the lungs of a diseased patient, the externally measured value may not accurately reflect the degree of overdistention. In obstructive diseases (asthma, cronic obstructive lung disease), the end-inspiratory plateau pressure indicates the degree of hyperinflation better than does auto-PEEP itself.
6 The flow tracing can be used to detect (but not quantify) auto-PEEP, airway secretions, and poor coordination between the tidal rhythms of patient and ventilator. The zero-flow points of the flow tracing partition the ventilatory cycle into its inspiratory and expiratory phases. The airway pressure tracing complements the flow tracing, helping to detect and quantify the work of breathing.
7 As an index of mean lung and chest wall volumes, mean airway pressure recorded under passive conditions is an important determinant of arterial oxygenation, the back pressure to venous return, and the tendency for gas leakage after barotrauma. Mean airway pressure alone has limited value during active breathing and seriously underestimates mean alveolar pressure when expiratory pressure losses exceed inspiratory pressure losses.
8 The mechanical work of breathing is not synonymous with breathing effort. The pressure time index better indicates total ventilatory stress, correlating inversely with pump reserve.
9 Respiratory muscle dyssynchrony, elevations in the P0.1, and an excessive frequency to tidal volume ratio are helpful indicators of respiratory muscle overload and incipient muscle fatigue.
10 Breathing pattern variability, the CO2 challenged P0.1, the ratio between spontaneous tidal volume and vital capacity, the frequency to tidal volume ratio, and the ratio between minute ventilation and maximum voluntary ventilation are helpful indicators of ventilatory reserve.
Data relevant to the output, efficiency, capacity, and reserve of the respiratory system guide appropriate management during cardiorespiratory failure. Monitoring techniques can be classified conveniently into those that characterize pulmonary and systemic exchange of respiratory gases, ventilatory capability, and respiratory mechanics (flow, pressures, and breathing workload).
▪ MONITORING GAS EXCHANGE
Arterial Blood Gas Analysis
Analysis of arterial blood gases (ABG) provides data that are fundamental to the diagnosis of respiratory and metabolic disturbances and to assessing the effect of therapeutic interventions. Although certain inferences can be made from the blood gas data alone, full interpretation and appreciation of their implications for decision making require knowledge of the clinical context, serum electrolyte concentrations, and in certain settings, the serum albumin and lactate concentrations as well.
Arterial O2 Tension and Saturation
The physiologic significance of hypoxemia depends on chronicity, compensatory mechanisms, hypoxic ventilatory response, and tolerance of vital organs most at risk—chiefly, the heart and brain. Clearly, a patient with critical coronary stenosis, acute cor pulmonale, or symptomatic cerebrovascular compromise should be kept fully saturated, as should patients with ongoing dyspnea, symptomatic circulatory inadequacy, or severe anemia. Conversely, maintaining less than full saturation may be appropriate for patients who depend chronically on moderate hypoxemia to allow CO2 retention, for those with intact compensatory mechanisms, and for patients in whom full O2 saturation can be achieved only at the expense of high fractions of inspired oxygen or ventilating pressure. Quite recently, devices intended to monitor tissue oxygenation and perfusion adequacy have been released for clinical use. Near infrared spectrophotometry and sub-lingual PCO2 monitoring, for example, show considerable promise. Although theoretically appealing, the value of these instruments has yet to be determined.
In the absence of carbon monoxide, methemoglobin, or abnormal hemoglobin, arterial O2 saturation can be estimated with acceptable accuracy from the PaO2 and pH alone—at least near the upper plateau of the oxyhemoglobin relationship. If the arterial O2 content is required, or if carboxyhemoglobin or methemoglobin concentrations are high, direct analysis by co-oximetry must be requested. (This is particularly important when analyzing mixed-venous O2 saturations.) Whether to “temperature correct” the analyzed specimen is debatable, depending somewhat on the purpose to which such information is put. For example, temperature correction would seem appropriate if the oxygen-exchanging efficiency of the lung were the primary question, whereas the need to correct SaO2 for temperature is more debatable when tissue O2 adequacy is the concern. Individual hospital laboratories have different practices and reporting policies with regard to these issues.
Acid-Base Status, pH, and PaCO2
Hydrogen ion concentration must be regulated carefully to preserve enzyme function. Normally, acids are generated by the hydration of CO2 (“respiratory” acid) and by other processes of metabolism (“metabolic acids”—primarily phosphate, sulfate, and lactate). In disease states, hydrogen ion concentration can rise secondary to the production of excess lactate (ischemia, hypoxemia), generation of ketoacids (diabetes, starvation), ingestion of certain alcohols or drugs (e.g., metformin), or failure of the body to excrete or metabolize the generated load of hydrogen ion (ventilatory failure, kidney dysfunction, or liver disease). Occasionally, sufficient hydrogen or bicarbonate ion is lost in the urine or stool or is aspirated from the gastrointestinal tract to affect acid-base balance. To address such diszusts, the clinician must understand the primary determinants of acid-base homeostasis and deftly interpret the pH, PaCO2, and HCO components of the blood gas report alongside the electrolyte profile (to calculate anion gap).
components of the blood gas report alongside the electrolyte profile (to calculate anion gap).The body defends against radical changes in pH primarily by regulating its two pathways for eliminating acid: respiratory and renal. (A full discussion of acid-base principles is provided in Chapter 12.) The Henderson-Hasselbach equation for the bicarbonate buffer system relates pH to the concentrations of bicarbonate and PaCO2:
pH = 6.1 + log HCO /(0.03 PaCO2)
/(0.03 PaCO2)In this expression, knowledge of any two variables enables calculation of the third. In practice, PaCO2
(lung excreted) and pH are measured, and HCO (kidney excreted) is estimated. Once formed, hydrogen ions are neutralized partially by combining with bicarbonate ion (producing CO2) and by reversible oxidation of protein. The bicarbonate buffer system:
(lung excreted) and pH are measured, and HCO
(kidney excreted) is estimated. Once formed, hydrogen ions are neutralized partially by combining with bicarbonate ion (producing CO2) and by reversible oxidation of protein. The bicarbonate buffer system:generates CO2 when H+ is added to the extracellular fluid. The rising CO2 and H+ concentrations stimulate the respiratory center in an attempt to limit hypercapnia, effectively eliminating H+ by driving the preceding equation leftward. Over time (generally several days are required), the healthy kidney will adapt to hypercapnia or hypocapnia by adjusting the bicarbonate level to help restore the Henderson-Hasselbach-defined 20:1 normal ratio between bicarbonate concentration and the product of PaCO2 and its solubility coefficient (0.03). Respiratory compensation for metabolic disturbances is generally incomplete and occurs more reliably and vigorously in response to metabolic acidosis than to metabolic alkalosis.
Despite its functional importance, this bicarbonate buffer system is not the only one available— skeletal calcium and certain proteins, chiefly hemoglobin, also play a significant role. Thus, a rising [H+] is partially buffered by hemoglobin, as well as by HCO , giving rise to a generally small discrepancy between the difference in HCO
 relative to normal (24 mEq/dL) and the calculated base excess or deficit, which quantifies the magnitude of the metabolic disturbance or compensation. An acutely rising PaCO2 tends to generate bicarbonate as a portion of the H+ formed in the hydration of CO2 that is buffered by hemoglobin; the opposite occurs during hyperventilation. Thus, even in the absence of renal activity, the acutely rising PaCO2 of pure hypoventilation is accompanied by a gently rising [HCO
 ]; an acutely falling PaCO2 by a gently falling [HCO
 ].
].
, giving rise to a generally small discrepancy between the difference in HCO relative to normal (24 mEq/dL) and the calculated base excess or deficit, which quantifies the magnitude of the metabolic disturbance or compensation. An acutely rising PaCO2 tends to generate bicarbonate as a portion of the H+ formed in the hydration of CO2 that is buffered by hemoglobin; the opposite occurs during hyperventilation. Thus, even in the absence of renal activity, the acutely rising PaCO2 of pure hypoventilation is accompanied by a gently rising [HCO]; an acutely falling PaCO2 by a gently falling [HCO].Definitions
Acidosis and alkalosis—the underlying processes that contribute to the pH status—may be pathogenic or compensatory. The normal ranges for arterial pH and PaCO2 are 7.38 to 7.44 and 35 to 45 mm Hg, respectively. A pH that exceeds 7.45 indicates alkalemia, generated by bicarbonate retention, hyperventilation relative to metabolic need, or both. A pH > 7.35 indicates acidemia, caused by metabolic or renal depletion of bicarbonate, hypoventilation relative to metabolic need, or both. Venous blood varies in composition depending on the delivery/consumption characteristics of the sampled tissue bed. Mixed-venous gases, representing admixture from tissues throughout the body, generally have a PCO2 that is 4 to 8 mm Hg higher and a pH that is 0.05 to 0.10 units lower than arterial gases. Occasionally, these arteriovenous discrepancies can be much wider, and in such cases, the venous value may more accurately reflect the acid-base status of vital tissue beds.
Interpretation
The ABG Provides the pH and allows the clinician to determine the relative contributions. Because compensation is never complete, the dominant underlying mechanism—acidosis or alkalosis—is suggested by the pH. Does a blood gas demonstrating a PaCO2 of 32 mm Hg and an HCO of 16 mEq/L indicate respiratory alkalosis with renal compensation, or metabolic acidosis with respiratory compensation? A major clue is provided by the pH—acidemia would suggest that the fundamental problem is metabolic. Failure of the PaCO2 to fall to the expected level would suggest a superimposed problem with ventilatory drive or ventilatory pump. Classically, “Winters’ Formula” (following) predicts the respiratory compensation for an uncomplicated metabolic acidosis. Intensive care unit (ICU) clinicians must be alert for “triple” acid-base disorders in which two metabolic derangements with opposing influences on pH are in play. The anion gap calculation usually provides the key to appropriate interpretation.
of 16 mEq/L indicate respiratory alkalosis with renal compensation, or metabolic acidosis with respiratory compensation? A major clue is provided by the pH—acidemia would suggest that the fundamental problem is metabolic. Failure of the PaCO2 to fall to the expected level would suggest a superimposed problem with ventilatory drive or ventilatory pump. Classically, “Winters’ Formula” (following) predicts the respiratory compensation for an uncomplicated metabolic acidosis. Intensive care unit (ICU) clinicians must be alert for “triple” acid-base disorders in which two metabolic derangements with opposing influences on pH are in play. The anion gap calculation usually provides the key to appropriate interpretation.Chronicity of the process can be judged by comparing the observed values of pH, bicarbonate, and base excess with those expected for acute hypercapnia or hypocapnia (see following). To place such information into proper perspective for diagnosis and management decisions, the clinician must take account of the clinical backdrop and examine the serum electrolytes and albumin for evidence of renal insufficiency, renal tubular dysfunction, and an anion gap that indicates the presence of such noncarbonic (metabolic) acids as lactate, ketoacids, and salicylate.
The Anion Gap
The anion gap is the difference between the serum sodium concentration and the sum of chloride and bicarbonate ions. Normally, the gap is 13 mEq or less—a reflection of the sulfates, phosphates,
and other unmeasured negatively charged ions that correspond to kidney-excreted “mineral” acids. Because of the anionic nature of serum proteins, the calculated gap should be increased approximately by 2 to 2.5 mEq/L for each g/dL of hypoalbuminemia. Another useful bedside computation is the “Δ/Δ,” the ratio of the anion gap to the bicarbonate gap. As lactic acidosis develops, the anion gap increases relatively more than the HCO falls because HCO
 has a wider volume of distribution. The ratio varies but averages approximately 1.5 in moderate lactic acidosis—less if the acuity is extreme and more as the severity worsens. Values less than 1 should prompt consideration of another source of H+ excess, whereas a value greater than 2 suggests a concurrent metabolic alkalosis.
and other unmeasured negatively charged ions that correspond to kidney-excreted “mineral” acids. Because of the anionic nature of serum proteins, the calculated gap should be increased approximately by 2 to 2.5 mEq/L for each g/dL of hypoalbuminemia. Another useful bedside computation is the “Δ/Δ,” the ratio of the anion gap to the bicarbonate gap. As lactic acidosis develops, the anion gap increases relatively more than the HCO
falls because HCO has a wider volume of distribution. The ratio varies but averages approximately 1.5 in moderate lactic acidosis—less if the acuity is extreme and more as the severity worsens. Values less than 1 should prompt consideration of another source of H+ excess, whereas a value greater than 2 suggests a concurrent metabolic alkalosis.Rules for Compensation
As already noted, primary metabolic disturbances are incompletely compensated by changes in ventilation, and primary respiratory disturbances are partially offset by renal excretion or retention of bicarbonate. Knowledge of these expected compensations allows a judgment to be made regarding the nature and chronicity of the underlying processes.
Respiratory Compensation for Metabolic Disturbances
A useful equation for predicting the PaCO2 during a primary metabolic disturbance is as follows:
Metabolic Acidosis: (Winters’ Formula)
Metabolic Alkalosis:
For example, if a measured HCO3 were 16, the expected compensation would be PaCO2 = 1.5 × [HCO ]+ 8 = 24+ 8 = 32 mm Hg. Note that the pH would be less than 7.40, however, because the HCO
 to (0.03 × PaCO2) ratio is 16/(0.03 × 32) = 16/0.96 = 16.7 < 20. If measured HCO
 were 36 mEq/L, the expected compensation would be PaCO2 = 0.7 × [HCO
 ]+ 20 mm Hg = 0.7 × (36)+ 20 = 25.2+ 20 = 45 mm Hg.
]+ 8 = 24+ 8 = 32 mm Hg. Note that the pH would be less than 7.40, however, because the HCO to (0.03 × PaCO2) ratio is 16/(0.03 × 32) = 16/0.96 = 16.7 < 20. If measured HCO were 36 mEq/L, the expected compensation would be PaCO2 = 0.7 × [HCO]+ 20 mm Hg = 0.7 × (36)+ 20 = 25.2+ 20 = 45 mm Hg.Metabolic Adjustments for Primary Respiratory Disturbances
The kidney requires time to compensate for a sustained respiratory disturbance and adjusts more successfully to respiratory alkalosis than to respiratory acidosis. The following are simple rules for the HCO expected in the acute and chronic settings.
expected in the acute and chronic settings.Acute Rule:
[HCO ] rises 1 mEq/L for each 10 mm Hg rise in PaCO2 above 40 mm Hg and falls 2 mEq/L for each 10 mm Hg fall in PaCO2 below 40 mm Hg.
] rises 1 mEq/L for each 10 mm Hg rise in PaCO2 above 40 mm Hg and falls 2 mEq/L for each 10 mm Hg fall in PaCO2 below 40 mm Hg.Chronic Rule:
[HCO ] rises 4 mEq/L for each 10 mm Hg rise in PaCO2 above 40 mm Hg and falls 3 mEq/L for each 10 mm Hg fall in PaCO2 below 40 mm Hg.
] rises 4 mEq/L for each 10 mm Hg rise in PaCO2 above 40 mm Hg and falls 3 mEq/L for each 10 mm Hg fall in PaCO2 below 40 mm Hg.Algorithm for Evaluating Blood Gas Data
A systematic approach to blood gas evaluation incorporates the elements of the foregoing discussion. The first priority is to verify the technical validity of the sample—errors in sampling, sample processing, analysis, and transcription occur commonly. (Is the sample characteristic of a venous rather than the intended arterial specimen? Are the pH, PaCO2, and [HCO ] internally consistent? Does the [HCO
 ] correlate with the [HCO
 ] directly analyzed from venous blood? Is the PaO2 reported physically possible given the FiO2 administered?)
] internally consistent? Does the [HCO] correlate with the [HCO] directly analyzed from venous blood? Is the PaO2 reported physically possible given the FiO2 administered?)Although there is no best method for interpreting a technically valid report, one logical approach has the following steps:
Look at the arterial pH: A pH outside the normal range defines acidemia (<7.35) or alkalemia (>7.45).
Look at the PaCO2: If PaCO2 is less than 35 mm Hg, the patient has primary or compensatory respiratory alkalosis. If PaCO2 is more than 45 mm Hg, the patient has primary or compensatory respiratory acidosis.
Look at the [HCO ] and compute the base excess, knowing that each 10 mm Hg rise in PaCO2 generates 1 mEq/L of bicarbonate via protein buffers and each fall of 10 mm Hg depletes [HCO
 ] by a similar amount. Compute the difference between the adjusted [HCO
 ] and 24 as the base excess or deficit. If the base excess exceeds 2, the patient has a metabolic alkalotic disturbance—primary or secondary. A deficit exceeding 2 indicates a primary or compensatory metabolic acidosis.
Look at the serum electrolyte and albumin concentrations. Calculate the albumin-adjusted anion gap and the “Δ/Δ” for clues to the nature of metabolic derangements (see Chapter 12). A metabolic acidosis unaccompanied by an anion gap usually means renal tubular dysfunction, excessive administration of chloride in the form of “normal” saline, or gastrointestinal loss of bicarbonate.
Consider the clinical setting and make a judgment regarding the nature of the primary acid-base disturbance. As a general but not infallible rule, pH will be driven in the direction dictated by the primary variable—an alkalemia in conjunction with a low PaCO2 is at least partially driven by a respiratory mechanism; acidemia in conjunction with a low PaCO2 suggests that the respiratory alkalosis is compensatory.
Look for evidence of a mixed disorder (as opposed to a simple but compensated disturbance) by calculating the expected value of the variable not involved in the primary disturbance, using the rules given earlier. Acid-base disorders can be single (e.g., respiratory acidosis, with or without compensation), double (e.g., respiratory acidosis, metabolic alkalosis), or even triple (e.g., respiratory acidosis, metabolic alkalosis, and metabolic acidosis)—as indicated by an anion gap together with CO2 retention and a disproportionately elevated HCO . Review the clinical data and electrolytes for clues to the clinical significance of the acid-base data.
Monitoring Oxygenation
The human eye is not adept at detecting or quantifying arterial hypoxemia. Although intimately linked, O2 saturation and tension (partial pressure) provide complementary clinical data. PaO2 reflects the maximal tension driving O2 to the tissues, whereas saturation reflects O2 content per gram of hemoglobin. Reflectance oximetry is used when a fiberoptic catheter continuously tracks oxygen saturation in the central venous, pulmonary arterial, or systemic arterial bloodstreams. Multichannel fiberoptic chemiluminescent catheter systems for continuously monitoring PaO2, PaCO2, and arterial pH have been introduced into the clinical practice several times over the past two decades, but durability has been a problem and the adoption rate has been slow. These can be quite useful, however, for tracking either rapidly changing clinical events or progress after a clinical intervention (e.g., ventilator adjustment).
Sensors of Muscle Oxygen Utilization
Arterial Pulse Oximetry
Transcutaneous photometric oximetry is useful for monitoring patients with marginal or fluctuating oxygen exchange. For patients supported by mechanical ventilation, transcutaneous oximetry continuously measures SaO2, enabling rapid adjustment of FiO2, mean airway pressure, and positive end-expiratory pressure (PEEP) and warning of arterial desaturation during weaning, sleeping, or changes of body position. As a general rule, trends in oximetry values are of greater significance than the absolute value of saturation, at least over the clinical saturation range usually encountered.
Technical Issues
Lightweight probes direct filtered light of several specific wavelengths onto the surface of the digit, nasal bridge, or earlobe. The relative absorption of these spectrophotometric beams as they pass through the tissue (which differs for O2 saturated and desaturated blood) is converted into the appropriate saturation value by computer-stored algorithms. Phasic variations separate the incoming arterial component from venous and background absorption. Pulse oximetry probes do not require tissue heating because phasic changes in blood volume and optical density cue the instrument to the arterial component of the blood contained in the vascular bed. Most units also display pulse rate, and many display a simulated arterial waveform or some other visual indicator of pulse intensity. A tracing whose waveform baseline varies dramatically with ventilation strongly suggests variation of stroke output synchronous with the respiratory cycle—a condition typical for gas trapping and auto-PEEP (AP).
Oxygen saturation is not the only useful parameter that can be estimated noninvasively by spectrophotometry. Quite recently, widening of the optical wavelength spectrum and advanced signal processing algorithms have been developed to enable noninvasive monitoring of hemoglobin, carboxyhemoglobin, and methemoglobin concentrations. As the reliability of these measures is improved and validated for use in critical care, such technology promises to add considerably to early event detection.
The pulse rate should be “correlated” to the electrocardiogram (ECG) measured rate to assess signal quality. Good correlation does not ensure accuracy, but poor correlation of the heart rate displayed on the ECG and pulse oximeter calls the reported saturation value into question. With a good pulse signal, currently available instruments are quite accurate in their upper range (i.e., saturations > 80%) but become less reliable as the patient desaturates or perfusion deteriorates. Even when accurate, pulse oximetry presents a signal-averaged, and therefore delayed, report. Poor perfusion and/or
probe contact are the primary causes of an erroneous signal, and placement on a different digit, nose bridge, or earlobe may improve reliability.
probe contact are the primary causes of an erroneous signal, and placement on a different digit, nose bridge, or earlobe may improve reliability.
Potential Artifacts
Routine ABG reports of saturation are calculated from the measured PaO2 and pH. A direct determination of arterial blood saturation (preferably by co-oximetry) is the most definitive check. Motion artifact often is an important problem for patients who are not immobilized. Because detection of the “arterial” segment of the cycle depends on small phasic changes in the tissue volume, large-amplitude vibrations of other kinds that are unassociated with arterial pulsation can confuse the sampling algorithm —especially when the frequencies of the rhythmic vibration approximate the patient’s own heart rate. When a patient has a rhythmic tremor (Parkinson disease, anxiety, agitation, seizures, essential tremor, shivering, etc.), tissue volumes can vary phasically in such a way as to invalidate the oximeter’s output, which trends toward the default value. In the absence of any detected discrimination between the “baseline” and “arterial” absorption differences, many devices default to a recorded display of 85% to 88%. Rarely, when arterial perfusion is poor and venous pulsations are vigorous, the recorded value may be erroneously depressed.
Anemia and jaundice do not routinely affect the accuracy of pulse oximetry. Pulse oximetry values tend to be misleadingly high in some black patients, but by no means in all. (The existing literature conflicts on this point.) Carboxyhemoglobin and methemoglobin can produce falsely high saturation values, and specific nail polishes (particularly blue, green, or black) interfere with light transmission and absorbance, as do certain blood-borne dyes, such as indocyanine green and methylene blue. These tend to artifactually reduce the O2 saturation reported.
Interpretation
Many practitioners do not fully understand the oxyhemoglobin dissociation relationship (Fig. 5-1) or the value and limitations of transmission oximetry. Over the clinically relevant range, the oxyhemoglobin dissociation curve is highly nonlinear, so a drop of a few percentage points in SaO2 over the 95% to 100% interval reflects a much larger change in PaO2 than does a similar decrement over the 80% to 85% interval. Pulse oximeters record the relative absorption of light by oxyhemoglobin and deoxyhemoglobin. Therefore, for a fixed value of viable hemoglobin, the saturation parallels its relative O2 content, but a high saturation guarantees neither its total O2 content nor the adequacy of tissue O2 delivery. For example, a patient may have a “full” SaO2 after inhaling a high concentration of carbon monoxide, and yet directly measuring arterial oxygen content per deciliter of blood (by co-oximetry) may demonstrate profound arterial O2 depletion. Moreover, a patient in circulatory shock may maintain a perfectly normal SaO2 despite serious O2 privation. Cyanide blocks the uptake of oxygen by the tissues, so O2 consumption is low even as arterial and mixed-venous saturations are normal or increased. Arterial oxygen saturation also bears no direct relationship to the adequacy of ventilation; a patient breathing a high-inspired concentration of oxygen will maintain a nearly normal SaO2 for extended periods in the face of a full respiratory arrest.
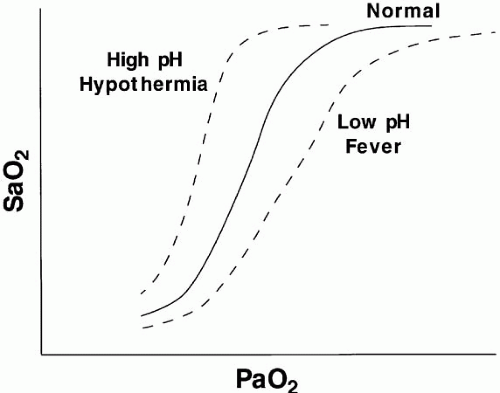 ▪ FIGURE 5-1 Relationship of blood oxygen saturation (SaO2) to blood oxygen tension (PaO2). A normal curve has a sigmoidal shape, with the upper plateau of the relationship (90% saturation) reached at a PaO2 of approximately 55 to 60 mm Hg. Alkalemia and hypothermia shift the curve up and to the left; acidemia and fever shift it down and to the right. |
Other gas-measuring techniques (e.g., transcutaneous and transconjunctival measurements of O2 and CO2) have been used widely in neonatology to monitor tissue gas tensions, but traditional monitors have been generally less helpful for adults. These transcutaneous techniques require frequent calibration, excellent skin and electrode preparation to ensure gas transfer to the skin surface, and regular site changes to avoid burning the warmed patch of skin they monitor. More importantly, they are profoundly affected by inadequacy of perfusion
and therefore track arterial gas tensions unreliably during many critical illnesses. Alert patients tolerate conjunctival probes poorly. Newer tissue oxygen sensors appear to hold considerably more promise.
and therefore track arterial gas tensions unreliably during many critical illnesses. Alert patients tolerate conjunctival probes poorly. Newer tissue oxygen sensors appear to hold considerably more promise.
Several methods now in active development have been used largely in a research setting but show considerable promise for clinical monitoring of microcirculatory function during circulatory failure. These include CO2 measurements for sublingual, buccal, and subcutaneous microcirculatory CO2 levels, as well as absorbance, reflectance, and near infrared spectroscopy (NIRS) for measuring microcirculatory hemoglobin saturation. NIRS can probe to considerable depth and has already found clinical application in the assessment of cerebrocortical viability. Orthogonal polarization spectral (OPS) imaging and sidestream dark field technology allow microscopic visualization of the deeper lying microcirculation and the flow of red blood cells in the microcirculation. Sublingual capnography combined with OPS imaging has been used to investigate the relationship between the microcirculation and metabolic status during resuscitation. Combinations of these technologies, which look at different functional compartments of regional microcirculations, can integratively probe the distributive alterations of oxygen transport during sepsis, septic shock, and therapy that are not provided by conventional monitoring of systemic hemodynamic and oxygen-derived variables.
O2 Consumption
Although theoretically valuable for assessing nutritional requirements, adequacy of oxygen delivery, or response to hemodynamic interventions, total body oxygen consumption ([V with dot above]O2) is often difficult to measure accurately at the bedside —even in those receiving mechanical ventilation. Two primary methods are in general use: direct analysis of inspired and expired gases and the Fick method (computation of [V with dot above]O2 from the product of cardiac output [CO] and the difference in O2 content between samples of arterial and mixed-venous blood). Neither method reflects average oxygen consumption when the patient’s metabolic rate fluctuates during data collection. For some purposes, an estimate of CO2 production —which is considerably more convenient to obtain—may serve to answer the question of interest (see following).
Delivery Dependence of [V with dot above]O2
Controversy has surrounded the concept of supply dependency of O2 consumption for patients having sustained trauma, massive surgery, or sepsis. Failure to provide sufficient O2 delivery may result in anaerobiosis, multisystem organ failure, and an adverse or fatal outcome. Moreover, it generally is agreed that prognosis in these conditions is somewhat better for critically ill patients in whom higher O2 delivery is manifest. By inference, it has been suggested that in these settings, supranormal O2 delivery is needed to satisfy the O2 demands of certain vital organs. Prompt and vigorous resuscitation must be carried out, as patients who do not spontaneously generate sufficient O2 delivery or who cannot extract O2 effectively have a worse prognosis than other patients undergoing the same stress who do. Yet, it is highly questionable whether attempts to sustain O2 delivery at supranormal values are well advised. Some data even suggest potential harm. Specific subgroups of surgical patients could, in fact, benefit; there are no tightly controlled data available to settle this question in either direction. Patients having sustained massive trauma or extensive surgery may represent a fundamentally different physiologic problem and respond more favorably than patients with medical crises such as sepsis. It now seems clear that targeting supranormal values for oxygen delivery confers no routine benefit for patients in the latter category. Without better evidence, therefore, maximizing [V with dot above]O2 cannot be accepted as the primary target variable for circulatory support.
Efficiency of Oxygen Exchange
Computing Alveolar Oxygen Tension
To judge the efficiency of pulmonary gas exchange, mean alveolar oxygen tension (PAO2) must first be computed. The ideal PAO2 is obtained from the modified alveolar gas equation:
PAO2 = PIO2 − (PaCO2/R) + [(PaCO2 × FiO2 × (1 − R)/R)]
Here R is the respiratory exchange ratio and PIO2 is the inspired oxygen tension adjusted for FiO2 and water vapor pressure at body temperature (47 mm Hg at 37°C).
PIO2 = (barometric pressure − 47) × FiO2
Under steady-state conditions, R normally varies from approximately 0.7 to 1.0, depending on the mix of metabolic fuels. When the same patient is
monitored over time, R generally is assumed to be 0.8 or neglected entirely. Under most clinical conditions, the alveolar gas equation can be simplified to:
monitored over time, R generally is assumed to be 0.8 or neglected entirely. Under most clinical conditions, the alveolar gas equation can be simplified to:
PAO2 = PIO2 − (1.25 × PaCO2)
For example, at sea level with a normally ventilated patient breathing room air:
PAO2 = 0.21 × (760 − 47) − 1.25 × (PaCO2) = 150 − (1.25 × 40) [all equal to] 100 mm Hg
Alveolar-Arterial Oxygen Tension Difference P(A-a)O2
The difference between alveolar and arterial oxygen tensions, P(A-a)O2, takes account of alveolar CO2 tension and therefore eliminates hypercapnia from consideration as the sole cause of hypoxemia. However, although useful, a single value of P(A-a)O2 does not characterize the efficiency of gas exchange across all FiO2s—even in normal subjects. The P(A-a)O2 in a young normal subject ranges from approximately 10 mm Hg (on room air) to approximately 100 mm Hg (on an FiO2 of 1.0). (Breathing room air, the upper limit of normal approximates age/4+ 4 mm Hg.) Moreover, PAO2 changes nonlinearly with respect to FiO2 as the extent of [V with dot above]/ mismatch increases. When the [V with dot above]/
 abnormality is severe and abnormally distributed among gas exchanging units, the PAO2 may vary little with FiO2 until high fractions of inspired oxygen are given (Fig. 5-2). Finally, the P(A-a)O2 may be influenced by the fluctuations in venous oxygen content.
mismatch increases. When the [V with dot above]/ abnormality is severe and abnormally distributed among gas exchanging units, the PAO2 may vary little with FiO2 until high fractions of inspired oxygen are given (Fig. 5-2). Finally, the P(A-a)O2 may be influenced by the fluctuations in venous oxygen content.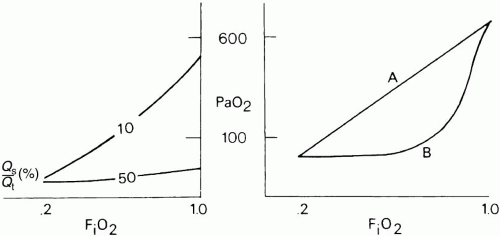 ▪ FIGURE 5-2 Effect of true shunt (Qs /Qt ; left) and ventilation/perfusion mismatching (right) on the relationship between arterial oxygen tension (PaO2) and inspired oxygen fraction (FiO2). Hypoxemia caused by true shunt is refractory to supplementary oxygen once the shunt fraction exceeds 30%. Similar reductions in PaO2 caused by ventilation/perfusion mismatching respond to oxygen; however, the FiO2 required to boost PaO2 into an acceptable range depends on whether hypoxemia is caused by an extensive number of units with mildly abnormal ventilation/perfusion mismatching (line A) or by a smaller number of units with very low ventilation to perfusion ratios (line B). |
Venous Admixture and Shunt
Under normal circumstances, fluctuations in mixedvenous O2 saturation (SvO2) do not contribute significantly to hypoxemia. However, as ventilation/perfusion inequality or shunting develops, the O2 content of mixed-venous blood (CvO2) exerts an increasingly important effect on SaO2. Measuring SvO2 with a fiberoptic Swan-Ganz catheter enable venous admixture ( ) to be computed with relative ease. In the steady state:
) to be computed with relative ease. In the steady state: = (CAO2 − CaO2)/(CAO2 − C[V with bar above]O2)
where the oxygen content of alveolar capillary blood (CAO2), arterial blood (CaO2), or mixedvenous blood (C[V with bar above]O2), expressed in mL of O2 per 100 mL of blood, equal the sum:
[0.003 × PO2] + [0.0138 × (SO2 ×Hgb)]
(In the latter equation, PO2 [mm Hg] and SO2 [%] refer to the oxygen tension and saturation of blood at the respective sites. Hemoglobin [Hgb] is expressed in gm/dL.) Like P(A-a)O2,  is also influenced by variations in [V with dot above]/
 mismatching and by fluctuations in SvO2 and FiO2. If
  is abnormally high but all alveoli are patent, calculated admixture will diminish toward the normal physiologic value (approx. 5%) as FiO2 increases. Conversely, if the
  abnormality results from blood bypassing the patent alveoli through intrapulmonary communications or through an intracardiac defect, there will be no change in
  as FiO2 increases (“true” shunt).
is also influenced by variations in [V with dot above]/ mismatching and by fluctuations in SvO2 and FiO2. If is abnormally high but all alveoli are patent, calculated admixture will diminish toward the normal physiologic value (approx. 5%) as FiO2 increases. Conversely, if the abnormality results from blood bypassing the patent alveoli through intrapulmonary communications or through an intracardiac defect, there will be no change in as FiO2 increases (“true” shunt).Simplified Measures of Oxygen Exchange
Several pragmatic approaches have been taken to simplify bedside assessment of O2 exchange efficiency. The first is to quantitate P(A-a)O2 during the administration of pure O2. After a suitable wash-in time (5 to 15 min, depending on the severity of the disease), pure shunt accounts for the entire P(A-a)O2. Furthermore, if hemoglobin is fully saturated with O2, dividing the P(A-a)O2 by 20 approximates the shunt percentage (at FiO2 = 1.0). As pure O2 replaces alveolar nitrogen, some patent but poorly ventilated units may collapse— the process of “absorption atelectasis.” Moreover, because shunt percentage is affected by changes in CO and mixed-venous O2 saturation, these simplified measures may give a misleading impression of changes within the lung itself. Whatever its shortcomings, determining the shunt fraction is worthwhile because it alerts the clinician to consider nonparenchymal causes of hypoxemia (e.g., arteriovenous malformation, intracardiac right-to-left shunting). Furthermore, because PaO2 shows little response to variations in FiO2 at true shunt fractions greater than 25%, the clinician may be encouraged to reduce toxic and marginally effective concentrations of oxygen.
The PaO2/FiO2 (or “P/F”) ratio is a convenient and widely used bedside index of oxygen exchange that attempts to adjust for fluctuating FiO2. Although simple to calculate, this ratio is affected by changes in SvO2 and does not remain equally sensitive across the entire range of FiO2—especially when shunt is the major cause for admixture. Another easily calculated index of oxygen exchange properties, the PaO2/PAO2 (or “a/A”) ratio, offers similar advantages and disadvantages as FiO2 is varied. Like the P/F ratio, it is a useful bedside index that does not require blood sampling from the central circulation but loses reliability in proportion to the degree of shunting. Furthermore, in common with all measures that calculate an “ideal” PAO2, even the a/A ratio can be misleading when fluctuations occur in the primary determinants of SvO2 (hemoglobin and the balance between oxygen consumption and delivery).
None of the indices discussed thus far account for changes in the functional status of the lung that result from alterations in PEEP, AP, or other techniques for adjusting average lung volume (e.g., inverse ratio ventilation, lateral positioning, or prone positioning). If the objective is to categorize the severity of disease or to track the true O2 exchanging status of the lung in the face of such interventions, the P/F ratio falls short. The oxygenation index, PaO2/(FiO2 × mean PAW), that takes the effects of PEEP and inspiratory time fraction into account has gained widespread popularity in neonatal and pediatric practice but has yet to catch hold in adult critical care. Although preferable, this index, too, is imperfect; mean airway pressure and FiO2 bear complex and alinear relationships to PaO2 when considered across their entire ranges.
Monitoring Carbon Dioxide and Ventilation
Kinetics and Estimates of Carbon Dioxide Production
Body stores of carbon dioxide are far greater than those for oxygen. When breathing room air, only approximately 1.5 L of O2 is stored (much of it in the lungs) and some of this stored O2 remains unavailable for release until life-threatening hypoxemia is underway. Although breathing pure O2 can fill the alveolar compartment with an additional 2 to 3 L of oxygen (a safety factor during apnea or asphyxia), these O2 reserves are still much less than the approximately 120 L of CO2 normally stored in body tissues. Because of limited oxygen reserves, PaO2 and tissue PO2 change rapidly during apnea, at a rate that is highly dependent on FiO2.
CO2 stores are held in several forms (dissolved, bound to protein, fixed as bicarbonate, etc.) and distributed in compartments that differ in their volumetric capacity and ability to exchange C2 rapidly with the blood. Well-perfused organs constitute a small reservoir for CO2 capable of quick turnover, skeletal muscle is a larger compartment with sluggish exchange, and bone and fat are highcapacity chambers with very slow filling and release. Practically, the existence of large CO2 reservoirs with different capacities and time constants of filling and emptying means that equilibration to a new steady-state PaCO2 after a step change in ventilation (assuming a constant rate of CO2 production, [V with dot above]CO2) takes longer than generally appreciated— especially for step reductions in alveolar ventilation (Fig. 5-3). With such a large capacity and only a modest rate of metabolic CO2 production, the CO2 reservoir fills rather slowly, so PaCO2 rises only 6 to 9 mm Hg during the first minute of apnea and 3 to 6 mm Hg each minute thereafter. Depletion of this reservoir can occur at a faster rate.
Measurement of CO2 excretion is valuable for metabolic assessment, computations of dead space ventilation, and evaluation of hyperpnea. Estimates
of CO2 production are representative when the sample is collected carefully in the steady state over adequate time. The rate of CO2 elimination is a product of minute ventilation ([V with dot above]E) and the expired fraction of CO2 in the expelled gas. If gas collection is timed accurately and the sample is adequately mixed and analyzed, an accurate value for excreted CO2 can be obtained. However, whether this value faithfully represents metabolic CO2 production depends on the stability of the patient during the period of gas collection—not only with regard to [V with dot above]O2 but also in terms of acid-base fluctuations, perfusion constancy, and ventilation status with respect to metabolic needs. During acute hyperventilation or rapidly developing metabolic acidosis, for example, the rate of CO2 excretion overestimates the metabolic rate until surplus body stores of CO2 are washed out or bicarbonate stores reach equilibrium. The opposite obtains during abrupt hypoventilation or transient reduction in CO.
of CO2 production are representative when the sample is collected carefully in the steady state over adequate time. The rate of CO2 elimination is a product of minute ventilation ([V with dot above]E) and the expired fraction of CO2 in the expelled gas. If gas collection is timed accurately and the sample is adequately mixed and analyzed, an accurate value for excreted CO2 can be obtained. However, whether this value faithfully represents metabolic CO2 production depends on the stability of the patient during the period of gas collection—not only with regard to [V with dot above]O2 but also in terms of acid-base fluctuations, perfusion constancy, and ventilation status with respect to metabolic needs. During acute hyperventilation or rapidly developing metabolic acidosis, for example, the rate of CO2 excretion overestimates the metabolic rate until surplus body stores of CO2 are washed out or bicarbonate stores reach equilibrium. The opposite obtains during abrupt hypoventilation or transient reduction in CO.
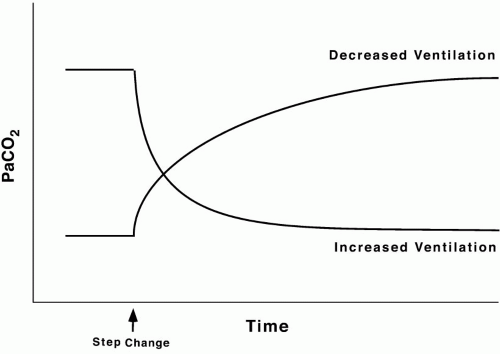 ▪ FIGURE 5-3 Effect of step changes in ventilation on PaCO2. After an abrupt change in ventilation, PaCO2 either climbs (step decrease in ventilation) or descends (step increase in ventilation) toward a new plateau. Equilibration is reached more slowly after a step decrease in ventilation because the large storage reservoir for CO2 can be filled only at the rate of CO2 production. Elimination of CO2 can occur more rapidly. |
Efficiency of CO2 Exchange
The volume of CO2 produced by the body tissues varies with metabolic rate (fever, pain, agitation, sepsis, etc.). In the mechanically ventilated patient, many vagaries of CO2 flux can be eliminated by controlling ventilation and quieting muscle activity with deep sedation with or without paralysis. PaCO2 must be interpreted in conjunction with the [V with dot above]E. For example, the gas exchanging ability of the lung may be unimpaired even though PaCO2 rises when reduced alveolar ventilation is the result of diminished respiratory drive or marked neuromuscular weakness. As already noted, alveolar and arterial CO2 concentrations respond quasi-exponentially after step changes in ventilation, with a half-time of approximately 3 min during hyperventilation but a slower half-time (16 min) during hypoventilation. These differing time courses should be taken into account when sampling blood gases after making ventilator adjustments.
Dead space and Dead space Fraction
Dead space
The physiologic dead space (VD) refers to the “wasted” portion of the tidal breath that fails to participate in CO2 exchange. A breath can fail to accomplish CO2 elimination either because fresh (CO2-free) gas is not brought to the alveoli or because fresh gas fails to contact systemic venous blood. Thus, tidal ventilation is wasted whenever CO2-laden gas is recycled to the alveoli with the next tidal breath. Alternatively, a portion of the tidal volume is wasted if fresh gas distributes to inadequately perfused alveoli, so CO2-poor gas is exhausted during exhalation (Fig. 5-4). If this concept is understood, then it becomes clear why VD cannot be considered accurately as a composite of physical volumes. Nonetheless, wasted ventilation traditionally is characterized as the sum of the “anatomic” (or “series”) dead space and the “alveolar” dead space. Because the airways fill with CO2-containing alveolar gas at the end of the tidal breath, the physical volume of the airways corresponds rather closely to their contribution to
wasted ventilation (the “anatomic” dead space)— provided mixed alveolar gas is similar in composition to the gas within a well-perfused alveolus. This is almost true for a quietly breathing normal subject, in whom the alveolar dead space (poorly perfused alveolar volume) is negligible. When the parenchyma is well aerated and well perfused, the anatomic dead space is relatively fixed at approximately 1 mL/lb of body weight. Quite the opposite is true for patients with most lung diseases, in whom alveolar dead space predominates. Here, the lung is composed of well and poorly perfused units, so the mixed alveolar gas within the airways at end-exhalation has a CO2 concentration lower than that of pulmonary arterial blood. Although VD may increase dramatically, the contribution of stale airway gas to VD is much less important because less amount of airway CO2 is recycled to the alveoli.
wasted ventilation (the “anatomic” dead space)— provided mixed alveolar gas is similar in composition to the gas within a well-perfused alveolus. This is almost true for a quietly breathing normal subject, in whom the alveolar dead space (poorly perfused alveolar volume) is negligible. When the parenchyma is well aerated and well perfused, the anatomic dead space is relatively fixed at approximately 1 mL/lb of body weight. Quite the opposite is true for patients with most lung diseases, in whom alveolar dead space predominates. Here, the lung is composed of well and poorly perfused units, so the mixed alveolar gas within the airways at end-exhalation has a CO2 concentration lower than that of pulmonary arterial blood. Although VD may increase dramatically, the contribution of stale airway gas to VD is much less important because less amount of airway CO2 is recycled to the alveoli.
Related posts:


Stay updated, free articles. Join our Telegram channel

Full access? Get Clinical Tree


