Pulmonary Hypertension and Pulmonary Heart Disease
Charles A. Jenkins
Carlos A. Roldan
Pulmonary hypertension (P-HTN) is prevalent in the general adult population, frequently leads to structural and/or functional right heart disease or pulmonary heart disease, and is associated with high morbidity and mortality.
Pulmonary heart disease accounts for 20% of hospital admissions for heart failure and for 80,000 deaths per year in the United States.
The history and physical examination are limited in determining the etiology, severity, response to therapy, and prognosis of P-HTN and pulmonary heart disease.
Definition and Classification
The World Health Organization classifies P-HTN into five main groups (1): (i) pulmonary artery (PA) hypertension, (ii) P-HTN with left heart disease, (iii) P-HTN associated with lung diseases and/or hypoxemia, (iv) P-HTN due to chronic thrombotic and/or embolic disease, and (v) miscellaneous (Table 5.1).
P-HTN is defined as a mean PA pressure >25 mm Hg at rest (2).
P-HTN not due to left heart disease is defined as a mean PA pressure >25 mm Hg at rest, left ventricle (LV) end-diastolic pressure <15 mm Hg, and pulmonary vascular resistance (PVR) >3 Wood units (2,3,4).
Pulmonary heart disease is defined as right ventricle (RV) hypertrophy, dilatation, and/or diastolic or systolic dysfunction due to P-HTN in the absence of left heart disease.
Common Etiologies of Pulmonary Hypertension
Obliterative: Chronic obstructive pulmonary disease (COPD) characterized by destruction of pulmonary capillary beds.
Vasoconstrictive: Obstructive sleep apnea and obesity hypoventilation syndrome.
Obstructive: Acute or chronic pulmonary embolism (PE), which accounts for more than 600,000 cases of P-HTN in the United States each year.
Idiopathic: Has an incidence of 15 cases per million and a female to male ratio of 1.9:1.0.
Hyperkinetic: Due to left to right shunting more commonly from an atrial or ventricular septal defect, patent ductus arteriosus, or anomalous pulmonary venous return.
Echocardiography
P-HTN is defined by Doppler echocardiography (echo) as a PA pressure >35 mm Hg, determined by the modified Bernoulli equation as 4V2, where V indicates tricuspid regurgitation (TR) jet peak velocity of >2.8 m/second corresponding to a RV to a right atrium (RA) pressure gradient of >31 mm Hg plus an estimated RA pressure ≥5 mm Hg (5).
Although right heart catheterization remains the gold standard for the diagnosis of P-HTN, transthoracic echo (TTE) and in selected cases transesophageal echo (TEE) are the most commonly used methods for the detection and assessment of the severity, etiology, impact on the right heart structure and function, and response to therapy of P-HTN (6) (Table 5.2).
M-Mode, Two-dimensional, and Three-dimensional Echocardiography: Morphology of the Right Heart
Best Imaging Planes
TTE left parasternal long-axis, left parasternal short-axis, left parasternal RV inflow, apical four-chamber, and subcostal four-chamber and short-axis views.
Table 5.1 Revised world health organization classification of pulmonary hypertension
- Pulmonary arterial hypertension
- Idiopathic
- Familial
- Associated with:
- Connective tissue disorder
- Congenital systemic-to-pulmonary shunts
- Portal hypertension
- HIV infection
- Drugs and toxins
- Other (thyroid disorders, glycogen storage disease, Gaucher disease, hereditary hemorrhagic telangiectasia, hemoglobinopathies, chronic myeloproliferative disorders, splenectomy)
- Connective tissue disorder
- Associated with significant venous or capillary involvement
- Pulmonary veno-occlusive disease
- Pulmonary capillary hemangiomatosis
- Pulmonary veno-occlusive disease
- Persistent pulmonary hypertension of the newborn
- Idiopathic
- Pulmonary hypertension with left heart disease
- Left-sided atrial or ventricular heart disease
- Left-sided valvular heart disease
- Left-sided atrial or ventricular heart disease
- Pulmonary hypertension associated with lung diseases and/or hypoxemia
- Chronic obstructive pulmonary disease
- Interstitial lung disease
- Sleep disordered breathing
- Alveolar hypoventilation disorders
- Chronic exposure to high altitude
- Developmental abnormalities
- Chronic obstructive pulmonary disease
- Pulmonary hypertension due to chronic thrombotic and/or embolic disease
- Thromboembolic obstruction of proximal pulmonary arteries
- Thromboembolic obstruction of distal pulmonary arteries
- Nonthrombotic pulmonary embolism (tumor, parasites, foreign material)
- Thromboembolic obstruction of proximal pulmonary arteries
- Miscellaneous
- Sarcoidosis, histiocytosis X, lymphangiomatosis
- Compression of pulmonary vessels (adenopathy, tumor, fibrosing mediastinitis)
- Sarcoidosis, histiocytosis X, lymphangiomatosis
(Adapted from Simonneau G, Galiè N, Rubin LJ, et al. Clinical classification of pulmonary hypertension. J Am Coll Cardiol. 2004;43(12 Suppl S): 5S–12S.)
- Pulmonary arterial hypertension
TEE transgastric short- and long axis views of the RV and midesophageal four-chamber view.
Key Diagnostic Features of Specific Abnormalities
Right Ventricular Pressure and Volume Overload
Determining RV pressure and/or volume overload is essential in defining the presence and in part the etiology of P-HTN. These findings also help to determine more accurately associated RV hypertrophy, dilatation, and diastolic or systolic dysfunction.
Table 5.2 Appropriate indications (score 7–9) for echocardiography in pulmonary hypertension and pulmonary heart disease
Symptoms of dyspnea and shortness of breath potentially due to cardiopulmonary disease (TTE).
Evaluation of hypotension or hemodynamic instability of uncertain or suspected cardiopulmonary etiology (TTE/TEE).
Evaluation of respiratory failure with suspected cardiopulmonary etiology (TTE).
Detection and assessment of the severity of P-HTN (TTE).
Assessment of right-sided cardiac chamber size and pressures (TTE).
Definition of the severity of RV dilatation, hypertrophy, and diastolic or systolic dysfunction (TTE).
Evaluation of patient with known or suspected acute PE to guide thrombolytic or thrombectomy therapy (TTE).
Identification of large proximal PE in hemodynamically compromised patients with RV systolic dysfunction (TTE/TEE).
Detection and characterization of RA and RV thrombi or right heart valves masses (TTE/TEE).
Diagnosis of the presence, type, and severity of intracardiac shunts (2D and RT3D TTE/TEE).
Guidance during percutaneous closure of ASD (2D and RT3D TEE).
Detection and assessment of the severity of tricuspid or pulmonic valve regurgitation (TTE).
Assessment of LV systolic or diastolic dysfunction and valvular or coronary heart disease as etiologies of P-HTN (TTE/TEE).
TTE, transthoracic echocardiography; TEE, transesophageal echocardiography; P-HTN, pulmonary hypertension; RV, right ventricle; PE, pulmonary embolism; RA, right atrium; 2D, two-dimensional; RT3D, real-time three-dimensional; ASD, atrial septal defect.
(Adapted from Douglas PS, Garcia MJ, Haines DE, et al. ACCF/ASE/AHA/ASNC/HFSA/HRS/SCAI/SCCM/SCCT/SCMR 2011 appropriate use criteria for echocardiography. J Am Coll Cardiol. 2011;57:1126–1166.
High RV systolic pressure leads to prolonged RV ejection, which results in the RV pressure transiently exceeding the LV pressure during late systole and early diastole.
Therefore, RV pressure overload, best assessed by M-mode, leads to flattening or curving of the interventricular septum toward the LV during late systole and early diastole (transient “D-shaped LV”) (Fig. 5.1A). The septum resumes its usual shape during mid- to late diastole.
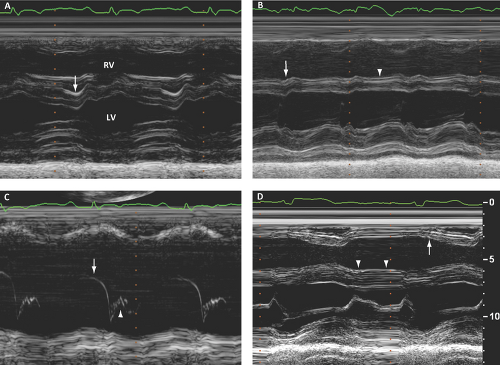
Figure 5.1: Pulmonary heart disease by M-mode imaging. Two-dimensional guided M-mode images were obtained from the left parasternal view. A. Posterior or toward the left ventricle (LV) displacement of the interventricular septum during late systole and early diastole (arrow), which is typical of right ventricular (RV) pressure overload. B. Posterior displacement of the interventricular septum during late systole and early diastole (typical of RV pressure overload, arrow) and mid to late diastole (arrowhead), which is typical of RV volume overload. A small posterior pericardial effusion is also noted. C. M-mode of the pulmonic valve in a patient with severe pulmonary-HTN shows the characteristic loss of the atrial (a) wave (arrow) and midsystolic closure (arrowhead). D. RV hypertrophy with an end-diastolic thickness of 7 mm (arrow) and associated interventricular septal motion patterns of pressure and volume overload (arrowheads).
RV pressure overload septal motion pattern is seen in patients with moderate to severe P-HTN (pressure >45 mm Hg), but it may be absent in those with high LV end-diastolic pressure.
Chronic P-HTN and RV pressure overload are commonly associated with RV volume overload, which results from RV, tricuspid valve annular, right ventricular outflow tract (RVOT), and main PA dilatation leading to functional TR and pulmonary regurgitation (PR). Also, intracardiac shunts as cause of RV volume overload eventually lead to RV pressure overload.
RV volume overload, also best assessed by M-mode, leads to displacement of the interventricular septum toward the LV in mid- to late diastole as RV exceeds LV diastolic pressure during this phase (Fig. 5.1B). The interventricular pressure difference reverses during systole, and the septum resumes its normal contour.
RV volume overload septal motion pattern is uncommon with mild volume overload and is seen in ≤50% of those with moderate volume overload.
In moderate to severe P-HTN, M-mode of the pulmonic valve shows midsystolic closure and decrease in late diastolic transpulmonic flow (loss of “a” wave) (Fig. 5.1C).
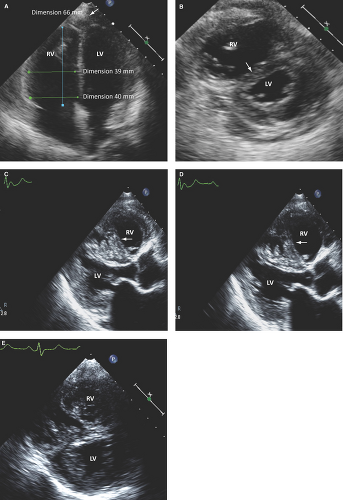
Figure 5.2: Severe pulmonary heart disease by 2D imaging. A. Two-dimensional apical four-chamber view shows severe RV dilatation forming the heart apex (arrow). Although the RV is clearly severely dilated (larger than the LV), currently recommended cutoff values of >42 mm for basal, >35 mm for mid, and >86 mm for long-axis dimensions for the definition of RV dilatation would indicate no dilatation. B. Corresponding parasternal short-axis view showing severe RV dilatation with characteristic abnormal interventricular septal motion of pressure and volume overload (arrow). C–E. Two-dimensional left parasternal views in another patient show severe RV dilatation with interventricular septal posterior displacement during late systole–early diastole of RV pressure overload (C), during late diastole of RV volume overload (D), and severe RV hypertrophy and trabeculations (E). Also note a prominent moderator band in C and D (arrows). RV, right ventricle; LV, left ventricle.
Right Ventricular Hypertrophy
RV free wall thickness is best measured by M-mode in the long parasternal and subcostal four-chamber views at end diastole and at the level of the tricuspid valve chordae tendineae (Fig. 5.1D).
RV hypertrophy is defined as RV wall thickness >5 mm.
RV hypertrophy is highly predictive of chronic RV pressure overload.
Right Ventricular Dilatation
RV end-diastolic dimensions are best assessed from a nonforeshortened two-dimensional (2D) apical four-chamber view, but its assessment from the left parasternal and subcostal views is also necessary.
In the normal heart, the RV end-diastolic area is less than that of the LV, and the RV apex is short of the LV apex by one-third of the distance from the base to the apex. Therefore, RV dilatation is present if the RV apex forms part or most of the heart apex (Fig. 5.2A).
An RV end-diastolic dimension of >42 mm at the base, >35 mm at the mid level, and a longitudinal (base to apex) dimension >86 mm indicate RV dilatation (7,8). However, the authors believe these cutoff values may be specific but not sensitive for detecting RV dilatation (Fig. 5.2A).
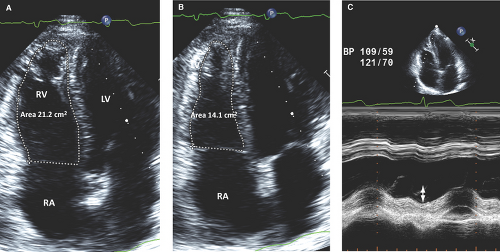
Figure 5.3: Assessment of right ventricular systolic function. These 2D and M-mode images illustrate the case of a patient with severe pulmonary heart disease as manifested by moderate right heart chambers dilatation and RV systolic dysfunction as determined by a fractional area change of 33% (derived by an RV end-diastolic area of 21.2 cm2 (A), minus RV end-systolic area of 14.1 cm2 (B) divided by RV end-diastolic area, and a TAPSE of 1.4 cm (C). RA, right atrium; RV, right ventricle; LV, left ventricle.
Complementary assessment of RV dilatation from the parasternal short and long axis views is necessary (Fig 5.2B–E).
Parameters for categorizing RV dilatation into mild, moderate, or severe have not been determined.
Right Ventricular Systolic Dysfunction
Normal RV ejection fraction is ≥40% as assessed by nuclear imaging.
RV fractional area change (end-diastolic area – end-systolic area end-diastolic area ×100) <35% indicates RV systolic dysfunction (7) (Fig. 5.3A,B).
Tricuspid annular plane systolic excursion (TAPSE) is closely correlated with RV systolic function.
TAPSE is best obtained by M-mode placed at the basal lateral tricuspid valve annulus from the apical four-chamber view and measured (in centimeters) from end diastole to end systole (Fig. 5.3C).
A TAPSE <1.6 cm indicates RV systolic dysfunction and is a poor prognostic indicator in patients with P-HTN (7,9).
Real-time three-dimensional (RT3D) echo may be more accurate than 2D echo in measuring RV volumes and ejection fraction (10,11,12,13). However, this technique is time-consuming and is not readily available.
By RT3D, the upper reference RV end-diastolic and end-systolic volume indexes are 89 mL/m2 and 45 mL/m2, respectively, and the lower reference value for RV ejection fraction is 44%.
Right Atrial Dilatation
RA dimensions, volume, and area are measured at ventricular end systole from the apical four-chamber view.
RA dilatation and hypertension commonly occur with chronic RV pressure overload, which first lead to increased RV end-diastolic pressure and then to increased RA pressure.
RA length is measured from the center of the tricuspid annulus to the superior RA wall parallel to the interatrial septum.
RA width is measured perpendicular to its length and from the mid free wall to the interatrial septum.
A RA length >53 mm, width >44 mm, or area >18 cm2 indicate RA dilatation (7,8). As for the RV, the authors believe these cutoff values are specific but may not be sensitive for detecting RA dilatation (Fig. 5.4A–C).
Right Atrial Hypertension
RA pressure is estimated by the diameter and degree of collapse of the inferior vena cava (IVC) with inspiration or a sniff.
The IVC diameter is measured within 2 cm of the RA, preferably just proximal to the entrance of hepatic veins.
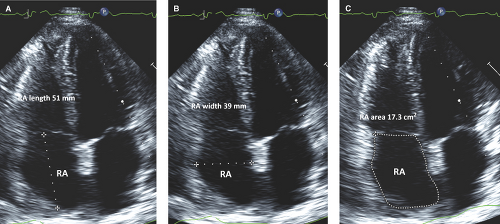
Figure 5.4: Right atrial dilatation. These 2D images corresponding to the patient described in Figure 5.3 clearly illustrate RA dilatation (larger RA than LA). However, currently recommended cutoff values of RA length >53 mm (A), width >44 mm (B), or area >18 cm2 (C) for definition of RA dilatation would indicate no dilatation. Therefore, these cutoff values are specific but may not be sensitive for detection of RA dilatation.
The normal IVC diameter ranges from 1.2 to 2.3 cm (mean, 1.7 cm).
The RA pressure based on the dynamic changes of the IVC diameter is qualitatively and more accurately assessed by M-mode (Figs. 5.5 and 5.6):
RA pressure is <5 mm Hg if the IVC is small (<1 cm) and collapses with inspiration.
RA pressure is 5 to 10 mm Hg if the IVC measures 1.0 to 1.5 cm and collapses >50% with inspiration or a sniff. The hepatic vein diameter and inflow pattern are normal.
RA pressure is 10 to 15 mm Hg if the IVC is 1.5 to 2.0 cm and collapses <50% with inspiration or a sniff. The hepatic veins are mildly dilated, and their systolic to diastolic inflow ratio is <1.
RA pressure is 15 to 20 mm Hg if the IVC is >2 cm and collapses <25% with a sniff. The hepatic veins are dilated (>1 cm), and systolic inflow may be absent.
RA pressure is >20 mm Hg if the IVC is >2 cm and does not collapse with a sniff. Hepatic veins are dilated, and systolic reversal is common.
Two-dimensional images of the IVC are of important complementary value in the assessment of RA pressure. Also, detection by this technique of dilatation of the hepatic veins (Fig. 5.6A,B), spontaneous echo contrast in the IVC (Fig. 5.6BRelated posts:

Stay updated, free articles. Join our Telegram channel

Full access? Get Clinical Tree


