Diagram showing potential outcomes of individual trials for postoperative nausea and vomiting (PONV). The middle column shows whether a variable, such as sex, is associated with PONV, and whether an intervention changes the rate of PONV. The right-hand column depicts the possible results of an experiment, which may correctly or incorrectly identify associations and effects as present or absent. Experiments that correctly identify associations and effects as present (Yes) or absent (No) are colored light gray, whereas false results are colored dark gray.
The variables in the left-hand box might be those we are examining for a prediction model, e.g., age or sex, or they might be interventions we are testing for an effect, e.g., metoclopramide or ondansetron. We want our research to return the light gray boxes and not the dark gray boxes. Sample size calculations quantify the “Yes” boxes: light gray is the power, dark gray is the P value. A variable can associate with PONV or fail to associate with PONV, consistently or inconsistently. Inconsistent associations might be more common than consistent associations. It is important to appreciate that a P value underestimates the chance of a false discovery for inconsistent associations. Consider a variable that associates with PONV half the time: how often would it be wrong to accept an association if the P value was 0.05? Remember that the P value is the probability that we incorrectly accept an association when there is no association. So it might be considered that the probability of incorrectly accepting an association is 0.05 or 5% or 1 in 20. But what about the probability that we will accept an association when there is an association? Flow Diagram 15.2 depicts 1000 tests each with a power of 80% for which we use a P value of 0.05 to accept that a variable is associated with PONV, but the association is true only half of the time.
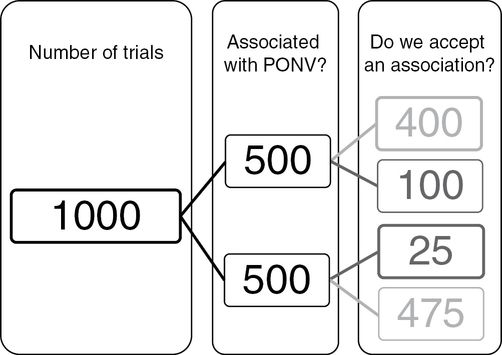
Diagram showing outcomes of trials for postoperative nausea and vomiting (PONV) where the middle column depicts 1000 experiments, in which half have a variable that associates with PONV (or an intervention that affects PONV) and in half there is no association or effect. Sample sizes are calculated using two parameters plus an effect size. One parameter is the power – the probability of correctly accepting an effect – which in this example is equivalent to 400 in the right-hand column divided by the number of experiments where the association exists (500), i.e., 400/500, which is 0.80 or 80%. The other parameter is the statistical threshold for accepting an effect when it does not exist, which in this example is equivalent to the 25 in the right-hand column, divided by the number of experiments in which an effect does not exist (500), i.e., 25/500, which is 0.05. The total number of times that we would declare an effect in this scenario is 400 + 25, which is 425. The proportion of times that this declaration would be wrong is 25/425, or 0.06 or 6%, which is called the “false discovery rate,” which means that the P value of 0.05 underestimates the number of times we would incorrectly state that an effect exists.
You can see that the number of times we incorrectly accept an association is 25/425 or 0.059, slightly more than the P value of 0.05. This disparity is not particularly worrying. However, the disparity rapidly grows as the association becomes less consistent or as the power weakens. Consider Flow Diagram 15.3 in which a variable associates with PONV 10% of the time, again in trials with a power of 80% and for which we will accept an association at P = 0.05.
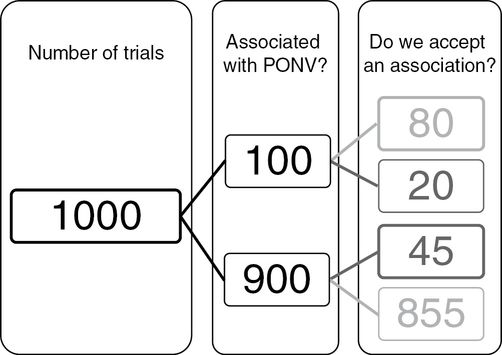
Diagram showing how the principles illustrated in Flow Diagram 15.2 result in worryingly high false discovery rates when an effect is weak, being present in 100/1000 experiments. The total number of times that we would declare an effect in this scenario is 80 + 45, which is 125. The proportion of times that this declaration would be wrong is 45/125, or 0.36 or 36%, which means that the P value of 0.05 (45/900) substantially underestimates the number of times we would incorrectly state that an effect exists. PONV, postoperative nausea and vomiting.
In this case the number of associations that we incorrectly accept is 45/125 or 0.36 or 36%.
Let us take as an example RCTs of metoclopramide. The RR of postoperative vomiting (POV) is reduced by 25% or so by metoclopramide compared with placebo (RR 0.75). The control rate of POV in RCTs of metoclopramide has averaged 40%. About 750 participants would need to be recruited (375 in the control group and 375 in the metoclopramide group) to have a 20% probability (80% power) of falsely rejecting a real association and a 5% probability of incorrectly accepting an absent association (P value of 0.05). Unfortunately, researchers have recruited 46 participants on average (23 to each group), a power of about 5%. Let us suppose that metoclopramide has an effect in half of the RCTs (Flow Diagram 15.4).
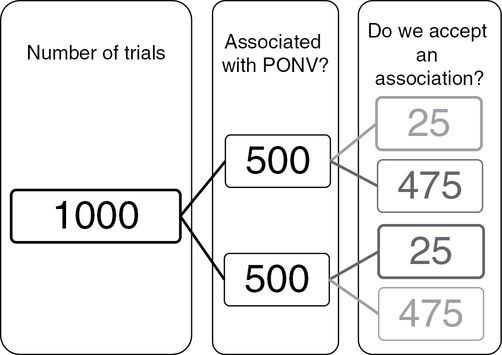
Diagram showing the situation that represents many randomized controlled trials of drugs to prevent nausea and vomiting, in which the relative risk of postoperative nausea and vomiting (PONV) is 0.5 (500/1000) but the power is only 0.05 (25/500), as is the P value for statistical significance. The total number of times that we would declare an effect in this scenario is 25 + 25, which is 50. The proportion of times that this declaration would be wrong is 25/50, or 0.50 or 50%, which means that the P value of 0.05 (25/500) overestimates 10-fold the proportion of times that there is an effect when we declare there is an effect.
The rate of wrong acceptance is 25/50, or 0.5 or 50%. A combination of 5% power and a less consistent association with PONV, say 10%, would result in a false detection rate of 45/50 or 90%! It can be noted that the probability of falsely rejecting a true association is also affected by the rate of association and the choices of power and statistical threshold. In the first scenario (association 50%, power 80% and P value 0.05), the rate of wrong rejection was 100/575, 0.17 or 17%. In the second scenario (association 10%, power 80% and P value 0.05), the rate of wrong rejection was 20/875, 0.02 or 2%. In the third scenario (association 50%, power 5% and P value 0.05), the rate of wrong rejection was 475/950, 0.5 or 50%, i.e., in this last scenario, which might be representative of PONV RCTs, half the time we say that there is an association there is not, and half the time we say that there is not an association there is[5].
So trials with low power do not detect true associations but do detect untrue associations. Trials with more power detect more true associations; they generate smaller P values that congregate more closely around the true magnitude of the association. Figures 15.1–15.3 illustrate the association of trial power with the accuracy (and precision) of the results. This author has conducted 300,000 simulations of RCTs of metoclopramide in which the average control and intervention PONV rates were 40% and 30%, respectively. Also conducted were 100,000 simulations for trials, which recruited 20, 80 or 320 participants per group, with respective powers of 5%, 21% and 73% (Figure 15.1); the true RR was 30/40 or 0.75. The P value sequentially increases with loss of power, and as expected the proportion of simulations that generated P values <0.05 were 73.4%, 21.3% and 5.9% at powers of 73%, 21% and 5%.
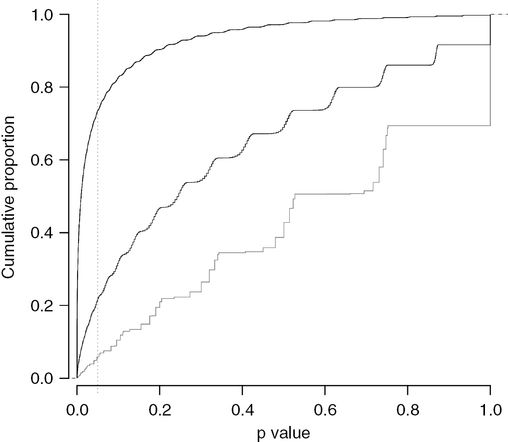
A graph showing the proportion of randomized controlled trials (vertical axis) that generate a P value less than a given value (horizontal axis). Simulations of experiments of an antiemetic drug were run by this author, which reduced the rate of postoperative nausea and vomiting (PONV) by 0.25, i.e., the relative risk of PONV is 0.75 after the drug, who simulated experiments that recruited 20, 80 or 320 participants to each group, one receiving the antiemetic drug and the other a placebo. The power of these studies to identify an effect were 5%, 21% and 73%, which is the proportion of trials (vertical axis) that generated a P value less than 0.05 (horizontal axis).
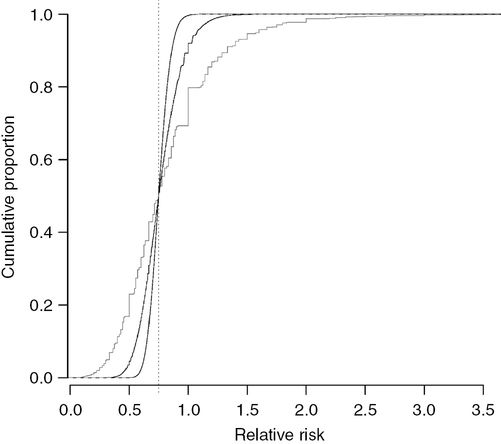
The same simulations used to plot Figure 15.1 are used in this graph to illustrate the proportion of randomized controlled trials (vertical axis) that generate a relative risk (RR) less than a given value (horizontal axis). The true effect of the antiemetic is a RR for postoperative nausea and vomiting of 0.75 (dotted vertical line). Experiments that recruit 320 participants to each group generate RRs similar to 0.75, whereas experiments that recruit only 20 participants to each group generate RRs that are often much smaller or larger than 0.75.
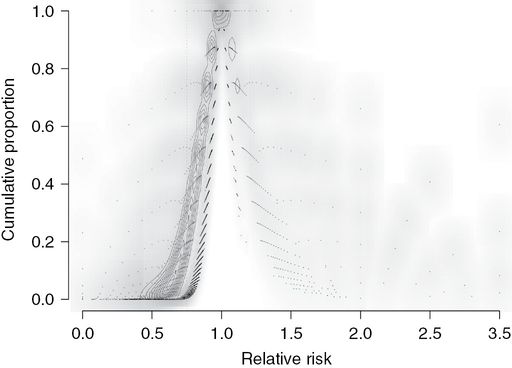
Figure combining Figures 15.1 and 15.2, plotting the right-skewed distribution of P values versus the relative risk (RR) of each simulated experiment. The P values from trials with 20 participants per group, which had a power of 5%, are more widely distributed to the left and right of the other two distributions (black contours). The distribution of P values from trials that recruited 80 participants per group (power 21%) forms a narrower band of P values between the other two distributions (gray contours). The distribution of P values from trials that recruited 320 participants per group (73% power) form a narrow concentrated band of P values (white contours), 73% of which are less than 0.05, predominantly around the true RR of 0.75 (vertical dashed line).
Half of the RCTs have RRs less than the true value (0.75) and half have values more than 0.75. The 95% confidence interval (CI) for the RR increases around the median of 0.75 as the power decreases: 0.60–0.92, 0.47–1.15 and 0.24–1.80 with powers of 73%, 21% and 5%, respectively (Figure 15.2).
The null hypothesis that is being tested is that differences in rates of PONV between groups are due to chance, i.e. the RR is one. The P value is the probability of falsely accepting an effect of metoclopramide, so if the rate of vomiting is the same in the control and metoclopramide groups (RR of 1), we would be very foolish to say that there is a difference, which the P value of 1 reflects. The absence of an effect becomes less likely (P values become smaller) the greater the discrepancy between the observed RR and a RR of 1 (no drug effect). Trials with a power of 5% will generate statistically significant RRs that are smaller than RCTs with powers of 21% or 73%: in simulations, the respective mean (95% CI) RRs for RCTs P values <0.05 were 0.49 (0.10–2.33), 0.56 (0.41–0.64) and 0.72 (0.59–0.80). There are relatively few trials that generate RRs in excess of 1, as indicated by the lack of trial density contour lines (Figure 15.3).
What does this all mean for calculating the effect of a drug such as metoclopramide? It is of surprise to note that a more reliable estimate of the effect of an antiemetic drug is obtained if the results of “insignificant” RCTs (P >0.05) rather the results of “significant” RCTs (P ≤ 0.05) are used, which is a consequence of antiemetic RCTs having powers of 5–30%.
Table 15.2 explains this apparent paradox. We are going to simulate RCTs of an antiemetic in three populations: with mean (95%) rates of vomiting in the control group of 10% (4–16), 20% (12–28) and 40% (30–49). We will generously assume that the antiemetic consistently reduces the vomiting rate to 75% of the control rate, so for every 100 participants given metoclopramide the number that will benefit will be 2.5 (10 subtract 7.5), 5 (10 subtract 15) and 10 (40 subtract 30), respectively. The RCTs recruit 20, 50 or 100 participants to both the control and metoclopramide groups. The RCTs are done perfectly: there is no bias in any methodologic domain (see below). What are our results? It can be seen that the power increases with the rate of vomiting in the control group as well as with the number of participants. As expected, the P values decrease as the power increases and the RRs get closer to 0.75. This author used two methods to generate “average” RRs for each trial size in each vomiting rate population: the meta-analysis method is statistically correct, whereas the “mean” value is not, but it might better reflect the average belief of what effect metoclopramide had if the readers were asked, who would have read a sample of RCT results and do not do meta-analyses in their heads. If readers “believed” all results equally, it would be expected for them to believe that the RR of vomiting after metoclopramide was between 0.95 and 0.76, whereas if they only believed statistically significant results, they would think that the RR was between 0.59 and 0.11, which doubles the number of patients who appeared to benefit. In contrast, the mean RRs of insignificant trials were between 0.97 and 0.82.
| Control rate | 10% | 20% | 30% | |||||||
|---|---|---|---|---|---|---|---|---|---|---|
| Group size | 20 | 50 | 100 | 20 | 50 | 100 | 20 | 50 | 100 | |
| Power (% P values ≤0.05) | 1 | 3 | 6 | 3 | 6 | 12 | 6 | 13 | 26 | |
| Programmed average values | ||||||||||
| Does vomit | ||||||||||
| Control | 2 | 6 | 10 | 4 | 12 | 20 | 6 | 18 | 30 | |
| Drug | 1.5 | 4.5 | 7.5 | 3 | 9 | 15 | 4.5 | 13.5 | 22.5 | |
| Does not vomit | ||||||||||
| Control | 18 | 44 | 90 | 16 | 38 | 80 | 14 | 32 | 70 | |
| Drug | 18.5 | 45.5 | 92.5 | 17 | 41 | 85 | 15.5 | 36.5 | 77.5 | |
| Patients per 100 treated who benefit | 2.5 | 2.5 | 2.5 | 5 | 5 | 5 | 10 | 10 | 10 | |
| Average relative risks of simulated RCTs | ||||||||||
| True value | ||||||||||
| RCTs any P | ||||||||||
| ‘Mean’ | 0.75 | 0.86 | 0.94 | 0.84 | 0.95 | 0.83 | 0.78 | 0.82 | 0.77 | 0.76 |
| Meta-analysis | 0.75 | 0.81 | 0.78 | 0.77 | 0.79 | 0.76 | 0.76 | 0.77 | 0.76 | 0.75 |
| RCTs P ≤ 0.05 | ||||||||||
| ‘Mean’ | 0.75 | 0.11 | 0.47 | 0.43 | 0.35 | 0.41 | 0.45 | 0.39 | 0.48 | 0.59 |
| Meta-analysis | 0.75 | 0.16 | 0.22 | 0.33 | 0.22 | 0.34 | 0.44 | 0.32 | 0.48 | 0.59 |
| RCTs P > 0.05 | ||||||||||
| ‘Mean’ | 0.75 | 0.88 | 0.96 | 0.86 | 0.97 | 0.85 | 0.83 | 0.85 | 0.82 | 0.82 |
| Meta-analysis | 0.75 | 0.82 | 0.79 | 0.80 | 0.80 | 0.80 | 0.81 | 0.80 | 0.80 | 0.82 |
| Overestimate of benefit per 100 (simulated true) | ||||||||||
| RCTs any P | ||||||||||
| ‘Mean’ | 0 | −1.1 | −2.3 | −0.9 | −4.0 | −1.8 | −0.7 | −2.9 | −1.2 | −0.5 |
| Meta-analysis | 0 | −0.6 | −0.3 | −0.2 | −0.7 | −0.3 | −0.2 | −1.0 | −0.3 | −0.2 |
| RCTs P ≤ 0.05 | ||||||||||
| ‘Mean’ | 0 | 6.4 | 3.3 | 3.3 | 8.0 | 8.1 | 6.0 | 14.3 | 13.1 | 6.5 |
| Meta-analysis | 0 | 5.9 | 6.4 | 4.2 | 10.6 | 9.9 | 6.2 | 17.4 | 13.0 | 6.3 |
| RCTs P > 0.05 | ||||||||||
| ‘Mean’ | 0 | −1.3 | −2.5 | −1.1 | −4.4 | −2.5 | −1.5 | −4.1 | −3.4 | −3.0 |
| Meta-analysis | 0 | −0.7 | −0.5 | −0.5 | −1.0 | −1.0 | −1.2 | −2.2 | −2.4 | −2.8 |
Related posts:
 Pharmacology of serotonin antagonists
Pharmacology of histamine, muscarine and dopamine antagonists
Pharmacology of serotonin antagonists
Pharmacology of histamine, muscarine and dopamine antagonists
 Pharmacology of neurokinin antagonists and novel antiemetics
Management of postoperative nausea and vomiting in inpatients and ambulatory patients
Implementing postoperative nausea and vomiting management guidelines
Pharmacology of neurokinin antagonists and novel antiemetics
Management of postoperative nausea and vomiting in inpatients and ambulatory patients
Implementing postoperative nausea and vomiting management guidelines
 Management of postoperative nausea and vomiting in pediatric patients
Stay updated, free articles. Join our Telegram channel

Full access? Get Clinical Tree


