Structure and function
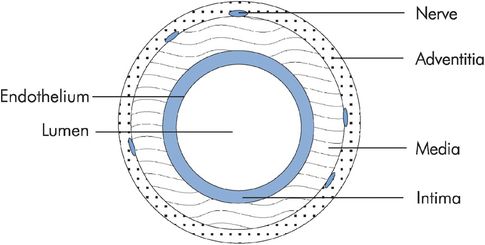
Blood vessel walls are basically structured in three layers. The adventitia is the outer layer and is made up of connective tissue with nerve fibres. The middle layer or media is of varying thickness and contains mainly smooth muscle. The innermost layer is the intima and consists of the endothelium, basement membrane and supporting connective tissue (Figure 15.2). The composition of blood vessel walls is mainly a mixture of elastic tissue, fibrous tissue and smooth muscle. This mixture again varies according to the type of vessel. The aorta walls are predominantly elastic and fibrous tissue with little smooth muscle, whereas the vena cava walls consist largely of smooth muscle and fibrous components. The composition of vessel walls reflects their function.
Blood vessel structure
| Characteristic | Functional aspect |
|---|---|
| Wall thickness | Thick walls provide tensile strength to withstand pressure in arteries Thin walls in capillaries allow exchange with interstitial fluid |
| Elastic component in walls | Smoothing of pulsations, storage of energy to maintain flow in diastole |
| Smooth muscle component in walls | Control of vessel diameter by autonomic reflex and humoral activity |
| Fibrous component in walls | Mechanical strength |
Blood vessel diameter and wall thickness
A major factor determining thickness is mean arterial pressure. Some typical values for vessel diameter, wall thickness and mean arterial pressure are given in Figure 15.4.
| Vessel | Diameter | Wall thickness | Mean pressure (mmHg) |
|---|---|---|---|
| Aorta | 25 mm | 2 mm | 100 |
| Artery | 4 mm | 1 mm | 95 |
| Arteriole | 20 μm | 6 μm | 50 |
| Terminal arteriole | 10 μm | 2 μm | 45 |
| Capillary | 8 μm | 0.5 μm | 30 |
| Venule | 20 μm | 1 μm | 20 |
| Vein | 5 mm | 0.5 mm | 8 |
| Vena cava | 30 mm | 1.5 mm | 3 |
Blood vessel function
The arteries transport blood under high pressure to the tissues, where they divide into smaller arterioles, which in turn release the blood into capillaries. There the exchange of fluid, nutrients, electrolytes and other substances between the interstitial fluid and the blood takes place. The venules collect blood from the capillaries, and join together into veins to transport the blood back to the heart.
Blood vessels also function to smooth the pulsatile pressure waveform in the aorta, to control pressure at the capillary beds, and to store blood volume. The control of regional perfusion is dependent on reflexes and autoregulation, which rely on arteriolar control. The functions of the different types of vessel in the circulatory system are summarised in Figure 15.5.
| Vessel | Function |
|---|---|
| Aorta | Storage of energy to maintain delivery in diastole, and damping of pressure pulses |
| Arteries | Delivery, distribution and damping of pressure waveform |
| Arterioles | Resistance to control pressure and distribution to capillaries |
| Capillaries | Microcirculation and exchange |
| Venules and small veins | Collection |
| Large veins and venae cavae | Collection, storage capacitance and delivery of venous return (or portal circulations) |
Pressure and flow in the vascular system
Flow and flow velocity
The functioning of organ systems depends on the volume of blood flowing per unit time through them, or the volume flow rate. This is often shortened to the term ‘flow’. Flow can be measured in millilitres per second (or litres per minute). The total flow through the systemic circulation or the lungs is equal to the cardiac output.
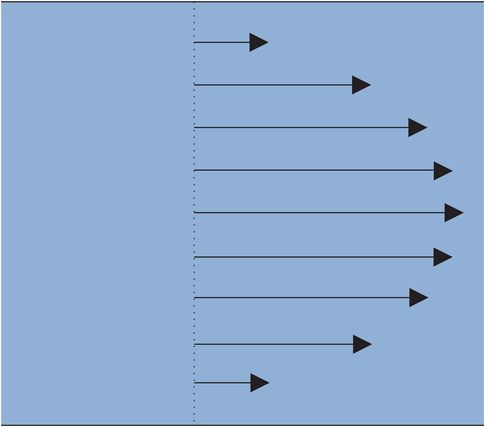
Flow should be differentiated from flow velocity. Flow velocity defines how fast fluid is moving at any given point and has units of centimetres per second. In a blood vessel the flow velocity of blood varies between the centre of the vessel and the vessel wall. If the flow pattern of the blood is described as laminar (i.e. without turbulence) the blood moves smoothly in the direction of the axis of the vessel. The velocity of the blood varies in a predictable pattern, with maximum velocity in the centre of the vessel and minimum velocity next to the wall, as if the blood is moving in concentric layers (Figure 15.6).
Physics of laminar flow
Consider a vessel with cross-sectional area A. The mean flow velocity (v) can be taken across the cross-section. The flow (Q) is then related to the mean flow velocity (v) by
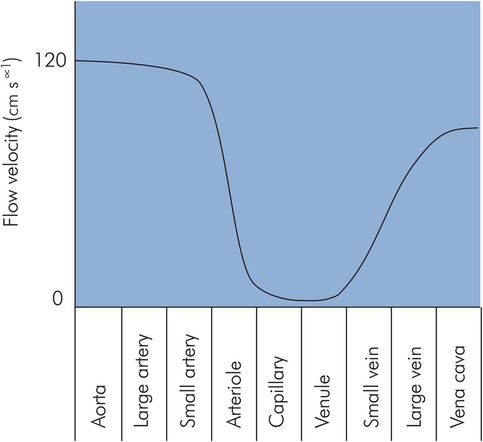
This relationship can be applied to the vascular system as a whole, since the number and diameter of any type of blood vessel determines the total cross-sectional area presented to flow at that stage in the vascular system. The greater the total cross-sectional area of any given generation of vessels, the slower the velocity of blood flow through those vessels. The cross-sectional area of the aorta is about 4.5 cm2, with peak flow velocities of > 120 cm s−1. In contrast, the flow velocity in the several billion capillaries of the vascular system is usually between 0 and 1 cm s−1 due to a total capillary cross-sectional area of > 4500 cm2 (Figure 15.7). These flow velocities reflect the functions of delivery and distribution in the aorta and arteries, as opposed to perfusion and exchange in the capillaries.
Flow velocity in different vessels
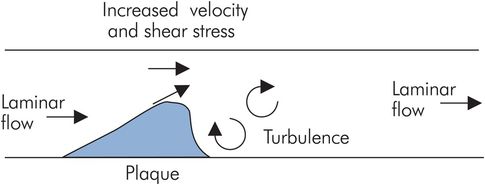
In an individual vessel, if the cross-sectional area is reduced by a constriction such as a valve or an atheromatous plaque, the flow velocity increases through the constriction. Such increases in flow velocity can affect the characteristics of the blood flow, making it turbulent and leading to an increased tendency towards thrombus formation. The motion of blood across the stationary surface of the vessel wall produces a viscous drag or shear stress along the surface of the vessel wall. This shear stress is increased with increased flow velocity, producing a force that tends to pull endothelium and plaques away from the wall, leading to dissection or emboli. Increased flow velocity also produces bruits or murmurs (Figure 15.8).
Flow through the systemic circulation
The energy imparted to blood within the circulation by the heart and the elastic recoil of the great vessels causes it to flow through the systemic and pulmonary circulations. There are additional contributions of energy to flow from skeletal muscle contraction and negative intrathoracic pressure during inspiration. These mechanisms create a pressure difference across the vascular system that produces the total flow (cardiac output) through the vascular system.
A simple electrical analogy can be found in Ohm’s law, where a potential difference (V) produces an electrical current (I) through a resistance (R). In this case
Thus the pressure difference between mean arterial pressure (MAP) and central venous pressure (CVP) is related to cardiac output (CO) and systemic vascular resistance (SVR) by:
This is often approximated to:
Vascular resistance
‘Vascular resistance’ is a clinical term used to represent the effect of all the forces opposing blood flow through a vascular bed. It may be applied to the systemic vascular circulation, the pulmonary circulation or a given visceral circulation. The forces opposing blood flow through a vascular system are composed of two main components. First, there are those which dissipate energy because of frictional effects. This resistance arises as a result of drag between fluid layers and friction between fluid and vessel walls. The viscosity of the blood is a major determinant of this component of resistance.
The second component of opposing forces arises from the conversion of pump work into stored energy. This occurs when potential energy is stored by the elasticity of distended vessel walls or by gravity as blood is pumped to a greater height within the body. In addition, inertial effects store kinetic energy when blood is accelerated. This component is referred to as the ‘reactive’ component, and it is dependent on the pulsatile component of the pressure waveform. If the pressure difference applied across a vascular bed were constant, the reactive component would be minimal.
Flow in a single vessel
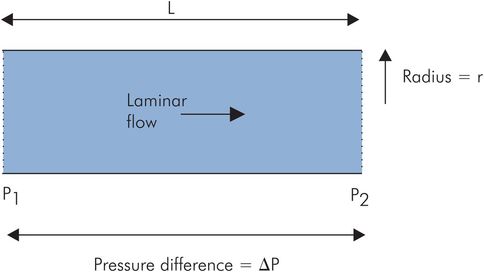
Blood flow through larger vessels (> 0.5 mm diameter) can be approximated to the case of an idealised or Newtonian fluid (such as water) flowing through a tube. Under laminar flow conditions with a ‘steady’ pressure gradient, the flow (Q) between any two points, P1 and P2, is dependent on the pressure difference, ΔP, between the points, and inversely dependent on the resistance to flow (R):

According to the Hagen–Poiseuille law, which describes laminar flow in tubes, the flow resistance, R, is dependent on the length of the tube and the viscosity of the fluid, but inversely related to the fourth power of the radius (Figure 15.9). The real situation of blood flowing through a vessel differs from this ideal model in the following respects:
Blood vessels are not uniform in cross-section.
Blood vessel walls are elastic.
Pressure gradients pushing blood through vessels are not ‘steady’ but have a pulsatile component.
Blood as a fluid behaves differently from a Newtonian fluid because of the cellular components, and its flow properties are not determined solely by viscosity.
The Hagen–Poiseuille law
Blood viscosity
The rheological properties of blood describe its flow-resistive properties. In a Newtonian fluid these resistive properties are dependent on a constant, the coefficient of viscosity. Blood, however, is a suspension of cells, and although the viscosity can be determined to give an apparent value, this value varies significantly with blood composition and flow conditions. The factors causing this variation in apparent viscosity include:
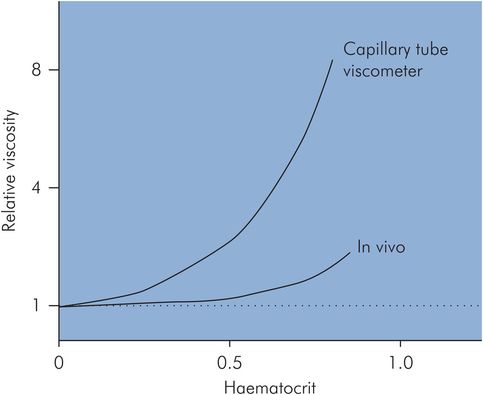
Haematocrit – an increase in haematocrit to 0.7 (normal haematocrit = 0.45) can double the apparent viscosity (Figure 15.10).
Diameter of the vessel – apparent blood viscosity can be measured in vitro using a capillary tube viscometer, and decreases as tube diameter decreases to below about 0.3 mm.
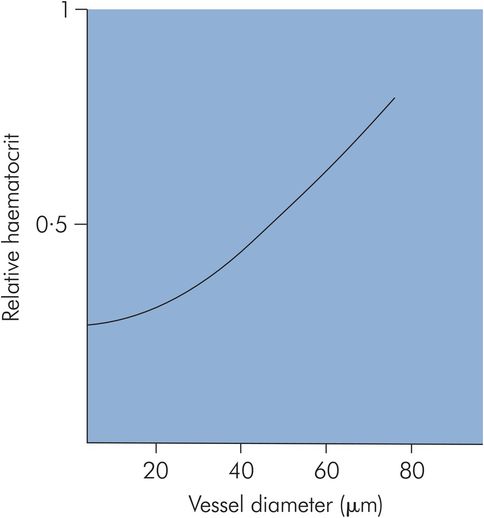
Red blood cell streaming – in smaller-diameter vessels red blood cells stream centrally along the axis of the vessel. This effectively reduces the haematocrit in these vessels. The haematocrit in capillaries may be 25% of the value in larger vessels (Figure 15.11).
In vivo – apparent blood viscosity is lower in vivo than in vitro. At normal haematocrit the in vivo blood viscosity may only be half of the equivalent in vitro value.
Flow velocity – apparent viscosity decreases at higher flow velocities and increases at low flow velocities. This is due to increased red cell aggregation and leucocyte adherence to vessel walls at low flow velocities.
Haematocrit related to viscosity
Haematocrit related to blood vessel size
The functions of different blood vessels are reflected in their structures and flow characteristics.
Flow velocity is inversely related to the total cross-sectional area of the vascular system, reflecting the functions of the vessels. Lowest flow velocities occur in the capillaries, to allow for exchange of nutrients and metabolites.
Blood flow in a single vessel may be laminar or turbulent. Laminar flow is governed by the Hagen–Poiseuille law. Turbulence occurs at high flow velocities or irregularities such as branching or valves.
Vascular resistance depends on blood vessel geometry and compliance. It is also determined by blood viscosity, which varies with flow velocity.
Arterial system
The main function of the arterial system is to distribute and deliver blood to the capillary beds throughout the peripheral vascular system. A secondary arterial function is to convert the high-pressure pulsatile blood flow of the aorta into the low-pressure steady flow of the capillary beds. This modification of the flow and pressure profiles is achieved by the elasticity of the arterial system and is sometimes referred to as hydraulic filtering, or the ‘Windkessel’ effect (Windkessel – volume of air trapped in a pump reservoir to smooth out pressure variations).
Arterial factors
Flow velocity
In systole, the heart ejects a stroke volume of 70–90 mL blood into the aorta. The heart generates an average flow velocity of 70 cm s−1, with a peak velocity of 120 cm s−1, which makes flow in the aorta turbulent. There is transient backflow at the end of systole until the aortic valve closes. The aorta and arteries distend in systole due to the elasticity of their walls, then subsequent elastic recoil during diastole maintains forward flow distally into the peripheral vascular system.
Pressure wave
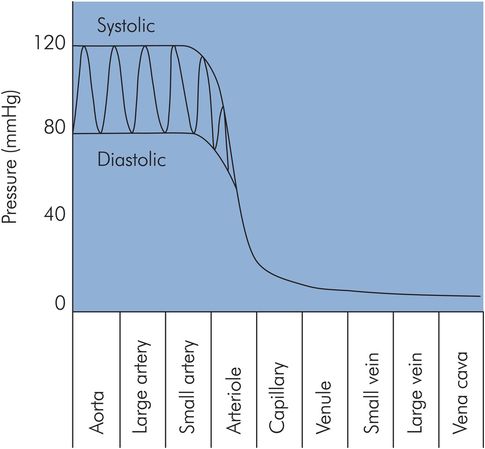
In the aorta and arteries the pressure is pulsatile. The maximum pressure is the systolic arterial pressure (about 120 mmHg) and the minimum is the diastolic arterial pressure (about 70 mmHg). The difference between diastolic and systolic is the pulse pressure, normally about 50 mmHg.
The aortic pressure wave changes in magnitude and shape as it travels through the arterial system. The shape of the pressure wave narrows, and high-frequency features such as the incisura (end-systolic notch) become dampened as it moves distally. Initially systolic pressures increase as the pressure waves travel from the aorta distally through the large arteries. At the femoral arteries systolic pressures have risen by 20 mmHg, and by the time pressure waves have reached the foot systolic pressures are 40 mmHg higher than in the aorta. Pressure pulsations begin to become attenuated in the smaller arteries and are finally reduced to a steady pressure with a mean level of 30–35 mmHg by the arterioles, ready for the capillary beds (Figure 15.12). The changes in the shape of the pressure waves are mainly due to the viscoelastic properties of the arterial walls. The increases in systolic pressure are thought to be due to factors affecting the propagation of the pressure waves through the vessels, such as reflection, resonance and changes in the velocity of propagation.
Mean arterial pressure
Mean arterial pressure (MAP) is the value obtained when the pressure is averaged over time. As shown above, it can be obtained from the product of cardiac output and systemic vascular resistance. Since the pressure varies cyclically, MAP can be determined by integrating a pressure signal over the duration of one cycle (this gives the shaded area shown in Figure 15.13). The mean pressure is then given by the value of this integral divided by time. An estimate of mean arterial pressure may be made by taking the diastolic plus one-third of the pulse pressure.
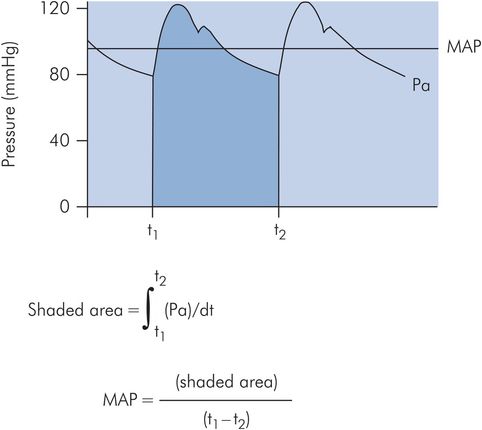
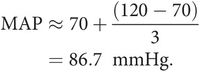
Calculation of mean arterial pressure
For a systolic pressure of 120 mmHg and a diastolic of 70 mmHg:
The factors affecting MAP are summarised in Figure 15.14.
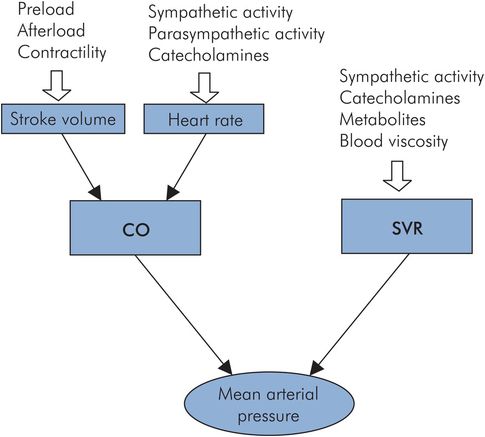
Factors affecting mean arterial pressure
Compliance
The elasticity of the arterial walls provides an essential mechanism for maintaining forward blood flow during diastole. When the aorta and arteries are distended during systole the elasticity of the walls stores kinetic energy from the ejected blood. This stored energy is then returned in diastole by the recoil of the vessel walls. A useful measure of arterial elasticity is the arterial compliance (Ca). Compliance (as in the respiratory system) is the change in arterial blood volume produced by a unit change in arterial blood pressure. Thus, easily distended arteries have a high compliance, and stiff arteries have a low compliance. The reciprocal relationship between Ca and arterial elastance (Ea) should be noted, as Ea is used in describing left-ventricular performance.
Determination of arterial compliance
In vitro – The pressure–volume curves of postmortem aorta preparations have been plotted for different age groups. This is approximately linear in the young normal subject, the gradient of the curve being equal to Ca. With age the arterial walls increase in stiffness and Ca decreases to a fraction of its value in young subjects. In addition, the compliance curve becomes curvilinear in the working arterial pressure range (Figure 15.15).
In vivo – The end-systolic points from different ventricular pressure–volume loops can be plotted for a given subject. This gives an arterial elastance curve in which the gradient is equal to Ea.
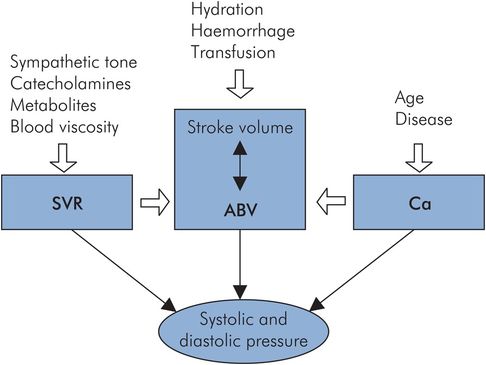
Determinants of systolic and diastolic pressures
The factors determining systolic and diastolic pressures are summarised in Figure 15.16:
Arterial blood volume (ABV)
Stroke volume (SV)
Systemic vascular resistance (SVR)
Arterial compliance (Ca)
Duration of systole
The arterial system can be visualised as a network of elastic vessels containing a varying volume of blood. This volume (ABV) increases with the injection of each stroke volume by the left ventricle (LV) during systole, and decreases with the ‘run-off’ of blood into the systemic vessels during diastole.
During systole, the arterial pressure is dependent on the relationship between SV, Ca and SVR. SV in turn depends on preload and cardiac contractility (see above).
During diastole, the arterial pressure falls exponentially and depends on the systolic pressure and the time constant of SVR and Ca. The minimum pressure reached in diastole (diastolic pressure) is therefore also determined by the duration of diastole.
Factors affecting systolic and diastolic pressure
The way in which systolic and diastolic pressures vary with SV, SVR, Ca and duration of diastole is summarised in Figure 15.17.
| Systolic pressure | Diastolic pressure | Comment | |
|---|---|---|---|
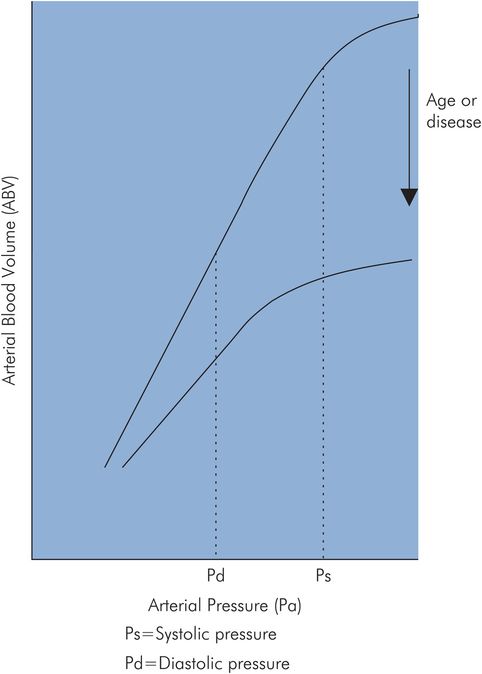
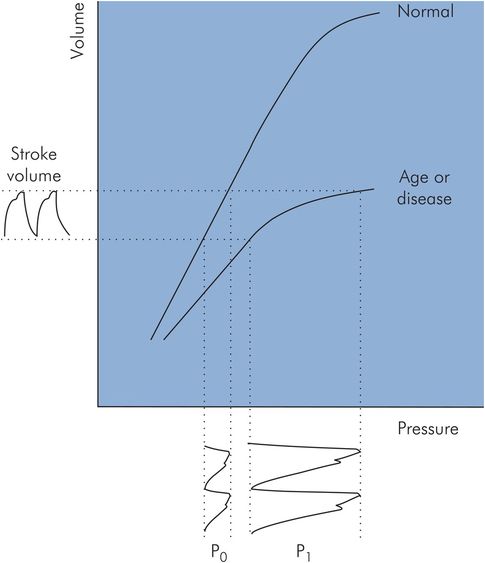
| ↑ Ca | ↓ | ↓ | When arterial compliance is decreased, as with age or disease, the arterial pressure–volume curve becomes non-linear. The effect of this on systolic and diastolic pressures can be seen by comparing the arterial pressure waves produced (P0 and P1) by the same stroke volume, using the normal and decreased arterial compliance curves shown in Figure 15.18. Projecting the stroke volume variation on the normal compliance curve produces the pressure signal P0. Repeating this with the decreased compliance curve gives arterial pressure signal P1. It can be seen that systolic pressure is increased disproportionately compared with diastolic pressure. |
| ↑ SV | ↑ | ↑ | Increasing stroke volume will produce an increase in both systolic and diastolic pressures. |
| ↑ SVR | ↓ | ↓ | Increased SVR, as occurs in chronic hypertension, produces non-linearity in the pressure–volume curve, like the effects of age on the arterial compliance curve. This produces similar increases in systolic and pulse pressures. Increased SVR increases the time constant, slowing the rate of diastolic pressure fall. |
| ↑ Duration of diastole | ↓ | The fall in pressure during diastole is exponential, dictated by the exponential decay constant due to SVR and Ca, so the diastolic pressure will be inversely dependent on duration of diastole. |
Effect of arterial compliance on systolic and diastolic pressures
Technological factors affecting arterial blood pressure
The value obtained for arterial blood pressure is dependent on the method of measurement and the anatomical site where pressure is sampled. Arterial blood pressure measurements are often made non-invasively using an occluding cuff, as with the sphygmomanometer or oscillotonometer. Alternatively, intra-arterial cannulation may be performed and the arterial pressure measured using a piezoresistive transducer.
The arterial system
The arterial system distributes blood to the capillary vessels.
Systolic pressure for a given stroke volume is determined by systemic vascular resistance (SVR) and arterial system compliance.
In systole, when the stroke volume is ejected part of the stroke volume perfuses the peripheral vessels and part expands the elastic vessels.
In diastole, elastic vessels recoil and help to maintain systemic perfusion.
Diastolic pressure is determined by SVR as well as arterial elastic recoil and the duration of diastole.
Venous system
The venous system collects blood from the capillary vessels and lymphatic system to return blood flow to the right side of the heart. It also acts as a reservoir for the blood volume and provides the preload for the right heart.
Venous circulation
Venous blood flow is driven primarily by pressure transmitted from the capillary beds. Venous pressure falls from 15–20 mmHg at the venous end of capillaries to 10–15 mmHg in small veins, and 5–6 mmHg in large extrathoracic veins. Flow in the venules and small veins is continuous. In the great veins, pressure changes due to respiration and the heart beat cause fluctuations in the venous pressure wave. There are three identifiable peaks in the central venous pulse, the ‘a’, ‘c’ and ‘v’ waves, which are related to events in the cardiac cycle. The central venous pulse waveform is described in Chapter 14.
Other secondary mechanisms also assist venous blood flow back to the heart. These are gravity, the thoracic pump and the muscle pump. Unidirectional venous flow is maintained by the presence of valves in the peripheral veins.
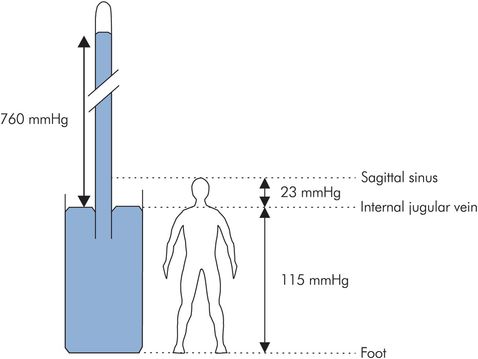
Gravity and the venous system
The pressure in the venous system is largely determined by gravity, since the system can be visualised as a simple manometer (Figure 15.19). In the erect position, a hydrostatic gradient is produced from head to toe.
Gravity and venous pressure
Such hydrostatic pressure differences are reduced significantly by the primary and secondary mechanisms outlined above, and by the presence of valves or venous obstruction. Thus, in the foot venous pressures may only be 80 mmHg when standing and decrease further to < 30 mmHg when walking.
The hydrostatic pressure difference between any two points in the venous system can be calculated by taking the product of the difference in height between the points (h), the density of blood (ρ = 1.050 g cm−3), and the acceleration due to gravity (g = 980 cm s−1). These figures give a pressure difference equivalent to 0.77 mmHg for every centimetre difference in height.
The venous pressure in the internal jugular vein is normally atmospheric at neck level if the vein is collapsed. Venous pressure above the neck may be less than atmospheric and can be estimated: e.g. 30 cm above the neck (sagittal sinus) venous pressure is less than atmospheric by 30 × 0.77 = 23 mmHg.
Similarly in the foot, 150 cm below neck level, venous pressure is greater than atmospheric by 150 × 0.77 = 115 mmHg.
Jugular venous pressure (JVP)
The superior vena cava (SVC) and internal jugular vein effectively form a manometer connected to the right atrium, and are usually collapsed at the level of the neck, being approximately at atmospheric pressure at this point. In the erect position, the level of blood in the internal jugular vein reflects the filling pressure in the right atrium and is not normally visible above the clavicle. The jugular venous pulse may become visible as a pulsatile distension of the internal jugular vein in a reclined or supine position, or when the CVP is increased. The jugular venous pulsations correspond to those of the central venous pulsations as described above. This correlation between jugular venous pulse and central venous pulse is limited if there are any anatomical obstructions to drainage of blood from the superior vena cava.
Cerebral venous pressure and air embolism
In the brain, venous pressure can become sub-atmospheric (< –20 cmH2O), since the skull is a rigid container and the cerebral veins are held open by surrounding tissue. These veins are therefore susceptible to air embolism during surgery or if punctured by needles or cannulae open to air. The air embolus forms bubbles that are compressible compared with blood. If a large enough volume (> 10 mL) of air becomes trapped in the heart ventricles, cardiac output can be reduced significantly, with serious effects. Small amounts of air may pass through the heart to become trapped in pulmonary capillaries and be eliminated by diffusion without ill effects. On the other hand a few millilitres of air if shunted into the left ventricle and systemic circulation could have disastrous or even fatal effects. Gas embolism may also occur under positive pressure during laparoscopic surgery.
Thoracic pump
Normal respiration produces cyclical changes in intrathoracic pressure which increase the venous return to the heart. During inspiration intrapleural pressure decreases from its resting value of –2 mmHg to –6 mmHg. This increase in negative intrathoracic pressure is transmitted to the central veins, reducing CVP and augmenting the pressure gradient between abdomen and thorax, allowing blood to pool in the pulmonary circulation. Central venous blood flow into the thorax may double during inspiration from its resting expiratory level of about 5 mL s−1. Diaphragmatic displacement caudally during inspiration also contributes to increased venous return by increasing intra-abdominal pressure and consequently the abdominothoracic venous pressure gradient. Pooling of blood in the pulmonary circulation during inspiration produces a small decrease in arterial pressure and increase in heart rate. Forced inspiration against a closed glottis (Müller manoeuvre) accentuates these changes.
During expiration, which is normally passive, the diaphragm relaxes, intrapleural pressure returns to resting value, pulmonary blood volume is reduced and blood flow in the large veins decreases. Forced expiration against a closed glottis (Valsalva manoeuvre – see below) can produce positive intrathoracic pressures, with marked changes in heart rate and blood pressure.
The venous system
Microcirculation and lymphatic system
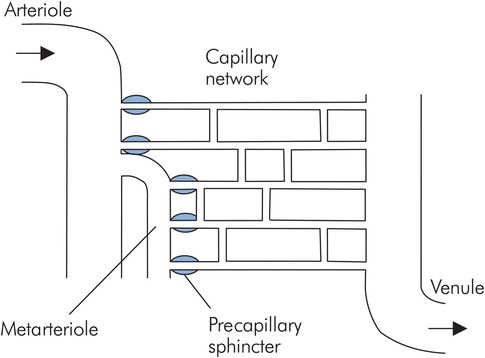
Structure of a capillary network
Capillaries and venules form an interface with a surface area > 6000 m2 for the exchange of water and solutes between the circulation and tissues. Arterioles feed capillary networks via smaller metarterioles, and the capillaries drain into venules. Metarterioles possess smooth muscle contractile elements in their walls and give rise to capillaries through smooth muscle precapillary sphincters (Figure 15.20). While arterioles are supplied by the autonomic system, the innervation of metarterioles and precapillary sphincters is uncertain, and these vessels may only be responsive to local or humoral agents. Capillary blood flow varies according to the activity of the tissue. At rest the majority of capillary beds is collapsed and arteriovenous anastomoses, allowing direct communication between arterioles and venules, shunt blood away from the tissues. These anastomotic channels are widespread in skin and play a prominent role in thermoregulation.
Capillary network
Capillaries and endothelium
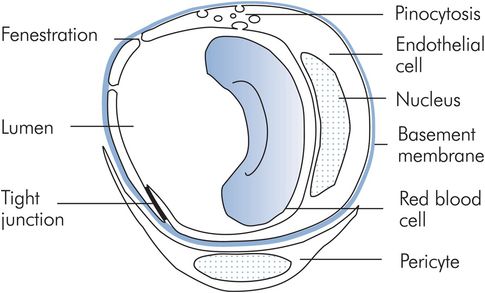
Capillaries contain 6% of the circulating blood volume and measure 5 μm in diameter at their arteriolar end, widening to 9 μm at the venous end. These dimensions are comparable with the 7 μm diameter of red blood cells, which decrease in diameter when traversing capillaries. A capillary consists of a tube formed by a single sheet of endothelial cells resting on a basement membrane. Associated with capillaries and venules are interstitial cells called pericytes, akin to renal mesangial cells. These cells release chemicals that mediate capillary permeability and also secrete the basement membrane (Figure 15.21).
Capillary exchange
Capillaries have differing structures and permeabilities according to the tissues they serve. Most capillaries comprise a continuous layer of endothelial cells. Intercellular junctions and small pores representing about 0.02% of the capillary surface area permit the diffusion of small molecules < 8 nm in size. Larger molecules may cross through cell cytoplasm in vesicles and fat-soluble molecules; water, oxygen and CO2 pass directly across the cell membrane. Fenestrations, gaps of 20–100 nm diameter, appear in the endothelial cells of endocrine glands, renal glomeruli and intestinal villi to facilitate secretion, filtration and absorption. In the sinusoids of the liver and in the spleen, the endothelium is discontinuous with gaps of > 1000 nm. As a result albumin escapes from hepatic sinusoids much more readily than in other tissues. The exchange of water and solutes depends on both active and passive mechanisms.
In capillary vessels the exchange of water, gases and solutes across capillary endothelium occurs by diffusion, filtration, pinocytosis and direct passage.
Related posts:


Stay updated, free articles. Join our Telegram channel

Full access? Get Clinical Tree


