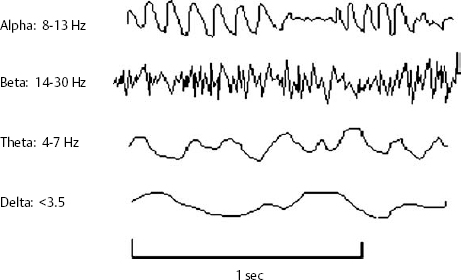
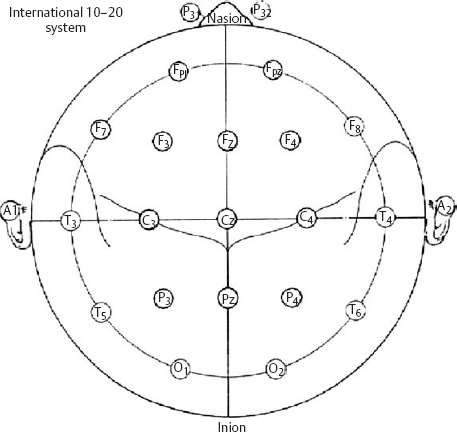
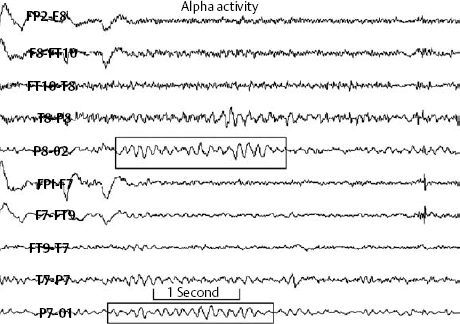
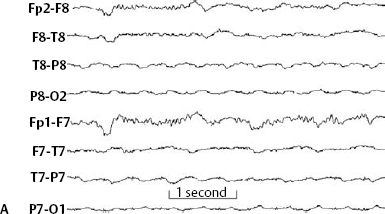
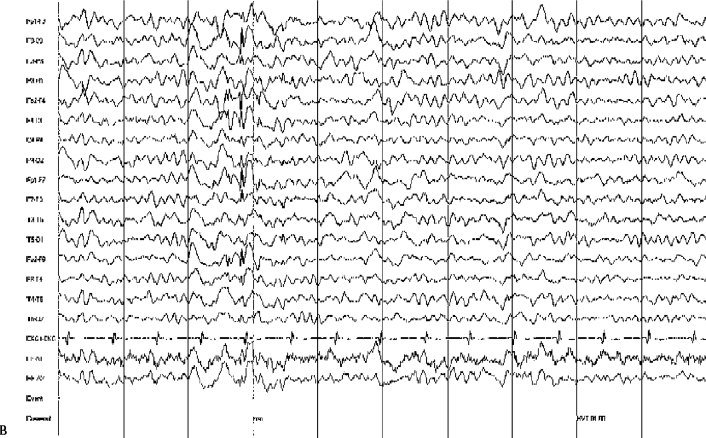
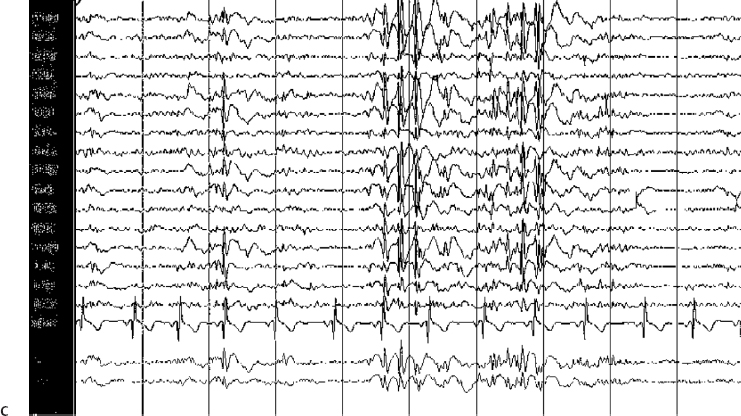
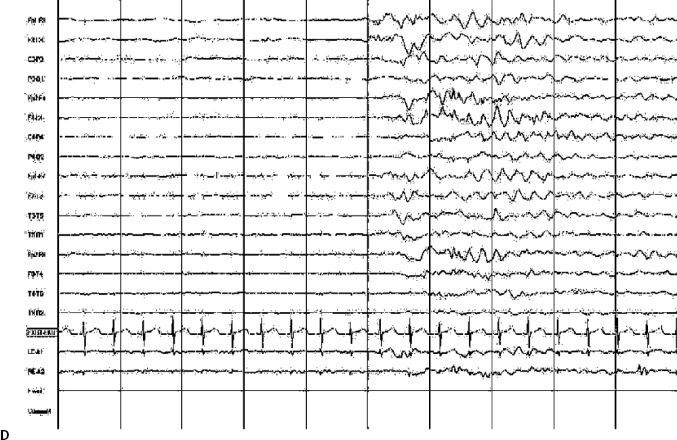
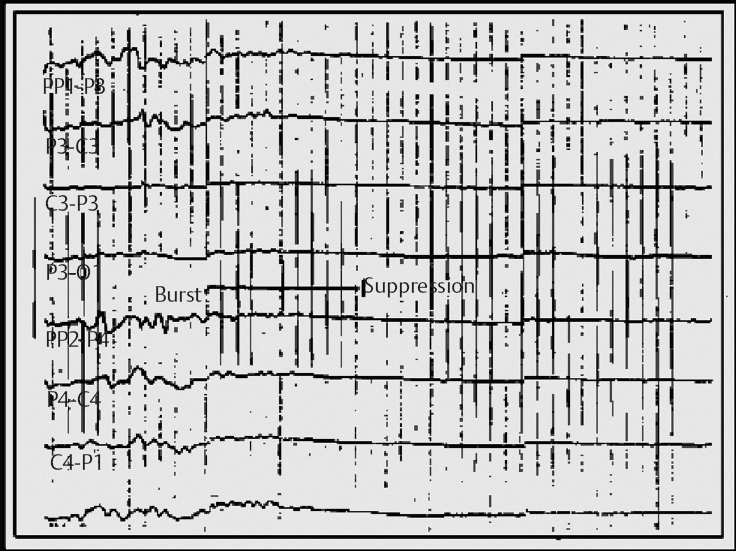
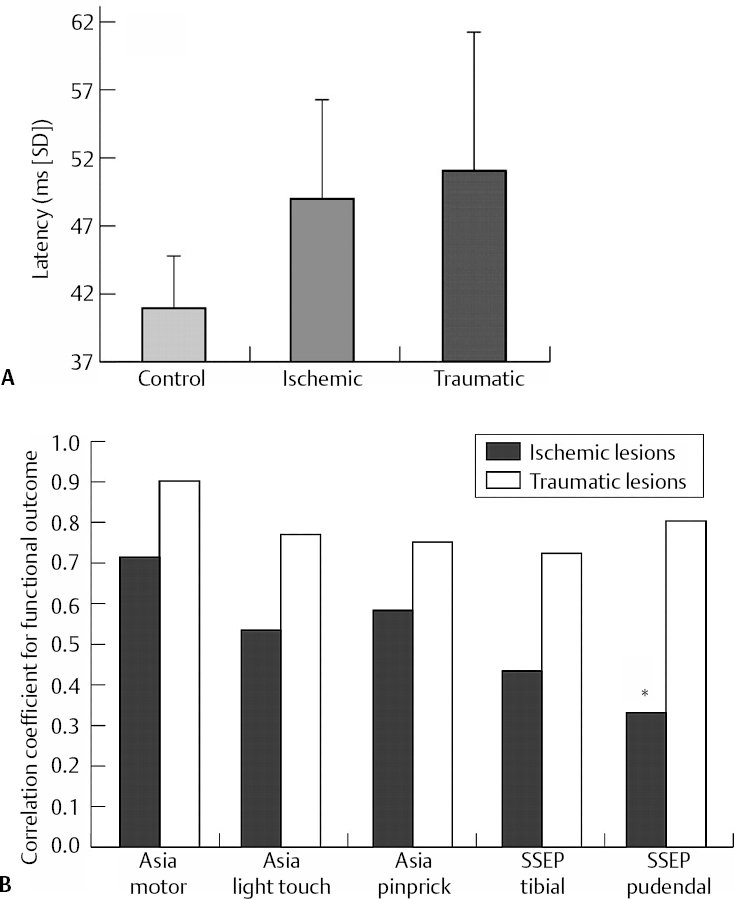
14 Dennis Cramer, Dan Miulli, and Javed Siddiqi The electroencephalogram (EEG) records the sum of neuronal activity within the pyramidal layer of the cerebral cortex.1 The electrode system uses channels (two electrodes per channel) arranged in different combinations, termed montages. Each channel reflects the summation of both excitatory and inhibitory potentials produced by the cell membranes between the two electrodes. EEG monitoring can be effectively used in2 The four basic frequency patterns generated by the brain are referred to as beta, alpha, theta, and delta. Beta is associated with acts of mental concentration, alpha can be found in relaxed patients who have their eyes closed, theta waveforms are often seen during general anesthesia and rapid eye movement (REM) sleep, and delta is most often pathologic or representative of deep sleep (Fig. 14–1). The EEG electrodes are attached in a standardized fashion, termed the International 10–20 system (Fig. 14–2). Even-numbered electrodes are on the patient’s right and odd-numbered electrodes on the left, while electrodes with a z are midline. The letters used are P for parietal attachment, T for temporal, O for occipital, F for frontal, and A for auricular. Figure 14–2 The international 10–20 system of electrode attachment for an EEG. The signal processing in an EEG machine converts the voltage versus time plot to one of frequency plus power versus time. An EEG can filter out extraneous electrical input (i.e., 60 Hz interference) but not physiological “noise” (i.e., cardiac activity). This should be taken into account during analysis. When examining an EEG tracing, the key considerations are the patient’s degree of alertness during the recording and any increased or decreased waveform, particularly if localized to specific channels, which can then be correlated to specific cerebral locations. A normal adult tracing is shown in Fig. 14–3, and common pathological tracings are depicted in Fig. 14–4 (A–D). Burst suppression is an abnormal pattern characterized by bursts of higher voltage sharp wave (8–12 Hz) and slow wave (1–4 Hz) activity appearing out of a background of relatively suppressed voltage. A flurry of activity is seen, followed by a period of electrical silence on the tracing. This can be seen during high-dose anesthesia administration. A common use of burst suppression monitoring is the titration of neuroprotective medications. The end point of titration is the induction of the burst suppression pattern on the EEG (Fig. 14–5). Common burst suppression doses are listed here:3 Figure 14–3 EEG normal adult tracing. Somatosensory evoked potentials (SSEPs) allow for the monitoring of the spinal cord and peripheral nerves, as well as both cortical and subcortical structures. The evoked potential is generated when repetitive stimuli are applied to a peripheral nerve. Responses are then recorded centrally. Common nerves used are the median, ulnar, common peroneal, and posterior tibial. SSEPs are less affected by anesthesia than EEG and are more sensitive indicators of ischemia than EEG monitoring. SSEP waveforms move in parallel to regional blood flow and reflect changes when blood flow falls to near critical levels. It is notable to point out that SSEPs can be affected by medical equipment generating strong electrical fields (i.e., if a computed tomography [CT] scanner is next door to the neurosurgical intensive care unit [NICU]). A finding requiring investigating in SSEPs is an amplitude reduction by more than 50% or increase in latency by 1 msec.4,5 Figure 14–4 EEG pathological tracings: (A) alpha coma, (B) bifrontal partial epilepsy, and (C) generalized tonic-clonic seizure with increasing intracranial pressure (ICP). (D) Closed head injury with increased intracranial pressure. Figure 14–5 EEG burst suppression pattern. SSEPs have the following NICU applications:4 SSEPs can be poor in predicting function in areas of the brain not involved with the somatosensory pathways. SSEPs have been used in evaluating the predicted prognosis of spinal cord injured (SCI) patients in many studies. The tibial or common peroneal nerves are used, and the latency times are compared to those of normal subjects (Fig. 14–6A). Further delineation between ischemic and traumatic SCI patients allows for more specifically tailored outcome. The outcome after rehabilitation can also be predicted using SSEPs (Fig. 14–6B).6
Neurophysiology in the Neurosurgical Intensive Care Unit: Options, Indications, and Interpretations
 Electroencephalogram
Burst Suppression
 Somatosensory Evoked Potentials
Limitations of SSEPs
Predictive Value of SSEPs
![]()
Stay updated, free articles. Join our Telegram channel

Full access? Get Clinical Tree


