Surgical patients are at risk for ischemic/hypoxic injury to the central nervous system (CNS).
 Intraoperative detection of insult to the CNS with neuromonitors may facilitate:
 Early correction before injury becomes permanent.
 Surgical procedure to be tailored to patient’s physiology.
 Monitors of function:
 Electroencephalography (EEG) records the electrical activity of the brain and can thus be used to detect insults, which compromise cerebral metabolism. It is particularly well suited for use in CEA surgery, and when drug-induced metabolic suppression is desired.
 Bispectral analysis (BIS) is a derived value based on EEG recordings, on a normalized scale of 0 to 100, where appropriate hypnosis is thought to occur in the range of 40 to 60.
 Evoked potential monitoring is used to assess the integrity of peripheral and central pathways, including ascending sensory pathways (sensory evoked potentials [SEP]), and descending motor pathways (motor evoked potentials). It is particularly useful during spine surgery where insult to the spinal cord is possible. More specialized evoked monitoring modalities include visual evoked potentials, assessing the visual system, and brain stem auditory evoked potentials, assessing Cranial Nerve VIII and brain stem pathways.
 Monitors of cerebral blood flow (CBF) and intracranial pressure (ICP):
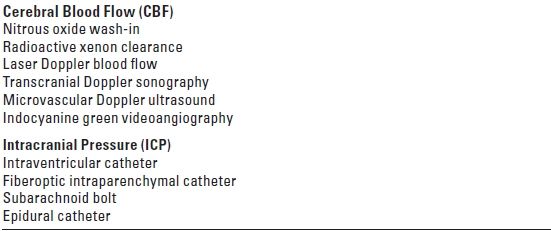
 Laser Doppler flowmetry (LDF) and transcranial Doppler (TCD) ultrasonography both measure relative changes in CBF. TCD measures flow velocity in large basal cerebral arteries, where velocity is proportional to flow. It has numerous applications, including CEA surgery, traumatic brain injury (TBI), stroke, and cerebral vasospasm.
 ICP can be measured with various devices, including an intraventricular catheter, fiberoptic parenchymal device, or a subarachnoid bolt. Measurement of ICP facilitates optimization of cerebral perfusion pressure (CPP).
 Monitors of cerebral oxygenation and metabolism:
 Brain tissue oxygenation (PbtO2) is measured via an intraparenchymal monitor that can be placed in a region of concern, thus allowing localized monitoring of oxygenation.
 Jugular bulb venous oximetry (SjvO2) provides a global view of oxygen supply versus demand for the brain through analysis of cerebral venous drainage.
 Microdialysis catheters are placed in the brain tissue and allow sampling of the interstitial fluid milieu. Excitatory amino acids suggest neuronal damage, glycerol indicates cellular membrane breakdown, and increased levels of lactate suggest ischemia.
 Near-infrared spectroscopy (NIRS) measures cerebral oxygenation in a non-invasive fashion by light transmission through the scalp and skull, which is reflected off hemoglobin in the brain.
For patients who have neurologic disease, there is an increased risk of ischemic/hypoxic injury to the CNS during surgical procedures. This risk may be related to hemodynamic/embolic events associated with a non-neurosurgical operation (e.g., cardiopulmonary bypass [CPB] procedures in patients who have significant carotid stenosis) or the risk may be inherent in the neurosurgical procedure itself (e.g., temporary occlusion of a feeding artery during clip ligation of a cerebral aneurysm). Intraoperative neurophysiologic monitoring may improve patient outcome by facilitating early diagnosis of ischemia/hypoxia before irreversible damage occurs and enabling surgeons to provide optimal operative treatment as indicated by the monitoring parameter. Although not universally adopted, neurophysiologic monitoring has become routine for some surgical procedures in many centers.
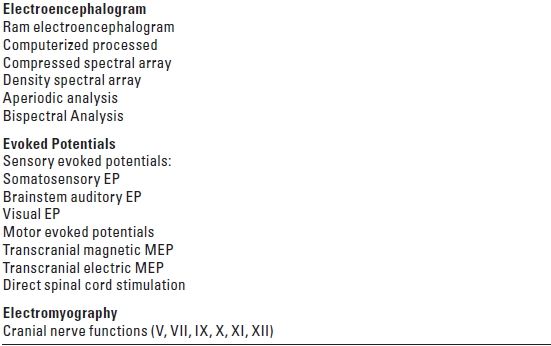
Broadly speaking, the brain can be monitored in terms of function, blood flow, and metabolism (Tables 3.1 to 3.3).
TABLE 3.1 Monitoring of Function

EP, evoked potential; MEP, motor evoked potential.
TABLE 3.2 Monitoring of CBF and ICP

TABLE 3.3 Monitoring of Metabolism

PO2, oxygen tension.
I. MONITORING OF FUNCTION
A. EEG. Summation of the excitatory postsynaptic potential generated by the pyramidal cells of the cerebral cortex gives rise to the electrical activity of the brain, which can be recorded as an EEG. The EEG comprises many underlying components that have different frequencies and harmonics. The component waves are typically classified according to their respective frequencies (Table 3.4). This electrical activity is volume-conducted and can be recorded from the scalp and forehead using surface or needle electrodes.
TABLE 3.4 Electroencephalogram

1. Recording techniques
a. Because the scalp has no electrically neutral area, the EEG is typically recorded using a montage (electrode arrangement) with bipolar recording. Thus, both electrodes are active and the polarity of the signal recorded depends on the arbitrary designation of the recording versus the referential electrode. Other electrical activities generated in the body such as electromyographic and electrocardiographic potentials are minimized but not eliminated using common-mode rejection that rejects the electrical signals that are measured in both recording sites (common) in comparison to a third “ground electrode.”
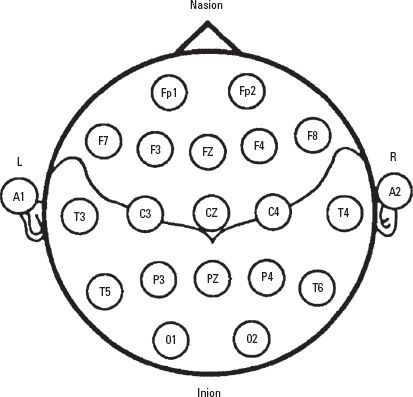
The number of channels used and the placement of electrodes determine the specificity of the EEG as a monitor of the occurrence of regional ischemia. The gold standard for raw EEG recording is the 16-channel recording (eight channels for each hemisphere) with electrodes placed according to the International 10–20 System (Fig. 3.1). With the exception of monitoring in CEA in some centers, 16-channel EEG recording is seldom performed intraoperatively because of its relative complexity and the inaccessibility of recording sites during intracranial surgical procedures.

FIGURE 3.1 The International 10–20 System for placement of EEG electrodes. It is based on dividing each head circumference (anteroposterior from nasion to inion over the vertex, coronal from tragus of one ear to the other) into two halves and then subdividing each half (50%) into 10%, 20%, 20% sectors. Fp, frontal pole; F, frontal; C, central; P, parietal; T, temporal; A, earlobe; M, mastoid (not shown). Odd number subscripts denote the left hemisphere and even numbers denote the right hemisphere.
To simplify recording and interpretation of the EEG, most EEG machines designed for intraoperative monitoring use 2- to 4-channel recording with computer processing to simplify the output. Although different vendors use different algorithms, the basic premise is to filter out the high-frequency activity (likely to be artifacts or interference), typically at 30 Hz. The raw EEG is then separated into its component waves using Fast Fourier Transform, which are then grouped together according to the frequency spectrum. Thus, the raw EEG recorded in a time domain is displayed in a frequency domain. The resultant power (square of the amplitude of the EEG wave) spectrum can be displayed in a number of ways, the most common ones being compressed spectral array and density spectral array with either the peaks and valleys or the density of the gray scale representing the power of the spectrum. Aperiodic analysis is another method of EEG processing that tracks each wave and plots it as a “telephone pole” with its height representing the amplitude or power of the wave.
b. Alternatively, direct electrocorticography (ECoG) can be recorded from the brain surface using strip electrodes placed intraoperatively by the neurosurgeon. This is typically utilized for monitoring seizure activity during epilepsy surgery. With placement of deep brain stimulator (DBS) leads for movement disorders, electrical activity is recorded from microelectrodes placed in the thalamic and subthalamic nuclei.
2. Interpretation of the EEG
a. The EEG is a random activity reflecting the state of arousal and metabolic activity. The generation of electrical activity is an energy-requiring process that depends on an adequate supply of substrates including oxygen and glucose. Thus, significant reductions of blood flow, oxygen, or glucose all lead to the depression of EEG activity. Gradual reductions of CBF can be correlated with characteristic changes in the EEG. The possibility of a decrease in CBF constitutes the most frequent underlying indication for EEG monitoring.
b. The awake EEG is dominated by beta activity with high-frequency and low-amplitude waves. With the onset of ischemia/hypoxia, there is an initial transient increase in beta activity, followed by the development of slow waves (theta and delta) with large amplitude, disappearance of beta activity, and eventually the occurrence of delta waves with low amplitude. The ischemic changes can progress to suppression of electrical activity with an occasional burst of activity (burst suppression) and finally to complete electrical silence with a flat EEG, signaling the onset of irreversible damage. Thus, the sudden development of delta waves coincident with a surgical maneuver such as cross-clamping of the common carotid artery would warn the anesthesiologist and the surgeon that the patient is at risk of cerebral injury.
In the region of the ischemic penumbra where blood flow is inadequate to generate electrical activity but sufficient to maintain neuronal viability for a period of time, the EEG has poor predictive power for brain damage. Thus, EEG is sensitive to the occurrence of ischemia but lacks specificity as a diagnostic test for irreversible damage. In general, the faster the onset of the ischemic EEG changes, the higher the probability of irreversible damage.
3. Confounding factors. The changes in the EEG that are observed with ischemia/hypoxia are not unique; similar changes occur with anesthetic-induced metabolic depression, albeit in a reversible manner. Most intravenous (with the exception of ketamine) and inhalation anesthetics cause a dose-dependent depression of the EEG, and virtually all of them can produce a burst-suppression pattern. Similarly, hypothermia decreases cerebral metabolism and causes slowing of the EEG. EEG changes, therefore, should always be interpreted in the context of the clinical event, not in isolation.
4. Indications for EEG monitoring
a. All surgical procedures that potentially place the brain at risk are theoretically an indication for EEG monitoring. In practice, EEG monitoring is often difficult to perform during intracranial procedures because of the lack of access to scalp recording. The use of needle electrodes may ameliorate this problem. CEA, which places the ipsilateral hemisphere at risk during cross-clamping of the common carotid artery, is the most frequent indication for EEG monitoring. When EEG changes indicate that CBF is inadequate, induced hypertension may improve blood flow. The insertion of an intraluminal shunt will restore flow, albeit with an increased risk of embolic events.
b. Some anesthesiologists and surgeons utilize anesthesia-induced metabolic suppression to provide cerebral protection during risky procedures. EEG monitoring in these circumstances allows optimal metabolic suppression with anesthesia administered by titration to achieve burst suppression. The main indications for EEG monitoring are listed in Table 3.5.
TABLE 3.5 Indications for Electroencephalogram Monitoring

c. Although uncommon in the anesthetized patient, occult seizures occur frequently in patients after TBI in the intensive care unit (ICU). These seizures, which may adversely affect the patient’s outcome, are only detectable with continuous EEG monitoring. Although treatment of these seizures is likely beneficial, it is yet to be determined whether continuous EEG monitoring in the ICU will improve outcome in a cost-effective manner. Furthermore, the use of continuous EEG monitoring in ICU patients at risk for cerebral ischemia, such as those experiencing post–subarachnoid hemorrhage (SAH) cerebral vasospasm, is a potential application of uncertain value.
5. Bispectral analysis. The bispectral index is a derived EEG parameter designed not to detect ischemia but to monitor the degree of hypnosis. Based on both power spectrum analysis and phase change or coherence of the different frequencies, the value is normalized to a range of 0 to 100. A value between 40 and 60 is considered adequate hypnosis to prevent possible recall, whereas a value above 80 is consistent with impending emergence from anesthesia. Strictly speaking, this is not a parameter used to preserve the integrity of the CNS but is derived from the raw EEG and, as such, it is potentially influenced by the occurrence of ischemia that results in changes in the EEG. The frontal location of electrode placement, however, renders the bispectral index less sensitive to the development of regional ischemia. Recent development of commercially available bilateral sensors with software that evaluates EEG symmetry may improve the utility of these monitors when a procedure, such as CEA, places one hemisphere at risk for ischemia.
B. Evoked potential monitoring
1. Sensory evoked potential (SEP) is a time-locked, event-related, pathway-specific electroencephalographic activity generated in response to a specific stimulus such as an electrical stimulus applied to the median nerve. The typical peaks and troughs are described by their polarity and latency (Fig. 3.2
Stay updated, free articles. Join our Telegram channel

Full access? Get Clinical Tree


