Fig. 14.1
MR images from a 48-year-old woman with a near occlusion in the left internal carotid artery and an acute stroke. Top left: Diffusion-weighted image (DWI) shows an area of restricted diffusion and consequent hyperintensity in the left frontal lobe. Top right: The fluid-attenuated inversion recovery (FLAIR) image shows hyperintensity in the corresponding location when compared to the DWI scan. Bottom: Time of flight angiography (TOF angio) images in the axial and coronal plane show reduced flow through the arteries in the left hemisphere. Arrows indicate location of near occlusion
Standard MRI sequences that provide T1-weighting or T2-weighting, and their derivatives, are well known to be insensitive to the immediate effects of cerebral ischemia. However, DWI is highly sensitive and the preferred noninvasive imaging method for detecting acute ischemic stroke [7]. The technique is based on the use of a pair of counter-balanced, pulsed imaging gradients applied in the same direction. The first gradient pulse is used to encode protons as a function of position, whereas the second is used to remove this encoding. If protons are completely static, the counter-balanced gradient pulses have no effect and the resultant MRI signal is proportional to the net magnetization within a volume element (voxel). However, if the protons move between the applications of the gradient pulses, as is the case for water molecules diffusing in biological tissue, then the spatial encoding is not fully removed and is measured as a signal attenuation providing diffusion-weighted contrast. If the degree of diffusion weighting is manipulated in a series of DWI experiments, simple mathematical modeling enables calculation of an apparent diffusion coefficient (ADC) image, which has information distinct from that provided by proton density or relaxation time parameters.
Within minutes of vessel occlusion, failure of the sodium–potassium pump and associated cytotoxic edema leads to an influx of water from the extracellular space to the intracellular space. This impedes the diffusion of water molecules, as cell membranes act as more of a barrier. The restricted diffusion of water molecules results in increased signal intensity on DWI. The use of DWI is approximately 4–5 times more sensitive for detecting acute stroke than is non-contrast computed tomography [8].
The combined use of FLAIR and DWI helps to distinguish acute from subacute and chronic stroke lesions. Given that cerebrospinal fluid (CSF) tends to pool within the infarct zone as time progresses, use of FLAIR imaging (which provides T1-weighted tissue contrast while suppressing signal from CSF) combined with DWI can improve the identification of new lesions near sites of prior ischemic injury, potentially providing insight into stroke physiology and subtype. As FLAIR images typically can detect the presence of an ischemic region by approximately 3 h after stroke [9], normal FLAIR appearance in the presence of DWI hyperintensity provides potential for assessing the time of injury. This is of critical importance given that the only clinically approved therapy for acute stroke at present, recombinant tissue plasminogen activator (rt-PA), requires administration within several hours of stroke onset [10]. Maximizing the use of rt-PA places an increasing need on the availability and capability of MRI for acute stroke.
MRA provides a supportive, noninvasive method to screen for vessel occlusions, stenosis, or malformations. There are at least two MRI techniques available for this purpose, with each performing slightly less sensitively than the gold standard X-ray imaging method, digital subtraction angiography. Three-dimensional time of flight angiography (3DTOF) [11] provides a noninvasive method of assessing the intracranial circulation. The technique is based on the fact that if RF pulses are applied rapidly in succession, there is little time for T1 recovery of longitudinal magnetization. Over time, a steady-state of longitudinal magnetization is obtained that is much lower than the equilibrium magnetization. However, if blood flows into the imaging plane it still retains its equilibrium value and thus exhibits positive image contrast with respect to the background static tissues. This effect enables imaging of the vascular lumen, but only for through-plane flow. Three-dimensional MRI is used to maximize the effect by keeping slice thickness to a minimum. The alternative technique is known as contrast-enhanced magnetic resonance angiography (CE-MRA) [12], involving the intravenous injection of a paramagnetic contrast agent known as gadolinium diethyl-triamine-penta-acetic acid (Gd-DTPA). This agent reduces the T1 value of blood and the enhanced T1 recovery results in increased signal intensity for blood on T1-weighted images, with respect to the signal from static tissues. This technique provides more contrast than 3DTOF and is much less sensitive to flow dynamics within the vasculature. Consequently, CE-MRA can be used more effectively to image extracranial vessels in addition to intracranial vessels. If scan time permits, the two angiographic methods are complementary and use of both 3DTOF and CE-MRA can improve diagnostic ability [13]. However, CE-MRA requires contrast agent administration, which is contraindicated in patients with poor renal function [14].
PWI is similar to CE-MRA in that a bolus of Gd-DTPA is typically administered, although in this case fast imaging (i.e., EPI or a variant) is employed to generate a time series of images to track reductions in T2*-weighted signal intensity of tissues as the contrast agent travels through the microvasculature. Semiquantitative perfusion maps are obtainable from this examination that estimate the cerebral blood volume (CBV)—the blood volume per unit of brain; the mean transit time (MTT)—the average time required by the bolus of contrast agent to cross the capillary network; the cerebral blood flow (CBF)—the volume of blood flowing per brain mass and per unit of time (i.e., mL/100 g tissue/min); and several other parameters that quantify the minimal signal intensity and latency of the bolus within the capillary network [15]. When combined with DWI, both imaging datasets provide information about the ischemic core and about the ischemic penumbra. It was originally thought that the difference between the spatial extent of perfusion deficit and DWI hyperintensity reflected the ischemic penumbra. It is now known that DWI hyperintensity can resolve in many stroke patients, and that the extent of perfusion deficits does not necessarily reflect the true extent of the penumbra. Irrespective of these issues, however, the imaging sequences have been demonstrated to be of benefit for identifying patients that are good candidates for rt-PA therapy [16] and for clinical trials aimed at developing new acute stroke therapies, such as mechanical embolectomy [17].
Lastly, T2*-weighted imaging has multiple applications in acute stroke. These applications stem from the fact that the T2* of blood varies with oxygenation content, based on the magnetic susceptibility characteristics of hemoglobin. Oxygenated hemoglobin is diamagnetic, causing a slight decrease in the applied magnetic field that is supported within blood, whereas deoxygenated hemoglobin is paramagnetic, causing increased magnetic field within red blood cells. The abnormal accumulation of deoxygenated blood thus provides hypointensity on T2*-weighted images as an indicator of vascular pathology. Studies have shown that T2*-weighted images are capable of detecting acute hemorrhage with equivalent accuracy to CT [8]. Microbleeds, indicative of multiple types of micro-angiopathy, are also detected on T2*-weighted images [18] that are not visualized on CT due to insufficient signal contrast and spatial resolution. T2*-weighted images are also capable of depicting hemorrhagic transformations of ischemic infarcts, as well as depicting thrombosed veins or sinuses. Lastly, T2*-weighted applications have been enhanced in recent years through use of a technique known as susceptibility-weighted imaging (SWI), which provides improved characterization of susceptibility changes in the brain microvasculature for angiography, venography, and detection of atherosclerosis and thrombosis [19].
MRI in Stroke Recovery
MRI may have an expanded role related to stroke in the future. Although MRI is often viewed as not widely accessible and expensive, its versatility and non-invasiveness make it well-suited for neuroscience studies involving stroke patients to understand more about stroke pathology and the process of recovery (in the presence or absence of therapeutic interventions). Ultimately, there is the possibility that if useful new interventions arise from such studies, then MRI could be used as a biomarker in the clinical setting. The neuroscience studies involving MRI of stroke patients are numerous. In the remainder of this chapter, several representative examples are provided that illustrate the breadth of the opportunity, and also the challenges that lie ahead.
MRI for Neuroanatomical Correlates of Stroke Symptoms
Given the spectrum of deficits exhibited by stroke patients, the variability in location and extent of lesions caused by stroke, and the current imperfect understanding of normal brain function, it is not surprising that there are a substantial number of studies that investigate how stroke lesions in specific brain locations correlate with behavioral deficits. The use of stroke patients as a “knock-out” model of brain function can help to clarify the role of a given brain region; however, many strokes do not affect only one or two discrete brain functional areas, so definitive conclusions and findings must be corroborated through replication, using MRI and other methods. For stroke patients, improved knowledge of how damaged neuroanatomical structures relate to behavioral deficits can potentially be important in the refinement of cognitive and physical rehabilitation strategies.
An interesting example of structural analysis comes from a study that used high resolution T1-weighted and FLAIR images to overlay lesion locations from a cohort of 44 ischemic stroke survivors [20]. Using a method known as voxel-based lesion symptom mapping (VLSM), Molenberghs and colleagues identified brain lesions that were correlated with cognitive deficits observed when participants performed the sustained-attention to response task (SART). For example, lesions in the right inferior frontal gyrus were associated with an increase in the number of errors of commission, reflecting impairments of inhibition and sustained attention (Fig. 14.2).
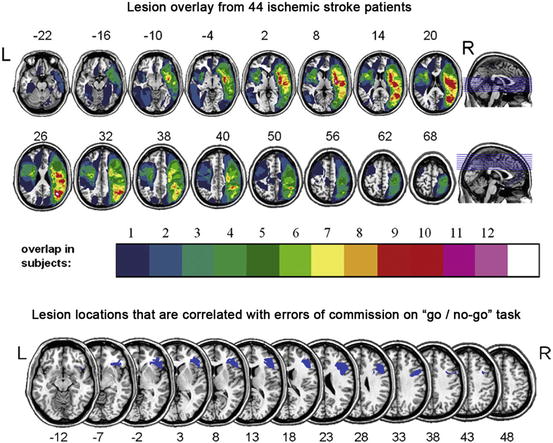
Fig. 14.2
Top: Color overlay of lesions from a group of 44 stroke survivors. Bottom: Results of voxel-based lesion symptom mapping (VLSM) identifying the inferior frontal gyrus as positively correlated with errors of commission when performing the sustained-attention to response task (SART). In other words, individuals that had a lesion in this location tended to have a higher number of errors compared to others in the cohort (based on published work) [20]
Other examples of work in this area involve use of MRI-derived voxel-based morphometry (VBM) or cortical thickness measures estimated by sophisticated image-processing techniques. Based on differences in signal intensity in high resolution T1-weighted images, it is possible to “segment” or classify cortical grey matter from CSF and cortical grey matter from subcortical white matter. The tissue boundaries can then be represented as convoluted surfaces, with point-to-point thickness estimates obtained by projecting a surface normal (a line oriented 90° from a given surface) such that the other surface is intersected. A recent study used VBM to help classify stroke patients that responded positively to epidural motor cortex stimulation compared to nonresponders [21]. Another recent study measured changes in cortical thickness associated with surgical revascularization in patients with severe cerebrovascular steno-occlusive disease [22]. At present, the latter methodology can be limited by the available signal contrast and SNR at 3.0 T, but in future developments it may be possible to resolve multiple cortical layers using ultrahigh field MRI [23].
Diffusion Tensor Imaging
It has been known since the 1990s that water diffusion in certain tissues is anisotropic [24]. The effect is pronounced in white matter tracts with diffusion preferentially occurring along the length of axons and more restricted in the orthogonal directions. The myelination of axons, the axonal membrane, and microtubules within axons are all thought to contribute to water diffusing in a preferred direction. If a series of DWI scans are conducted with diffusion weighting in a variety of different orientations, it is possible to determine the direction and magnitude of diffusion and the correlations between diffusion in different directions, which can be modeled mathematically using an anisotropic diffusion tensor—hence the term “diffusion tensor imaging” (DTI) [25]. A minimum of seven DWI experiments with different diffusion orientations (including one experiment with no diffusion weighting) are required to calculate basic diffusion tensor parameters, although encoding more diffusion directions improves data quality and enables more sophisticated modeling. Thus, DTI experiments are often time-consuming (approximately 10 min or longer), even when EPI techniques are used for spatial encoding. The technique can be sensitive to a variety of different image artifacts, including head motion, as the signal attenuation measured in DWI experiments does not differentiate well between movement of water molecules on a microscopic or a macroscopic scale.
Data provided by DTI enable calculation of “rotationally invariant” signal contrast parameters that are theoretically independent of which gradient orientations are chosen for diffusion weighting (as long as they are well-spaced in orientation). The mean diffusivity provides contrast similar to that of the ADC, by providing a weighted average of diffusion in three orthogonal directions. A parameter known as the fractional anisotropy (FA) quantifies the extent that there is a preferred diffusion direction within a particular voxel. The FA value for grey matter is thus lower than that for white matter, potentially providing a rich source of information relating to brain connectivity.
It is well established that the location of lesions due to stroke will strongly influence the potential for recovery. From lesion analysis work, it is known that a stroke in the internal capsule is particularly problematic for motor recovery because the output of motor signals converges on this subcortical brain structure [26]. One of the related, major appeals of DTI for stroke recovery research is the ability to visualize the integrity of the corticospinal tract. Studies have shown that DTI can be used to probe the integrity of the corticospinal tract within the first weeks after stroke and that the early DTI measures are highly correlated with residual motor function in the acute and chronic stages [27]. Thus, DTI measures can help to determine whether a patient has the potential to recover a particular behavior or not, depending on the integrity of the descending white matter fibers.
DTI data can also be used for tractography, which is a noninvasive means for mapping the paths of white matter fibers in the brain [25]. Although such maps can be generated in MRI acquisition times of approximately 10 min, even longer acquisitions continue to be beneficial at present. This is, in part, because the diffusion tensor model for white matter is rather simplistic and does not account well for regions of the brain that have crossing fiber tracts. More sophisticated models require more gradient orientations, and high spatial resolution is paramount. Thus, DTI is a promising methodology for use in stroke patients, but the most practical additional information at present is obtained from use of FA information. For example, Schweizer and colleagues [28] reported a patient with subarachnoid hemorrhage who exhibited memory and executive functioning impairment 1 year post-hemorrhage. DTI revealed a significant reduction in white matter integrity (as indicated by reduced FA values) in the right hippocampus and the left dorsolateral prefrontal region, which are the precise areas expected to be involved in a patient with these cognitive deficits. Lastly, Fig. 14.3 shows DTI tractography results implicating the involvement of specific fronto-parietal and fronto-occipital pathways in stroke patients with left hemi-spatial neglect [29].
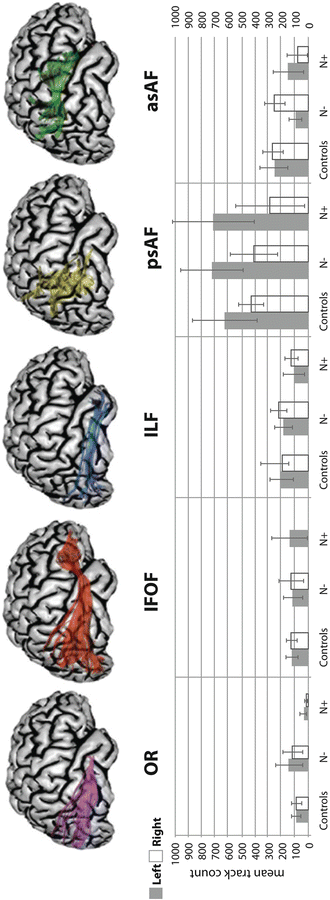
Fig. 14.3
Top: Diffusion tensor imaging (DTI) tractography of six fiber tracts shown for 3D-reconstructed healthy brain: the optic radiation (OR); the inferior fronto-occipital fasciculus (IFOF); the inferior longitudinal fasciculus (ILF); the posterior segment of the arcuate fasciculus (psAF); and the anterior segment of the arcuate fasciculus (asAF). Bottom: Mean track count (number of estimated fiber tracts) with 95 % confidence intervals for the left (grey) and right (white) hemisphere for all tracts for a group of 12 healthy controls and groups of stroke patients without (N−) and with (N+) left hemi-spatial neglect (six and six patients, respectively). The stroke patients show substantial left–right asymmetries in the psAF and asAF compared to controls, with a substantially reduced track count in the right asAF for patients with neglect (based on work published elsewhere) [29]
Functional MRI
Blood oxygenation level-dependent (BOLD) fMRI [30–32] has revolutionized neuroscience through its capability to measure signal changes associated with neuronal activity generated by sensory stimuli, or behavioral tasks involving memory, cognition, action, or emotion. Neurons communicate with glial cells and the nearby microvasculature to signal for the delivery of additional blood through vasodilation, when neuronal activity levels increase. The neurovascular unit that governs such processes represents the ultimate spatial resolution achievable with hemodynamic measures of brain activity, in the range of hundreds of microns [33], although typically fMRI studies are conducted with voxel dimensions of several millimeters. Researchers have determined that the local field potentials arising from healthy populations of neurons are strongly correlated with BOLD fMRI signals [34].
In normal brain, the BOLD fMRI response to neuronal activity is characterized by three distinct phases: (1) a fast response lasting 1–2 s when there is a small decrease in the BOLD signal; (2) a relatively large amplitude hyperemia that is caused by the inflow of more highly oxygenated blood, peaking approximately 4–5 s after the stimulus; and (3) a refractory period lasting 5–10 s where the BOLD signal undershoots and then reaches the baseline [35]. The period of hyperemia provides the most robust means to detect increases in brain activity [36]. These signal characteristics are a complex function of multiple physiological parameters such as CBF, CBV, cerebral rate of metabolic oxygen consumption, and hematocrit. However, the key properties used for generating fMRI, through which these other parameter changes are viewed, are the amounts of oxy- and deoxy-hemoglobin within the neurovascular unit and consequently the local magnetic field at the microscopic level. Thus, the predominant method for measuring BOLD fMRI signal changes at 1.5 and 3.0 T involves using T2*-weighted EPI technique to generate time-series data during periods of neuronal activity. The resulting signal changes are typically quite small, only a few percent from signal baseline.
Task-Based BOLD fMRI
The majority of the fMRI literature includes task-based experiments, whereby participants alternate between different behavioral or stimulus conditions to induce a measurable BOLD signal change. For example, the simplest approach is to alternate between one specific stimulus/task and a resting condition (often visual fixation on an image with a centrally located cursor). When the stimulus/task in question is of very brief duration (approximately 100 ms to several seconds), the experimental design is described as “event-related,” whereas longer duration task and control condition periods (typically 15–30 s) are used in “block designs.” In stroke recovery research the majority of fMRI studies have used a block design primarily because the block design affords greater detection sensitivity in terms of the BOLD time course data [37]. Irrespective of the experimental design, the task of interest is undertaken in multiple repetitions to improve the ability to detect brain activity under limited SNR conditions.
The first task-based fMRI experiment involving stroke patients dates back to 1997, when Cramer and colleagues [38] visualized the brain regions involved when stroke survivors moved their affected limb. Since this pioneering work, there have been numerous other fMRI studies that have helped to characterize brain activation patterns that indicate positive or negative outcomes after stroke. Despite the heterogeneous nature of lesions and behavioral deficits in stroke patients, some “rules of thumb” have become evident. One sign of poor recovery is significant activation in the unaffected hemisphere (i.e., contralateral to the side of the lesion) when performing a task that would normally lateralize to the affected hemisphere in normal individuals. For example, a recent study found that activation of the left inferior frontal gyrus was associated with improvement in picture naming and sentence comprehension in stroke patients recovering from aphasia, whereas activation of the right inferior frontal gyrus was associated with poorer behavioral performance, possibly due to up-regulation of nonlinguistic cognitive processing [39]. Calautti and Baron discuss fMRI in stroke recovery in more detail, by looking at cross-sectional and longitudinal fMRI studies [37]. Their review also addresses the laterality index metric, which is a quantitative measure of activation that is detected in contralateral and ipsilateral hemispheres.
One of the challenges of task-based fMRI in stroke recovery research is the issue of task performance. It is important to characterize properly what the patient “does” during fMRI, to rule out the possibility that their activation patterns are different from normal individuals simply because they did the task differently (e.g., speed and extent of a motor task, and force and level of effort associated with a motor task). One strategy to circumvent this important confound is to measure relevant biophysical signals concurrently during fMRI, such as electromyography (EMG) [40] or electrodermal activity (EDA) [41, 42]. EMG provides important information regarding the timing and intensity of muscle contraction, and potentially the muscle groups that are activated if multichannel EMG is conducted. EMG is also important for determining if mirror movements confound the interpretation of brain activation patterns, when unilateral movement is prescribed. Alternatively, EDA recordings provide an indirect probe of the autonomic nervous system and associated aspects of arousal, emotion, and sense of effort. EDA data have been used to characterize sense of effort (and brain activity in the contralesional hemisphere) during the performance of a motor task with the affected limb post-stroke, as represented in Fig. 14.4.
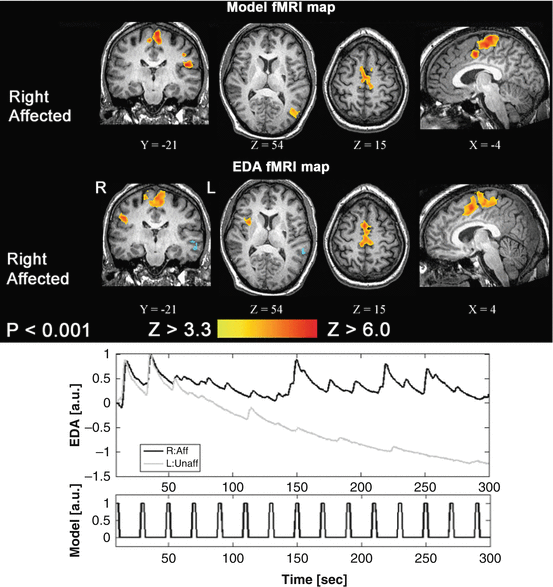
Fig. 14.4
 Dysexecutive Syndrome After Stroke
Clinical Outcomes, Stroke Trials, and Cognitive Outcome
Dysexecutive Syndrome After Stroke
Clinical Outcomes, Stroke Trials, and Cognitive Outcome
 Behavior After Aneurysmal Subarachnoid Hemorrhage: Cognition and Functional Outcome
 Limb Apraxia: Types, Neural Correlates, and Implications for Clinical Assessment and Function in Daily Living
 Spatial Neglect: Not Simply Disordered Attention
 Cognitive Dysfunction After Intracerebral Hemorrhage, Vasculitis, and Other Stroke Syndromes


Top: Task-based fMRI activation associated with movement of the right affected ankle. The two activation patterns are generated by using a standard fMRI model and as an alternative approach the electrodermal activity (EDA) directly. Bottom: The two EDA traces show different features when the stroke patient moved their affected versus their unaffected limb (based on work published elsewhere) [40]
Related posts:
Dysexecutive Syndrome After Stroke
Clinical Outcomes, Stroke Trials, and Cognitive Outcome
Behavior After Aneurysmal Subarachnoid Hemorrhage: Cognition and Functional Outcome
Limb Apraxia: Types, Neural Correlates, and Implications for Clinical Assessment and Function in Daily Living
Spatial Neglect: Not Simply Disordered Attention
Cognitive Dysfunction After Intracerebral Hemorrhage, Vasculitis, and Other Stroke Syndromes
Stay updated, free articles. Join our Telegram channel
Full access? Get Clinical Tree
